EXPERIMENTAL INVESTIGATION OF CHANGES IN -DECAY
COUNT RATE OF RADIOACTIVE ELEMENTS
Yu.A. BAUROV111alex@theor.phys.msu.su
Central Research Institute of Machine Building,
141070, Korolyov, Moscow Region, Russia
Yu.G. SOBOLEV222ak@sky.chph.ras.ru, V.F. KUSHNIRUK and E.A. KUZNETSOV
Flerov Laboratory of Nuclear Reactions (FLNR),
Joint Institute for Nuclear Research,
141980, Dubna, Moscow Region, Russia
A.A. KONRADOV333sobolev@main1.jinr.dubna.su
Russian Academy of Sciences, Institute of Biochemical Physics,
117977, Moscow, Russia
ABSTRACT
The experimental data on continuous investigation of changes in -decay count rate of and from 9.12.98 till 30.04.99, are presented. The 27-day and 24-hour periods in these changes, inexplicable by traditional physics, have been found. PACS numbers: 24.80+y, 23.90+w, 11.90+t
1. Introduction In Refs. [1-3], periodic variations in -decay rate of , , and , have been first discovered. An analysis of the 24-day period in -decay of radioactive elements as well as of the daily rotation of the Earth in various seasons of the year has led to selection of some spatial direction characterized by the fact that near the points of the Earth’s surface where the latitude tangent line to a parallel passes through this direction, the decay count rate of radioactive elements changes. The main drawback of the experiments [1-3] was that their final results gave no possibility to clearly understand what was an effect of the ”internal life” of the setup itself and what was due to the phenomenon of interest. In addition, the duration of these experiments was no more than three weeks, which did not allow to analyze long-period harmonics.
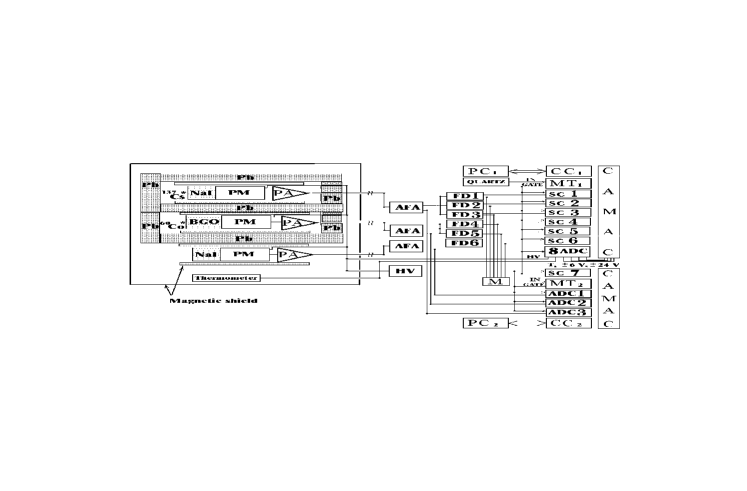
The aim of this paper is to find an answer to the above questions, using measurements of flux of -quanta in the process of -decay of radioactive elements as in ref. [1]. 2. The diagram of the setup. The experimental setup (Fig.1) consisted of three scintillation detectors, two of them being standard spectrometric scintillation detecting units BDEG2-23 on the basis of NaI()-scintillator (63mm in diameter, 63mm in height) and FEU-82 photomultiplier (PM) with standard divider. One of these units was used to indicate the background radiation, and the second one was to present -radiation of . The third detector was a BGO-scintillator (46mm in diameter, 60mm in height) and a FEU-143 photomultiplier with standard divider. This detector was used to display the -radiation of a -source.
To diminish the influence of magnetic fields on the PMs, the detectors were placed into protecting screens made as cilynders from ten sheets of annealed permalloy 0.5 mm in thickness. The internal diameter of the cylinders was equal to 10 cm, and the height was 70 cm.
The detectors were placed in such a manner that the photocathodes of PMs were at a distance of one-half of height of the cylinder. The -sources were placed just on the end face surface of the scintillators through the center of the input window. All the detectors and the temperature-sensitive-element were positioned inside the metallic cube ( cm3) used as an additional magnetic shield. The thickness of the steel walls of the cube was equal to 3 mm. The detectors with -sources were surrounded by lead protection 5 cm in thickness. 3. The system of registering experimental information. The system of registering information consisted of two subsystems. The first one was designed for accumulating information on the counting rate in ten-second intervals from scintillation detectors as well as on the temperature, power-source voltages (high voltage of PMs, voltage of CAMAC ) and impulse noise of crate power supply. The second subsystem of information storage were made to record ”marked” energetic distributions from scintillation detectors for the purpose of checking the stability of their amplitude distribution parameters (stability of discriminator thresholds, shape of amplitude distributions etc.). 3.1. The spectrometric sections. The set included three identical spectrometric registering sections (see Fig.1). Each section consisted of a preamplifier (PA)-emitter follower matching the impedances, spectrometric amplifier (AFA) with active filters having shaping time constants [4], and system of fast discriminators (FD) of negative output signals of the amplifier and counters of gated pulses (SC). In addition, the positive output signal of the spectrometric amplifier AFA from each registering channel was fed to analog-to-digital converters (ADC) [5] placed in a separate crate. To increase reliability of spectrometric section, all variable resistors in which, as almost 20-year operating experience has shown, sometimes the contact arm faults take place (when continuously adjust amplification in AFA and the threshold in FD), were replaced by the fixed resistors. The PMs of all sections had the general high-voltage power supply. 3.2. The system of monitoring and recording parameters. In long-term experiments, the most important requirement upon the measuring system is the possibility of continuous control over its parameters as for detecting non-stable elements, units, and connections, so to refine possible correlations of measurable quantities with the environmental parameters. The experimental setup was powered from separate terminals of distributing board for diminishing the possible influence of additional parallel loads in the power network.
To monitor the temperature of the environment, a thermometric channel with high-sensitive temperature element and amplifier module was used. This element was made on the basis of assembly of semiconductor diodes with the summary thermoelectric coefficient about 10 mV/degree. The amplifier module gave stable bias current for the temperature-sensitive element and additionally amplified the signal up to the summary termoelectric coefficient of the measuring channel of 100 mV/degree. In the same module a transformer of voltage from high-voltage power supply of the scintillation units into low voltage for 8ADC (see below) was arranged. The transformation ratio was about 3.3 V/kV.
In the measuring crate with the counters, amplifiers AFA, and the amplifier module of the thermometric channel, we have placed also a multichannel amplitude-to-digital converter 8ADC for measuring high voltage (HV) of the scintillation detectors and monitoring the secondary power voltages of the crate CAMAC itself, as well as a special module to register the impulse noise of these secondary power sources. Any impulse input in the crate power line with an amplitude more than 10mV recorded ”1” into the corresponding information bit of the word register of module data. The frequency spectrum of recorded impulse signals extended from tens Hz to several MHz. Thus we recorded impulse noise of the crate along with monitoring levels of constant high voltages of the power source of the scintillation units as well as low voltages of the crate power sources.
The start of measuring cycle and quantization of exposure time in the first recording subsystem were organized by a ”Master-Trigger” MT1. It comprised a pulser with quartz stabilization of frequency of output pulses (QUARTZ) and a scaling circuit. Each cycle of measurements in the experiment started with generation of a ten-second exposure signal (GATE) by the unit MT1. This signal opened all counters of the setup (SC1-SC6). After the ten-second signal of exposure of the counters, MT1 elaborated a signal ”LAM” for the controller CC1 of the measuring crate to organize a cycle of interrogation of the crate recorders and transmission of date to the storage PC1. The data file, transmitted to PC1 in each interrogation cycle, included the following data words: - the number of readings in the counters SC1-SC6 bits,
- the codes of voltages of CAMAC sources bits,
- the code of voltage of the high-voltage power source
of the scintillation units 15 bits,
- the code of the recorder of impulse noise 4 bits. The 15-digit codes with 8ADC contained 12 bits of the voltage code and 3 bits of the channel number.
The characteristics of the sections: a) Sensitivity (the exposure time 10 s with an accuracy of s):
| ”” | = | 5mV per channel; |
| ”High-voltage power” | = | 750 mV per channel; |
| ”” | = | 12.5mV per channel; |
| ”Temperature” | = | for 40 channels. |
b) Thresholds of the section NaI() (calibration against -lines 662 keV, 1173 keV, 1332 keV):
| the ”low” threshold | = | 7 keV; |
| the threshold ”under the peak” | = | 425 keV; |
| the threshold ”on the peak” | = | 657 keV. |
c) Thresholds of the background section NaI () (calibration against -lines 662 keV, 1173 keV, 1332 keV):
| the ”low” threshold | = | 11 keV. |
d) Thresholds of the BGO-section (calibration against -lines 662 keV, 1173 keV, 1332 keV):
| the ”low” threshold | = | 35 keV; |
| the threshold ”under the peak” | = | 745 keV. |
The start of measurements in the second recording subsystem was organized by the ”Master-Trigger” MT2 from any signal of the discriminators FD1-FD6 (chosen by the experimenter by way of switching from one channel to another in the module M). The unit MT2 opened by its GATE-pulse the amplitude-code converters ADC1-ADC3, ”spectrum mark” counter SC7, and triggered the cycle of recording information into the storage computer PC2 after the time of amplitude-digital code transformation. The GATE-pulses from the MT1 unit of the first recording subsystem were fed to the counter SC7 input. Thus the counter gave information on numbers of ten-second exposure intervals of the first subsystem. This allowed to perform analysis (in ”off-line” mode) of the amplitude distribution parameters of the chosen channel of recording in any combination of ten-second exposures.
4. The basic results of the experiment. Brief discussion.
The long-term dynamics of the radioactive decay of and over the period from 9 December 1998 till 30 April 1999, was measured. The above described setup made it possible to perform precision measurements with monitoring parameters of the system at the different discrimination thresholds of decay energy. The spectra in the channels for are presented in Figs.2-4 with the corresponding thresholds. As an example, in Fig.5 the results of measurements over two-week time interval at the end of March, 1999, are shown, for 7 main variants of channels.
| Variants of channels | Measurements |
|---|---|
| 1. | BGO, the threshold of Fig.3-type; |
| 2. | BGO, the threshold of Fig.2-type; |
| 3. | NaI1 with the threshold in Fig.3; |
| 4. | NaI1 with the threshold in Fig.4; |
| 6. | NaI1 with the threshold in Fig.2; |
| 12. | Internal temperature of the setup; |
| 13. | High voltage (HV) in channels NaI1,2 and BGO. |
In the present paper we shall analyze only the channel 6 corresponding to the minimum threshold of discrimination at which only low-energetic noise component was cut off, and the channel 12. From Fig.5 one can conclude that the channel with the low discrimination was the most stable though with a remarkable local dispersion: the data densely fill a relatively broad band.
The starting series have more than points in summary length over the whole time interval of observation. Each point corresponds to a ten-second interval of decay number accumulation. Hence, the summary duration of continuous measurements was hours, or days.
When analyzing the periodical structure of the series we were interested in periods no shorter than several hours. In Fig.6 the results of normalized the starting series (i.e. reducing to the interval [0,1]) averaging over one-hour period, are given. With such hourly averaging, the ”fast” component of dispersion disappeared, and the slow dynamic of the process was clearly seen. It is also clear from the Figure that the temperature inside the setup varied in antiphase with the count rate. This is well seen in the whole long series and, partially, in Fig.5. The cross-correlation function of these two series has a sharp minimum approaching -0.95 at the zero lag. This allowed us to take into account the temperature dependence of count rate measurements by way of simple addition of two normalized series. The Fourier-analysis (fast Fourier transformation - FFT) of the final temperature-compensated series have revealed two distinctly distinguishable periods. In Fig.7 a pronounced 27-day period is seen that may be caused, for example, by the influence of the Sun’s rotation around its axis (the synodic period of the Sun’s rotation relative to the Earth is equal to 27.28 days). In the hour-scale of the periods in Fig.8, a 24-hours period is well marked. It should be emphasized that this daily period is absent in the spectrum of the dynamic of the temperature itself (see Fig.9) and is found only in the dynamic of the radioactive decay, so that it can have an external cosmic reason, too.
Now let us consider the statistics of extremum values of the series of measurements. Evaluate more accurately the extent of nonuniformity of distribution of extremum values for the starting (10-second) series of observations in the low-threshold channel over the time of astronomical day. This procedure was described earlier [3]. Here we give its brief presentation.
Under an extremum we mean here a value for which the modulus of difference with the average for the whole series is no lesser then two standard deviations. Ascribing to each extremum value that instant of day time at which this extremum was observed we shall have the resulting set of time instants in the interval from 0 till 24 hours when ”jumps beyond two sigmas” were measured. The ”null hypothesis” consists in that the extremum events occur with equal frequency in any time of day, i.e. the distribution of these instances is uniform over the day cycle. The hypothesis of uniformity of distribution can now be validated, for example, by the Kolmogoroff-Smirmoff’s test. In Figs.10 and 11 the results of computations are presented. The time of day laid as abscissa is expressed in degrees ().
As a reference point, the time from beginning of observations is taken (the start on 9 Dec. 1998 at of astronomical time - the local time. The whole time of experiment was divided for this analysis into exact decades in days). The values of difference between the sample and uniform distribution functions for each moment of day time are plotted as ordinates (in degrees). With the dashed line the confidence levels of Kolmogoroff-Smirnoff’s criterion () are shown. An exit beyond these limits denotes a significant difference of the distribution from the uniform one, and the maximum point indicates the time of day (phase) when this nonuniformity was maximum. In Fig.10 the results for the maximum values, and in Fig.11 for minimum values are given.
The existence of reliable nonuniformity denotes presence of a daily period in the statistics of extremum values of the radioactive decay. A knowledge of phase (moment of maximum nonuniformity) as well as relation to the absolute time (from the beginning of the series) allows us to determine possible cosmic references connected with such a nonuniformity.
The analysis of the extremum jumps have shown that they overlie tangent lines to the Earth’s parallels making an angle of with the direction having the right ascension coordinate that insignificantly () differs from the direction fixed in Refs.[1-3,6]. It should be noted also that, as background measurements in the channel 5 have shown (the flux of particles in this channel was no more then 50 particles per ten second), the oscillations of the background (due to the smallness of its flux as compared with that ( per second) going beyond the scope of ) by no means could influence on the distribution of temporal coordinates of the extremum points.
References
- [1] Yu.A.Baurov, V.L.Shutov, Prikladnaya Fizika, 1, 1995, p.40 (in Russian).
- [2] Yu.A.Baurov, A.A.Konradov, V.F.Kushniruk, Yu.G.Sobolev. Scientific Report 1995-1996, ”Heavy ion Physics”, E7-97-206, p.354-355, Dubna.
- [3] Yu.A.Baurov, A.A.Konradov, V.F.Kushniruk, Yu.G.Sobolev. Global anisotropy of space and experimental investigation of changes in -decay count rate of radioactive elements, E.-print hep-ex/9809014, 16 Sep. 1998.
- [4] A.N.Kuznetsov, V.G. Subbotin, In the book: X Intern. Symp. on Nucl. Electronics, zfk-433, v.1, p.148-151, Dresden., 1981.
- [5] A.N.Kuznetsov, V.G. Subbotin, Preprint JINR, 13-83-67, Dubna.
- [6] Yu.A.Baurov, Structure of physical space and new interaction in nature (theory and experiments), poster report on the International Workshop ”Lorentz Group, CPT and Neutrinos” (Zacatecas, June 23-26, 1999, Mexico), E.-print hep-ph/9907239, 5 July 1999.
![[Uncaptioned image]](/html/hep-ex/9907008/assets/x2.png)
Fig.2.
![[Uncaptioned image]](/html/hep-ex/9907008/assets/x3.png)
Fig.3.
![[Uncaptioned image]](/html/hep-ex/9907008/assets/x4.png)
Fig.4.
![[Uncaptioned image]](/html/hep-ex/9907008/assets/x5.png)
Fig.5.
![[Uncaptioned image]](/html/hep-ex/9907008/assets/x6.png)
Fig.6.
![[Uncaptioned image]](/html/hep-ex/9907008/assets/x7.png)
Fig.7.
![[Uncaptioned image]](/html/hep-ex/9907008/assets/x8.png)
Fig.8.
![[Uncaptioned image]](/html/hep-ex/9907008/assets/x9.png)
Fig.9.
![[Uncaptioned image]](/html/hep-ex/9907008/assets/x10.png)
Fig.10.
![[Uncaptioned image]](/html/hep-ex/9907008/assets/x11.png)
Fig.11.