Structure Functions, the Gluon Density, and PQCD Tests
Abstract
Measurements of the proton structure function for and from ZEUS 1994-1997 measurements are presented. From ZEUS 1994 and 1995 data the slopes at fixed and for at fixed are derived. For the latter E665 data are also used. The transition region in is explored using the simplest non-perturbative models and NLO QCD. The data at very low are described successfully by Regge theory. From a NLO QCD fit to ZEUS data the gluon density in the proton is extracted in the range . Data from NMC and BCDMS constrain the fit at large . Assuming the NLO QCD description to be valid down to , it is found that the sea distribution is still rising at small and the lowest values whereas the gluon distribution is strongly suppressed. Preliminary ZEUS 1996-1997 measurements are also presented.
I Introduction
The deep inelastic scattering process is used to probe the structure of nucleons. Ultra-high energy transfers are achieved at the DESY laboratory, in Hamburg, Germany, where 820 GeV protons are collided with 27.5 GeV positrons for a center-of-mass energy =300 GeV. The deep inelastic scattering (DIS) process at HERA is illustrated in Fig. 1. The variables are related by .
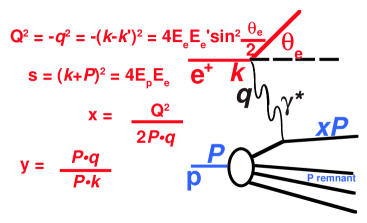
In the range examined here the double differential cross-section for single virtual-photon exchange in DIS is given by
| (1) |
where is related to the longitudinal structure function by and gives the radiative corrections to the Born cross-section, which in this kinematic range are at most . For we take values given by the BKS model [2].
Measurements of for are presented. The rapid rise of at low can be seen. The measurements are fit to pQCD and Regge motivated functions. These measurements illuminate the region where QCD breaks down because .
The ZEUS 1995 measurement increased the kinematic coverage in the low and region. The coverage for between and was made possible by the installation of a small electromagnetic sampling calorimeter, the Beam Pipe Calorimeter (BPC), at small positron scattering angles. The proton structure function and the total cross-section have been published [1]. Results for between and were made possible by a set of runs in 1995 with a mean interaction vertex shifted 70 cm in the direction of the incoming electron. The QCD fits presented also used data from the 1994 ZEUS measurement and from E665.
These data sets are fit using QCD and Regge functional forms. The slopes are extracted. The combined sample is fit using DGLAP. The results of the DGLAP fit are used to extract the gluon density.
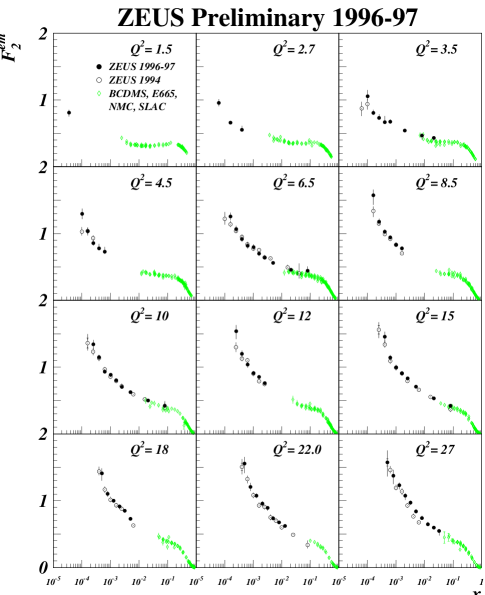
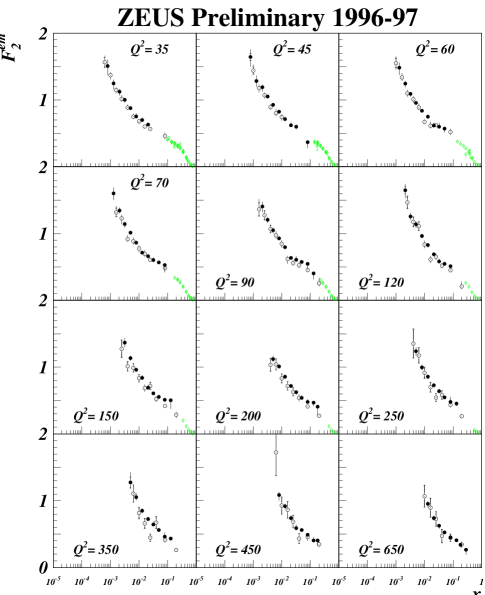
Also shown are preliminary results the 1996-97 ZEUS measurements. There is reasonable agreement with the 1994 ZEUS results. The 1996-97 measurement fills in the region between the 1994 ZEUS results and results from fixed target experiments. The 1996-97 results also have data at higher .
II The ZEUS detector.
ZEUS [3] is a multi-purpose magnetic detector. The primary components used in these analyses are the uranium calorimeter, the beam pipe calorimeter, tracking detectors, and luminosity monitors. The coordinate system is defined such that the -axis follows the proton direction, and the origin is the nominal interaction point.
The ZEUS compensating uranium-scintillator calorimeter covers the polar angle region with full azimuthal coverage over this region. Its energy resolution for electromagnetic showers is , and for hadronic showers is . The Beam Pipe Calorimeter is placed outside the main Uranium calorimeter and at an angle of almost so that it can measure outgoing electrons at down to . The ZEUS tracking detectors primarily provide vertex reconstruction. ZEUS has cylindrical central tracking chambers and forward and rear tracking chambers, operating in a solenoidal 1.43 T magnetic field.
The luminosity is determined from the rate of Bethe-Heitler bremsstrahlung () events in detectors near the beamline.
III fits and the transition region.
Three ZEUS data samples are used to examine the transition region. The ZEUS 1994 DIS ZEUS sample required an electron of 10 GeV in the uranium calorimeter, GeV GeV, and an event vertex in the range . The 1995 shifted vertex sample used a different nominal vertex, so the event vertex is required to lie in the range . The 1995 Beam Pipe Calorimeter sample required that an electron be contained in the BPC rather than the uranium calorimeter. Because the BPC is at smaller than the uranium calorimeter, the BPC sample can reach lower .
Low () results at ZEUS show the transition region from pQCD to the Regge region. 1995 BPC data are binned in and fit to a Donnachie-Landshoff[4] Regge parameterization of the form
where and denote the Pomeron and Reggeon contributions. This is the ZEUSREGGE curve in figure 2.
Results from the 1994 , 1995 shifted vertex and E665 are also fit with the QCD based model. The kinematic range covered by this data is and . This data is fit by solving the DGLAP evolution equations at NLO in the scheme [5].
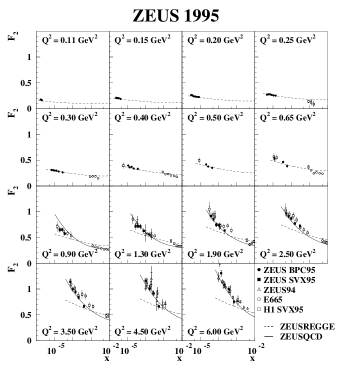
The 1994, 1995 and E665 samples are binned in and their slopes were extracted. These slopes are compared with QCD and Regge predictions. A GRV parameterization and the ZEUS QCD fit are shown for the higher data. For the low region the Regge fit to ZEUS data and a global Donnachie-Landshoff[4] fit are shown. Neither type of parameterization can describe the data in the transition region from high to low .


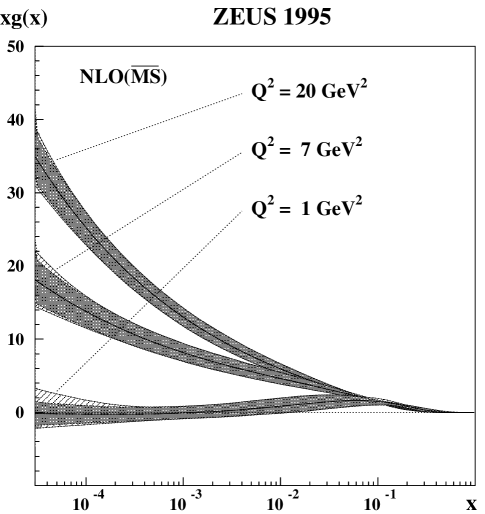
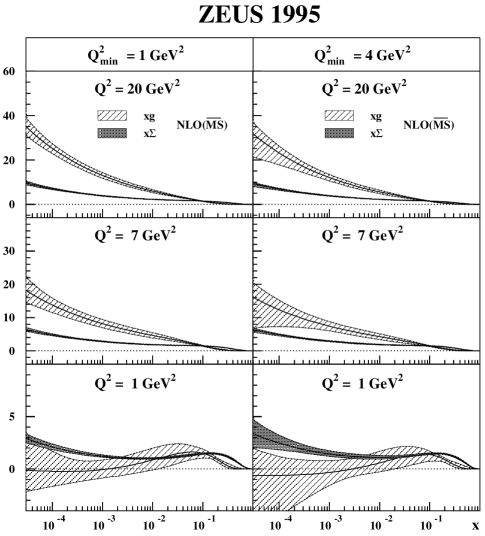
The ZEUS94[6] and the 1995 shifted vertex data are fit in order to extract the gluon and quark densities at low . They are fit by solving the DGLAP [8] evolution equations in NLO in the scheme [5]. For this fit the starting scale is . For data with , backwards evolution in are performed. The gluon distribution (), the sea quark distribution () and the difference of up and down quarks in the proton () are parameterised as
| (2) | |||||
| (3) | |||||
| (4) |
The input valence distributions and at are taken from the parton distribution set MRS(R2) [9]. As for MRS(R2) we assume that the strange quark distribution is a given fraction of the sea at the scale . The gluon normalization, , is fixed by the momentum sum rule, that is, the total momentum fraction carried by quarks and gluons is required to add up to unity. There are 11 free parameters in the fit.
The fit yields a gluon distribution that rises dramatically as decreases for of . The gluon distribution is consistent with 0 for of . It is not constrained to be greater than 0 in the fit. A negative gluon distribution is not in contradiction with NLO QCD as long as the cross sections calculated from the parton distributions are positive for all and in the fitted kinematic region. This is the case for the fit values shown here. The sea quark distribution rises at low even for of . This can be interpreted as higher energy gluons generating pairs.
IV 1996-97 .
The ZEUS 1996-1997 measurement is split into two samples. The high measurement uses the full of data taken in 1996-1997 run. The low measurement uses only of data. The combined measurements cover a range and an x range of . Most bins have systematic errors of 3-4%. At high and low y, the error is as high as 10%. The high measurement has better statistics than the 1994 ZEUS measurement.
The data was taken by requiring a positron with energy GeV. The accepted events were also required to have GeV GeV, and an event vertex in the range cm cm.
The efficiency of the cuts is determined by comparing the data to a Monte Carlo that used the CTEQ4D parton densities. Figure 5 shows a comparison of several data and Monte Carlo quantities. The efficiency of the cuts as determined by Monte Carlo is 90%.

The ZEUS 1996-1997 data sample fills in many of the gaps between fixed target experiments and the 1994 ZEUS sample. The errors are smaller than the 1994 sample. The 1996-1997 sample shows agreement with the 1994 sample and with previous fixed target experiments.
For a fixed , the ZEUS 1996-1997 rises dramatically as decreases(see Figures 6 and 7). Also, for a fixed , rises with (see Figure 8).


REFERENCES
- [1] ZEUS Collaboration, J. Breitweg et al., Phys.Lett. B407 (1997) 432..
- [2] B. Badelek, J. Kwiecinski and A. Stasto, Z. Phys. C74 (1997) 297.
- [3] ZEUS Collaboration, The ZEUS Detector Status Report, DESY 1993.
- [4] A. Donnachie and P. Landshoff, Z. Phys. C61 (1994) 139.
-
[5]
G. Gurci, W. Furmanski and R. Petronzio, Nucl. Phys. B175 (1980) 27;
W. Furmanski and R. Petronzio, Phys. Lett. 97B (1980) 437 and Z. Phys. C11 (1982) 293. - [6] ZEUS Collaboration, M. Derrick et al., Z.Phys. C72 (1996) 399.
- [7] M. Glück, E. Reya and A. Vogt, Z.Phys. C67 (1995) 433.
-
[8]
G. Parisi, Proc 11th Recontre de Morionde (1976);
G. Altarelli and G. Parisi, Nucl. Phys. B126 (1977) 298;
V. Gribov and L. Lipatov, Sov. Jour. Nucl. Phys. 15 (1972) 438;
L. Lipatov, Sov. Jour. Nucl. Phys. 20 (1975) 94;
Y. Dokshitzer, Sov. Phys. JETP 46 (1977) 641; - [9] A.D. Martin, R.G. Roberts and W.J. Stirling, Phys. Lett. B387 (1996) 419.