Neutrino-induced upward-going muons in Super-Kamiokande
Abstract
Upward-going muons observed by the Super-Kamiokande detector are produced by high-energy atmospheric neutrinos which interact in rock around the detector. Those which pass completely through the detector have a mean parent neutrino energy of GeV, while those which range out inside the detector come from neutrinos of mean energy GeV. The neutrino baseline varies with the observed muon zenith angle, allowing for an independent test via disappearance of the neutrino oscillations observed in the Super-Kamiokande contained events. 614 upward through-going and 137 upward stopping muons were observed over 537 (516) live days, resulting in a flux of () . The observed stopping/through-going ratio is lower than the expectation of . Both the shape of the zenith angle distribution of the observed flux and this low ratio are inconsistent with the null oscillation hypothesis, but are compatible with the previously observed oscillations. Taken as a whole, the addition of these higher energy data to the contained neutrino events provides a better measurement of the oscillation parameters, narrowing the allowed parameter range to and at 90% confidence.
I Introduction
The Super-Kamiokande (“Super-K”) atmospheric neutrino analyses presented in[1] and updated in these proceedings[2] provide evidence for flavor oscillations. These analyses examine neutrinos whose interaction vertices are inside the water of the Super-K detector[3, 4]. However, to extend this analysis to higher energies, where the steeply falling power law spectrum of the neutrinos’ cosmic ray parents reduces the absolute flux of atmospheric neutrinos, a larger interaction volume must be used. This is accomplished by studying the products of neutrino interactions in the rock surrounding the detector.
Energetic atmospheric or interact with the rock surrounding the Super-K detector and produce muons via weak interactions. While the constant rain of cosmic ray muons overwhelms any downward-going neutrino induced muons, upward-going muons are neutrino induced because upward-going cosmic ray muons cannot penetrate the whole Earth. The flavor of these parent neutrinos is or , as and induced electrons and positrons shower and die out in the rock before reaching the detector. Detection of upward-going muons resulting from from tauons produced in or charged current interactions is suppressed by branching ratios and kinematics to of the induced muon flux. Thus, the upward-going muon technique results in a reasonably pure sample of muon-flavored neutrinos, allowing a test of possible disappearance due to flavor oscillations.
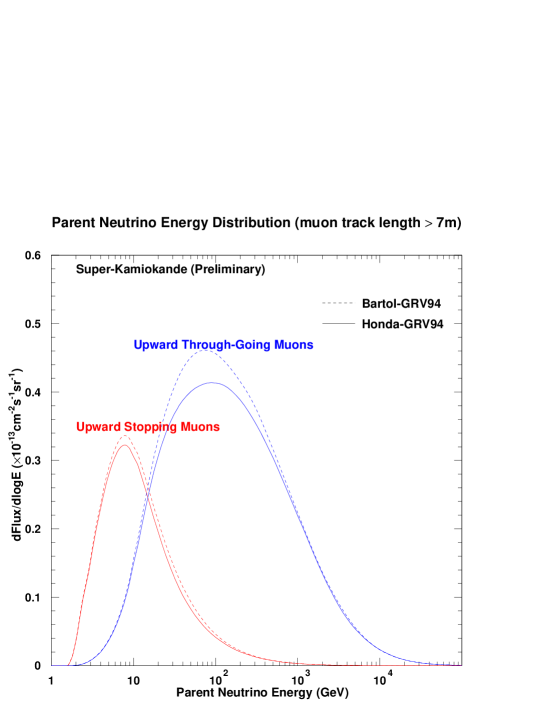
Those muons energetic enough to cross the entire detector are defined as “upward through-going muons”[5]. The mean energy of their parent neutrinos is approximately 100 GeV. Those upward-going muons that range out inside the detector are defined as “stopping upward-going muons”, and come from parent neutrinos with a mean energy of about 10 GeV. In comparison, the “Partially Contained” events from[4] have a similar parent neutrino spectrum to that of the stopping upward-going muons, the “Multi-GeV” neutrinos from[4] typically have several GeV of energy, and the “Sub-GeV” neutrinos from[3] are less than a GeV. The upward-going muon parent neutrino spectra are shown in Fig. 1.
II The Experiment
The Super-K detector is a 50 kton cylindrical water Cherenkov calorimeter located at the Kamioka Observatory and administered by the Institute for Cosmic Ray Research of the University of Tokyo. To reduce the cosmic ray muon background, the detector is placed 1000 m underground in the Kamioka mine, Gifu prefecture, Japan. The detector is divided by an optical barrier instrumented with photomultiplier tubes (“PMT”s) into a cylindrical primary detector region (the Inner Detector, or “ID”) and a surrounding shell of water (the Outer Detector, or “OD”) which allows the tagging of entering and exiting particles. Details of the detector can be found in Ref. [3]. An upward-going muon is defined as an event that appears to enter from the rock and is traveling upwards. Thus, PMT activity in the OD at the muon’s entrance point is required, and those events which also have an OD signal at the muon’s exit point are classified as through-going. Note that a neutrino interaction inside the water of the OD itself also produces an “entering” signal, so some small fraction () of the upward-going muon sample actually originates in the OD rather than the rock. This effect is accounted for in the expected flux calculations.
The cosmic ray muon rate at Super-K is 2.2 Hz. The trigger efficiency for a muon entering the detector with momentum more than 200 MeV/ is 100% for all zenith angles. The nominal detector effective area for upward-going muons with a track length 7m in the ID is 1200 m2.
The data used in this analysis were taken from Apr. 1996 to Jan. 1998, corresponding to 537 days of detector livetime for the through-going muon analysis and 516 live-days of the stopping muon analysis. Event reconstruction is made by means of the charge and timing information recorded by each hit PMT. The direction of a muon track is first reconstructed by several automated grid search methods, which find the track by minimizing the width of the residual distribution of the photon time-of-flight subtracted ID PMT times. Finally, an independent double hand-scan of all upward-going muon candidates (event loss probability 0.01%) is then done to eliminate bad fits and to obtain a final precision fit.
A minimum track length cut of 7m (1.6 GeV) was applied. This cut serves to eliminate short pathlength events that are very close to the PMTs and thus hard to reconstruct, as well as providing a large energy threshold and eliminating non-muon showering background. To reduce the abundant downward-going cosmic ray muons, events satisfying are selected, where is the zenith angle of the muon track, with corresponding to upward-going events, and the down-going muons satisfying are used to estimate the up/down separation resolution near the horizon. After a visual scan by two independent groups and a final direction hand-fit, 614 through-going and 137 stopping upward-going muon events with remain.
Due to the finite angular resolution () and multiple Coulomb scattering in the nearby rock, some down-going cosmic ray muons may appear to have . The estimation of this background in the nearly horizontal zenith angle bin is done by fitting the nearly horizontal down-going cosmic ray muon zenith angle shape and projecting its tail below the horizon (see [5] for a detailed discussion). This background is estimated to be 4.3 through-going and 13.2 stopping events, all contained in the last (closest to horizontal) zenith angle bin. The stopping muon sample has a larger contamination than the through-going sample due to the lower energies allowed in the stopping muon sample, and is more uncertain due to lower statistics. The contamination at the Kamioka site due to cosmic ray photoproduced upward-going pions[6] and electromagnetic showers (from charged current or neutral current interactions) meeting the 7m track length requirement is estimated to be 1%.
The total detection efficiency of the complete data reduction process for upward through-going muons is estimated by a Monte Carlo simulation to be 99% which is uniform for . Using the upward/downward symmetry of the detector configuration, the validity of this Monte Carlo program has been confirmed by downward-going cosmic ray muon data.
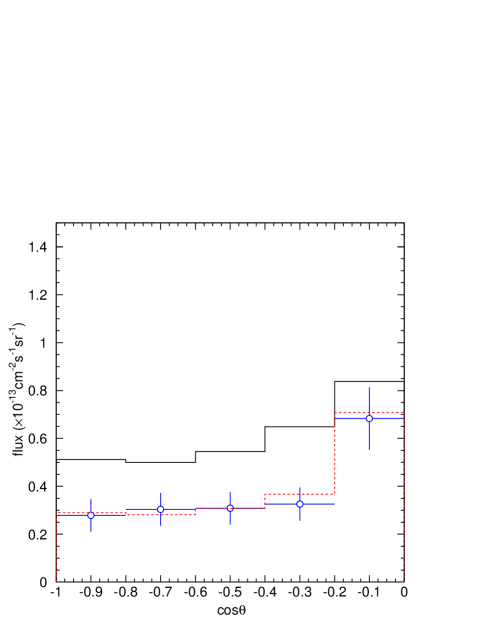
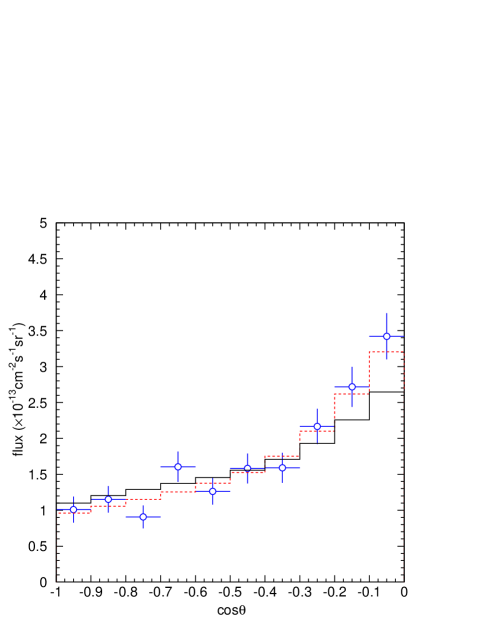
The resulting total flux observed in each of the two upward-going muon samples integrated over the whole lower hemisphere is listed in Table I. The flux plotted as a function of zenith angle can be seen in Fig. 2. The lower statistics available for the stopping upward-going muon analysis is the reason for the coarser binning of those events.
III Expected Flux
To predict the expected upward-going muon flux, this analysis used a model which is a combination of the atmospheric neutrino flux from Honda et al [7] and a neutrino interaction model composed of quasi-elastic scattering [8] + single-pion production [9] + deep inelastic scattering (DIS) multi-pion production. The DIS cross-section is based on the parton distribution functions (PDF) of GRV94DIS [10] with the kinematic constraint of GeV/c2. Lohmann’s muon energy loss formula in standard rock [11] is then employed to analytically calculate the expected muon flux at the detector. This flux is compared to three other analytic calculations to estimate the model-dependent uncertainties of the expected muon flux. The other flux calculations use the various pairs of the Honda flux, the GRV94DIS PDF, the atmospheric neutrino flux model calculated at Bartol [12], and the CTEQ3M [13] PDF. These comparisons yield the theoretical systematic errors used in the calculations. In this analysis, Honda’s input flux is used as the primary input so as to be more directly comparable with the contained event analysis[1], which is also based upon the Honda flux.
The Honda+GRV94DIS calculation results in an expected muon flux shown in Table I for . The dominant error in the absolute flux comes from the absolute normalization uncertainty in the input neutrino flux, which is estimated to be approximately % [12, 7, 14] for neutrino energies above several GeV. The dominant error in the ratio comes from the uncertainty in the slope of the cosmic ray spectrum. The parent neutrino energy spectrum is shown in Fig. 1. Note the clear separation in energies of the stopping and through-going upward-going muon parents.
| Observed | Expected | |||
| Through | 614 | 695 | ||
| Stop | 137 | 244 | ||
IV Upward-going muons and neutrino oscillations
The probability of a neutrino produced as a remaining that way is :
| (1) |
where is the square of the mass difference of the two neutrino flavors, is the mixing angle, is the distance the neutrino has traveled since production (the “baseline”), and is the neutrino energy. Of these, and are the experimental handles on the problem. While the ’s indirectly detected via their daughter muons cannot be fully kinematically reconstructed in the same way as the contained neutrino interactions, there are several ways in which the upward-going muon signal is changed by oscillations.
First, oscillations produce a lower absolute flux of . The power of this test is reduced by the large () theoretical uncertainty in the absolute flux, but maximal mixing over many oscillation lengths would result in a 50% reduction in flux, so this test is still useful.
Second, as the zenith angle of the neutrino’s arrival direction changes, the baseline changes. Note that only zenith angles from the nadir () to the horizon () are accessible in the upward-going muon analyses, as there is no way to tell if a downward-going muon’s parent is a neutrino or, far more likely, a cosmic ray-induced muon. Neutrinos arriving vertically upward travel roughly 13,000 km, while those coming from near the horizon originate only 500 km away. The effect of oscillations is more pronounced for neutrinos traveling the longer distances (those having a larger in Eq. 1), distorting the shape of the zenith angle distribution in favor of fewer vertically upward-going muons. This shape comparison is fairly free of theoretical and systematic errors, the bin-to-bin errors ranging from %[5]. As can be seen in Fig. 2b, the no-oscillation through-going muon predicted shape does not fit the data well (), even after allowing the overall normalization to float downwards by 10%.
Finally, since the two available samples of upward-going muons have parents of different energies, those having the smaller in Eq. 1 would have a larger chance to oscillate. This reduces the observed flux of stopping upward-going muons compared to that of the higher energy upward through-going muons. Forming a ratio of the fluxes is a useful way to make this comparison, since much of the absolute theoretical uncertainty divides out. Thus, oscillations reduce , lowering . As can be seen in Table I, the observed is lower than that expected for the no-oscillations case, and Fig. 2a dramatically shows the loss of stopping muon flux.
We estimated the most likely values of and using using both the 10 zenith angle bins of upward through-going muon flux and the 5 stopping upward-going muon zenith angle flux bins. The expected flux for a given set of and is calculated and the same binning is applied to this flux as to the data. To test the validity of a given oscillation hypothesis, we minimize a which is defined as:
| (2) |
where () is the statistical (experimental systematic) error in the observed flux for the th bin, is an absolute normalization factor of the expected flux, and is a comparative normalization between stopping and through-going fluxes. The absolute flux normalization error is estimated to be 22 %. is estimated to be %, and is analogous to the systematic error in the ratio . ranges from %. Then, the minimum is sought on the plane.
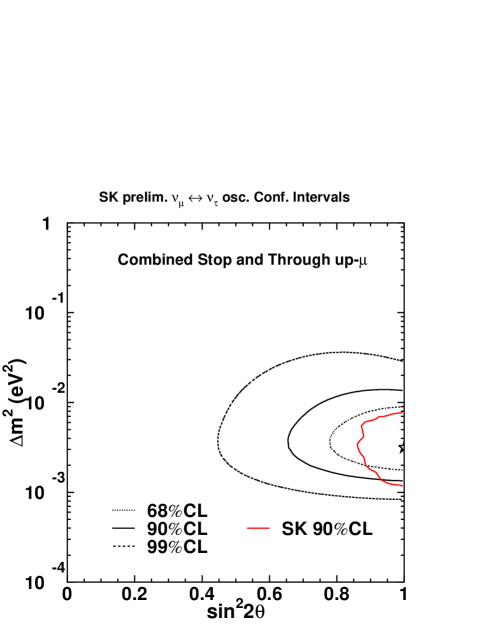
The no-oscillation case results in a , a poor probability () of the null hypothesis. However, the best fit point of maximal mixing and eV2 matches the data well, as can be seen in Fig. 2. Fig. 3a shows the confidence intervals in oscillation parameter space, taking into account that the overall best fit is slightly outside the physical region at eV2. These results are consistent with those obtained in the analysis of Super-K’s contained atmospheric neutrino events[1, 2]. However, they are obtained from an independent sample of much higher energy atmospheric neutrinos.

Including both the upward-going muon terms from Eq. 2 and the contained event terms from [1, 2] and properly accounting for the joint systematic errors, a global oscillation fit using all of the atmospheric neutrinos available to Super-K can then be calculated. This global is of the form :
| (3) |
where are the systematic error terms and their constraints. In this fit, the flux normalization term is in common between the contained and upward-going muon expected fluxes, although it is not constrained, following the contained fit procedure. The spectral index uncertainty ( from[1]) is common and constrained. The rest of the stopping/through-going uncertainty from the term in Eq. 2 is placed in an term (), and a term ( is introduced representing the systematic uncertainties between contained and upward-muon analyses. The no-oscillation case of strongly rules out the null hypothesis. Minimizing the combined narrows the allowed region of parameter space to close to maximal mixing and eV2, as can be seen in Fig. 3b. This best fit point has . All the terms fall within one sigma of the systematic error estimates. The overall best fit point is outside the physical region at eV2, and the confidence intervals have been appropriately corrected.
Making use of the higher energy interactions in the rock surrounding Super-Kamiokande provides an independent and complementary test of the disappearance oscillations proposed to explain the atmospheric neutrino anomaly. These upward-going muons confirm the conclusions reached in [1], and a global fit to all the Super-K atmospheric neutrinos now available provides a more precise measurement of the oscillation parameters involved.
REFERENCES
- [1] Y. Fukuda et al, Phys. Rev. Lett. 81, 1562 (1998).
- [2] M. Messier et al, these proceedings.
- [3] Y. Fukuda et al, Phys. Lett. B433, 9 (1998).
- [4] Y. Fukuda et al, Phys. Lett. B436, 33 (1998).
- [5] Y. Fukuda et al, Phys. Rev. Lett. 82, 2644 (1999).
- [6] M. Ambrosio et al, Astroparticle Physics 9 105 (1998).
- [7] M. Honda et al, Phys. Rev. D52, 4985 (1995), Prog. Theor. Phys. Suppl. 123, 483 (1996).
- [8] C.H. Llewellyn Smith, Phys. Rep. 3, 261 (1972).
- [9] D. Rein and L.M. Seghal, Ann. Phys. 133, 79 (1981).
- [10] M. Glűck, E. Reya and A. Vogt, Z. Phys. C67, 433 (1995).
- [11] W. Lohmann, R. Kopp and R. Voss, CERN Yellow Report No. 85-03.
- [12] V. Agrawal, T.K. Gaisser, P. Lipari, T. Stanev, Phys. Rev. D53, 1314 (1996).
- [13] J. Botts et al, Phys. Lett. B304, 159 (1993); H.L. Lai et al, Phys. Rev. D51, 4763 (1995).
- [14] W. Frati et al, Phys. Rev. D48, 1140 (1993).