Solar Neutrinos with Super-Kamiokande
Abstract
The discrepancy of the measured solar neutrino flux compared to the predictions of the standard solar model may be explained by the neutrino flavor oscillation hypothesis. A more direct and less model-dependent test of this hypothesis is a measurement of the distortion of the shape of the solar neutrino energy spectrum. Super-Kamiokande studies the energy spectrum of recoil electrons from solar neutrino scattering in water above 5.5 MeV.
I Introduction
Super-Kamiokande is a cylindrical Cherenkov detector containing 50,000 tons of purified water within a stainless steel tank. The cylinder has a diameter of 39m and is 41m high. It is optically divided into an inner detector (ID) and an outer detector (OD). The OD is used as an active shield of thickness m. The ID’s diameter is 34m and its height is 36m. From its 32,000 tons of water, the inner 22,500 tons are used as fiducial volume. The fiducial volume begins 2m from the ID surface. 11,146 inward-facing 50cm-diameter photomultiplier tubes (PMTs) cover of the light barrier between ID and OD. 1,885 outward-facing 20cm-diameter PMTs view the OD.
Super-Kamiokande is a Japanese-American experiment located about 300 kilometers northwest of Tokyo in the Japanese Alps close to the village of Mozumi. To shield it from cosmic rays, it was constructed underground in the Kamioka mine. The rock overburden is 1000m (2,700m water equivalent). Next to a search for nucleon decay, Super-Kamiokande was built to study solar and atmospheric neutrinos as well as neutrinos originating from galactic supernovae.
II Super-Kamiokande’s Measurement of Solar Neutrinos
Solar neutrinos are observed in Super-Kamiokande via elastic neutrino-electron scattering in water:
The recoiling electron generates Cherenkov light which is detected by the ID PMTs. The Cherenkov light pattern and intensity allow reconstruction of the recoil electron’s production time, production location (vertex), direction and energy.
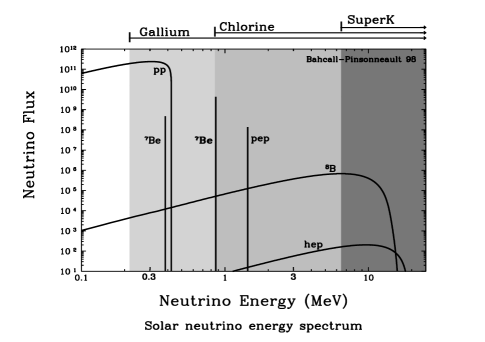
The reconstructed direction agrees within about thirty degrees of the neutrino direction. Therefore the angle between reconstructed direction and the line drawn between the Sun’s current position and the reconstructed vertex can be used to separate solar neutrino interactions from background events (see figure 1). Since the interaction time is reconstructed, day-night and seasonal variation of the solar neutrino flux can be studied. The reconstruction of the recoil electron energy provides a lower bound on the neutrino energy, therefore Super-Kamiokande can look for spectral distortions in the solar neutrino flux. The recoil electron spectrum is sharply falling with increasing energy since higher energy neutrinos can produce lower energy recoil electrons (see figure 2).
Super-Kamiokande is sensitive to energies above 5 MeV, so the solar neutrinos detected by it are produced by the reaction:
This reaction has an endpoint of 15 MeV (see figure 2). Super-Kamiokande obtained (stat.)(syst.) signal events above 6.5 MeV recoil electron energy. From this number the total 8B solar neutrino flux can be calculated to be ((stat.)(syst.))cm2/sec. This is lower than expected from the BP98[1] Standard Solar Model (SSM). The ratio is
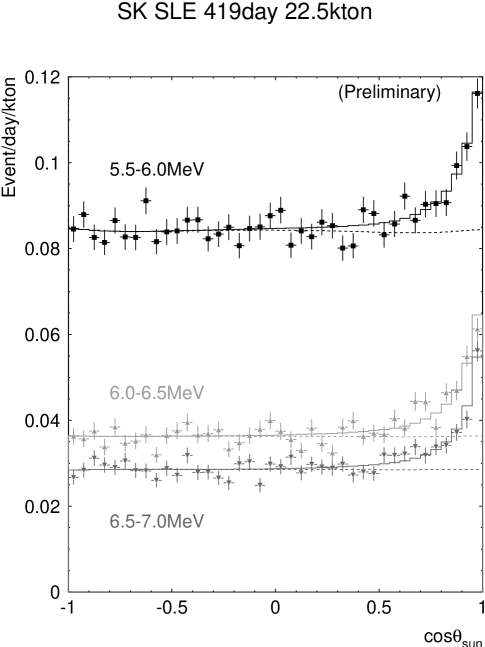

The events close to point back to the sun. This ‘solar peak’ above the background is used to measure the solar 8B neutrino flux and spectrum. The background increases dramatically with decreasing energy. Super-Kamiokande has two analysis: the Super Low Energy (SLE) analysis has a lower threshold but also lower event selection efficiency than the Low Energy (LE) analysis.
III Solar Neutrino Spectrum
The discrepancy between SSM and flux measurement (one aspect of the so-called solar problem) may be explained by neutrino flavor oscillation, where electron-type neutrinos oscillate to other, undetected neutrino types and back. Indeed, if they oscillate to just one other type, and if the oscillation length is short compared to the distance sun—earth, a suppression of about is not unexpected. This neutrino oscillation hypothesis seems more likely now, since atmospheric muon-type neutrinos indeed appear to oscillate to other types[2].
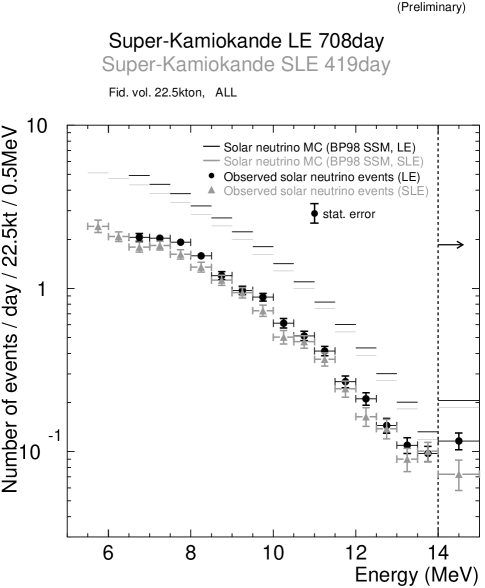
However, a more model-independent way of testing this oscillation hypothesis is to study the energy spectrum, the day–night and the seasonal variation of the solar flux, rather than relying on flux measurements alone. The SSM prediction of the 8B flux can be seen in figure 2. Super-Kamiokande has measured the recoil electron spectrum[3] and the day–night variation[4] above 6.5 MeV using the Low Energy (LE) analysis. Below 6.5 MeV the background of this analysis increases sharply with decreasing energy. A new Super Low Energy (SLE) analysis was designed to reject these backgrounds more efficiently. Currently, the SLE analysis threshold is at 5.5 MeV. The LE analysis has a higher event selection efficiency than the Super Low Energy (SLE) analysis. Therefore both analysis are combined to study the spectrum: above 6.5 MeV the LE analysis is used, and below 6.5 MeV the SLE analysis.
Super-Kamiokande’s new Super Low Energy (SLE) analysis has a lower threshold but a lower event selection efficiency.
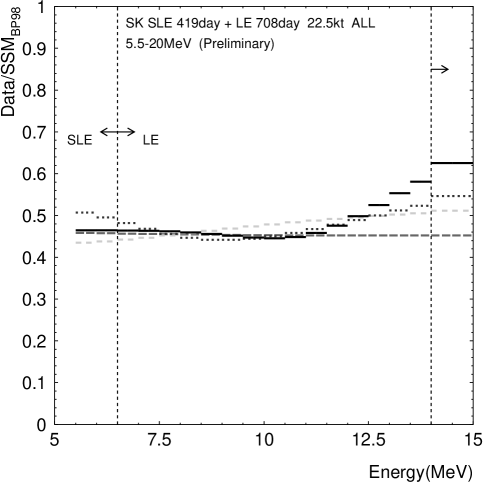
A convenient way to search for spectral distortions is to normalize the observed spectrum by the SSM expectations (see figure 3 a)). A flavor oscillation hypothesis leads to deviations from a flat normalized spectrum. The strongest deviations are expected for “vacuum oscillations” at small (see figure 3 b)). Matter-enhanced (MSW) neutrino oscillations [5] show smaller deviations. In particular, the large-angle solution expects an almost flat normalized spectrum. The small-angle solution leads to a sloped normalized spectrum (low recoil energy bins are more strongly suppressed than high energy bins). The best oscillation fit to Super-Kamiokande’s spectrum is for , eV2 in the vacuum oscillation area.
A Hep Neutrinos
The deviations from a flat normalized spectrum in Super-Kamiokande arise mainly at the high energy end of the spectrum. The rate of solar neutrino emission from the process
(Hep flux) contributes only a tiny amount to Super-Kamiokande’s flux as expected by the SSM (see figure 2). However, the SSM Hep flux normalization is highly uncertain. An increase in the Hep flux of a factor of about twenty times with respect to the SSM will explain the deviations shown in figure 3 a) (see also figure 4). However, the best oscillation fit to the data is still in the vacuum oscillation region.
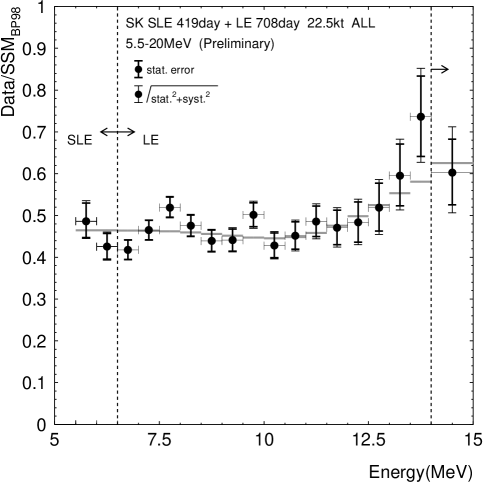
The best fit to the spectrum is vacuum oscillation with , eV2 (grey line in a), solid black line in b)). Small-angle (, eV2) and large-angle (, eV2) MSW oscillation expectations can also be seen in b) (light grey and dark grey dashed line). The dark grey, dotted line is vacuum oscillation expectation with lower (, eV2).

B Super Low Energy Analysis
The normalized recoil electron spectrum at the low end of Super-Kamiokande’s sensitivity does not suffer from the uncertainty of the Hep flux. The MSW small-angle area predicts a suppression of the flux with respect to the flux around 10 MeV, for large-angle MSW oscillation a small increase is expected. Vacuum oscillations of different expect different behavior.
To be sensitive to these low energy deviation, both new hardware and software developments were necessary. Super-Kamiokande’s normal energy threshold of around 5.5 MeV leads to a fairly small and strongly energy-dependent trigger efficiency in the SLE region. To increase the efficiency and decrease the energy dependence, the trigger threshold had to be lowered to around 4.5 MeV. In order to do that, it is necessary to use an “intelligent trigger” to handle the resulting high raw trigger rate. This intelligent trigger, a fast computer for online filtering of very low energy events, was installed in May 1997. It reduces the raw trigger rate of about 100 Hz to about 5 Hz. New filtering software exploits the observation, that background events seem to be concentrated close to the wall of the ID. Currently, the SLE analysis has a threshold of 5.5 MeV and is adding two energy bins to the LE analysis. The 5-5.5 MeV energy bin will soon be added to the analysis. The SLE analysis results above 6.5 MeV agree with the LE analysis.
IV Day–Night Variation
MSW oscillations predict an enhancement of the solar neutrino flux during the night when the neutrinos pass through the earth. Super-Kamiokande measures the neutrino flux above 6.5 MeV as a function of the zenith angle, the angle of the line sun — Super-Kamiokande with respect to the vertical (see figure 5). The small-angle solution expects only an increase in flux when the neutrinos pass through the core of the earth. This effect would only appear in the ‘night 5’ bin in figure 5 b) which corresponds to a zenith angle of about to . The large-angle solution predicts an enhancement throughout the night. The best oscillation fit to Super-Kamiokande’s zenith angle variation is , eV2.

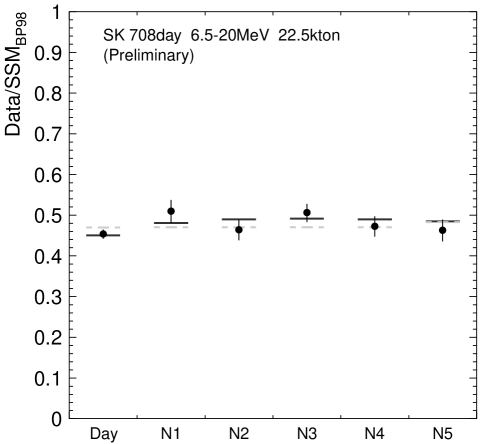
The day-night asymmetry of the flux above 6.5 MeV displayed in a) is (stat.)(syst.) Ten zenith angle bins are defined as shown in a). The best fit to the data is MSW large-angle oscillation with , eV2 (solid dark grey line in b)). The small-angle MSW oscillation expectation (dashed light grey line in b) with , eV2) shows a core enhancement (night 5 bin) which is disfavored by the data.
The measured day–night asymmetry defined as
differs not significantly from zero. However, even the largest expected asymmetry is still consistent with the data. The data disfavors the hypothesis of a ‘core effect’, but slightly favors a negative day–night asymmetry. More data needs to be taken to resolve the predicted matter effects.
V Seasonal Variation
Since the distance sun — earth changes with a yearly cycle, vacuum oscillations can show a seasonal variation of the neutrino flux (see figure 6). Due to the spherical symmetry of the neutrino flux, this flux should be proportional to and show a seasonal variation even without the presence of neutrino oscillation. The flux above 6.5 MeV recoil electron energy cannot show this variation, since the low recoil electron energy events dominate the flux and the variation is washed out for these events (see figure 6 b)). After less than three years of data taking, the statistical accuracy is insufficient to observe this effect. The data slightly favors the presence of seasonal variation above 11.5 MeV in addition to the variation. More data is needed to observe a significant effect.
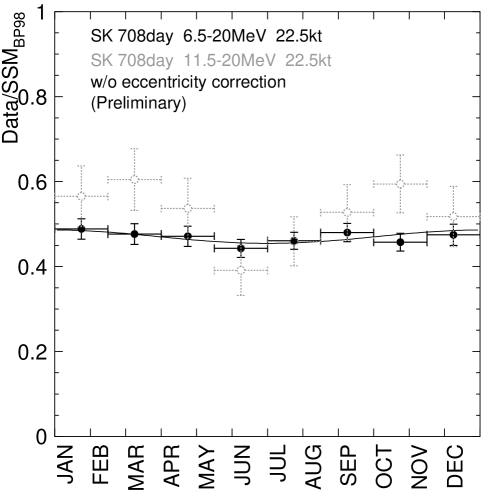

The seasonal variation for the flux above 6.5 MeV (black filled in circles) and 11.5 MeV (grey open circles) shown in a) is not corrected for the variation expected from spherical symmetry (black line). Below 10 MeV the variation in the recoil electron normalized spectrum is washed out.
VI Summary and Conclusion
After less than three years of data taking, Super-Kamiokande starts to constrain neutrino flavor oscillation solutions to the solar neutrino problem. So far, flux normalization independent signatures are not yet significant (day–night and seasonal flux variation) or may be explained within the SSM (increase of the normalized spectrum at the high energy end). More data and a lower SLE analysis threshold is needed to measure spectrum and flux variations more precisely. Due to its high neutrino interaction rate, Super-Kamiokande is uniquely suited to explore day–night and seasonal variation which require a large data sample. Super-Kamiokande is currently still limited by statistics and could in a few more years perhaps find (or rule out) neutrino oscillation as an answer to the solar neutrino problem.
Acknowledgements
We gratefully acknowledge the cooperation of the Kamioka Mining and Smelting Company. This work was partly supported by the Japanese Ministry of Education, Science and Culture and the U.S. Department of Energy.
REFERENCES
- [1] J. Bahcall, S. Basu, and M. Pinsonneault, Phys. Lett. B., 433, 1 (1998).
- [2] Y. Fukuda et al., Phys. Rev. Lett., 81, 1562 (1998)
- [3] Y. Fukuda et al. hep-ex/9812011.
- [4] Y. Fukuda et al. Phys. Rev. Lett., 82, 1810 (1999)
- [5] S.P. Mikheev and A.Y. Smirnov, Nuovo Cim., 9C, 17 (1986).