Recent Heavy-Flavor Measurements from OPAL
Abstract
A selection of recent heavy-flavor results from OPAL using the LEP1 data sample are presented. The average polarization of b baryons in hadronic Z0 decay has been measured to be using semileptonic decays of baryons. A search has been conducted for the radially excited D∗′ and has produced a 95% CL upper limit on its production of . Finally, the measurement of the product branching ratio has been made. This measurement, along with an earlier measurement of the product branching ratio , has been used to compute an updated , consistent with the expected low semileptonic branching fraction of the inferred from its short lifetime compared to the other b hadrons.
I Measurement of the Average Polarization of b Baryons in Z0 Decays
In the Standard Model, b quarks produced in e+e- collisions with have an average longitudinal polarization of ; the sign indicates that the b quarks are predominantly left-handed. The variation of this polarization with the angle of emission of the b quark ***In the right-handed OPAL coordinate system, the positive axis points along the e- beam and the axis points towards the center for the LEP ring. The polar and azimuthal angles are denoted by and , and the origin is taken to be the center of the detector. is only 2%, and the dependence on is fairly weak: . This average polarization of b quarks is the quantity measured by SLD [1], and is an ingredient to the measurements from LEP [2].
In the heavy-quark limit, the spin of the b quark is expected to decouple from the light degrees of freedom produced by the fragmentation processes. The process of stable hadron formation has a profound effect on the polarization retained in the final state. The pseudoscalar mesons B0 and B± carry no polarization information. The vector meson B∗ decays by photon radiation which couples mainly to the light degrees of freedom within the meson, and hence the radiated photons are very nearly isotropic [3]. When directly produced, the is expected to retain nearly the full polarization of the parent b quark [4], where the light valence quarks form a spin-zero system. Some mesons are produced from strong decays of the and the . The energy difference between these states is the hyperfine splitting induced by the relative orientation of the b quark spin and the spin-1 diquark. These states are produced in a coherent superposition in the hadronization process. If the and the have narrower widths than their mass splittings, then they decay incoherently; their lifetime is long enough to flip the spin of the b quark. If the states are broader than the splitting, then the b polarization retention is higher. The widths of these states are predicted to be of the order of the mass splitting between them, hence substantial depolarization is expected for these cascade decays [3, 5]. A measurement of the average polarization of baryons tests both Heavy Quark Effective Theory (HQET) and also models of baryon formation.
The polarization of baryons is most easily measured using their semileptonic decays †††Charge conjugate processes are implied in this analysis and throughout this article.. To conserve angular momentum in the maximally parity-violating decay, the charged leptons are preferentially emitted antiparallel to the spin of the , while the ’s are preferentially emitted parallel to the spin. When boosted into the laboratory frame, the charged lepton energy is on average higher than the neutrino energy. The spectra depend on the momentum spectrum and the details of the semileptonic decay, which are influenced by , QCD corrections, and form factors. The ratio of the average charged lepton energy to the average neutrino energy partially cancels these effects and is statistically more powerful than either energy alone [6]. This analysis is based on the event-by-event distribution of the ratio . The ingredients needed for the analysis are a purified sample of semileptonic decays, an estimation of the background contribution, and measurements of the lepton and neutrino energies.
The OPAL measurement is described in detail in Reference [7] and is summarized here. The selection uses correlations between reconstructed decays and high- leptons similar to the selection of [8], but with improved electron identification, different lepton kinematic cuts, and the inclusion of the requirement of a , whose charge is required to be correlated with the reconstructed to take advantage of the decay chain . The is additionally required to be consistent with coming from the common -lepton vertex.
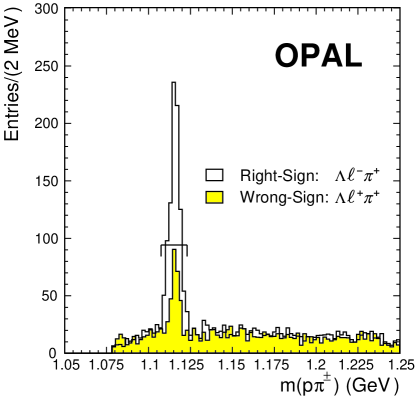
The invariant mass distribution of the selected p combinations is shown in Figure 1, separately for the (right-sign) and (wrong-sign) combinations. From a total of 4.3 million hadronic Z0 decays used in all three analyses presented in this article, a total of 912 right-sign combinations are selected with an overall b baryon purity of 69%. A total of 316 wrong-sign combinations are also selected. The wrong-sign combinations were used to estimate the level of background as well as the shape of the background distribution of . Part of the wrong-sign background consists of real leptons from decay combined with fragmentation ’s, which are preferentially produced with the wrong sign because of conservation of baryon number; these events contain the same polarization information as right-sign events.
To estimate the neutrino energy, the missing energy in the signal hemisphere is computed as the difference between the expected total energy in the signal hemisphere and the measured energy in the same hemisphere:
| (1) |
where is the beam energy, is the measured visible energy in the signal hemisphere, is the invariant mass of the observed particles in the signal hemisphere and is the invariant mass of the opposite hemisphere. The estimated resolution of the neutrino energy is 3.5 GeV. The measurement error on the charged lepton momentum is negligible by comparison, although the momentum scale and spectrum modeling introduce a systematic uncertainty. The distribution of the measured is compared between data and Monte Carlo for events with a high- lepton and also for those without, providing samples enriched in high-energy neutrinos and depleted in them. Differences in the spectra are used to estimate corrections and systematic errors.
The binned fit to the measured distribution was performed by comparing it to fully simulated Monte Carlo samples generated with various values of the average polarization . The right-sign and wrong-sign spectra were fit simultaneously. These distributions and the fit are shown in Figure 2. The per degree of freedom is 0.91 and the fit value is , where the errors are statistical.
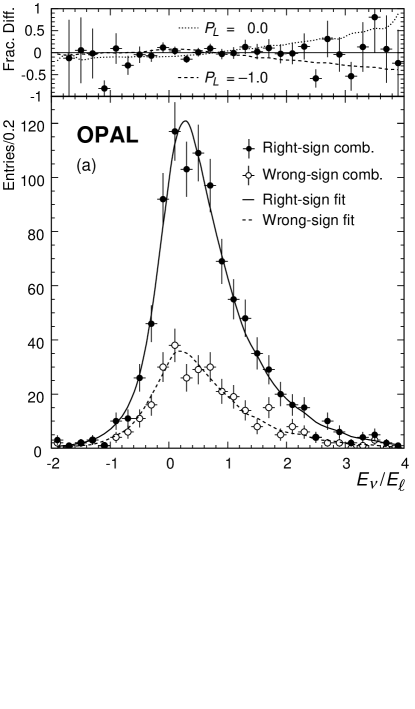
Table I summarizes the sources of systematic uncertainty considered. Added together in quadrature, the total systematic error is estimated to be . The average longitudinal polarization of b baryons is measured to be
| (2) |
Including the effects of both statistical and systematic uncertainties, the 95% confidence level (CL) acceptance region is , excluding for the first time zero polarization at the 95% CL, and also disfavoring full preservation of the original polarization of through the fragmentation and hadronization processes.
| Source of Uncertainty | Source of Uncertainty | ||
|---|---|---|---|
| resolution | polarization | ||
| reconstruction | b | ||
| scale and shape | Fitting method | ||
| Selection criteria | Theoretical uncertainty (form factor | ||
| Background fraction and shape | modeling, QCD corrections, | ||
| b fragmentation | |||
| Total: | |||
II Search for the Radially Excited D∗′±(2629)
In February 1998, the DELPHI collaboration reported evidence [9] for a radially excited charm meson, labeled the D∗′. The lowest-energy radially excited state is called the D′, but the D∗′± is easier to select because it is expected to decay to D with a significant branching ratio. DELPHI’s measured signal rate is expressed in terms of the rates of production of D and D mesons in Z0 decay:
| (3) |
The 95% CL upper limit on the width of the observed resonance is 15 MeV and is limited by the detector resolution. The observed mass is 26376 MeV.
The expected mass of the D∗′ is 262920 MeV [10], consistent with the DELPHI observation. An estimate of the decay width using a harmonic oscillator approximation [11] is MeV, although a more recent computation by Melikhov and Péne [12] of the same partial width using heavy-quark symmetry is between 120 and 160 MeV. Melikhov and Péne also estimate the width to be between 45 and 450 MeV, indicating some trouble in interpreting the observation. In addition, CLEO has searched for the D∗′+ in an analysis sensitive only to e+eD∗′+ [13] and has placed a limit of at 90% CL.
OPAL has searched for the D∗′+ and the selection procedure is summarized here. Charged D∗+ candidates are selected in the decay mode DDDK. The K combination is required to have its invariant mass within of the expected D0 mass; the resolution is 25 MeV in both data and Monte Carlo. The D∗+ is formed with a pion of opposite sign to the kaon and the scaled energy of the D∗+, is required to exceed 0.2. The mass difference must be between 142 and 149 MeV, corresponding to in the resolution. Additional background rejection is obtained by placing requirements on the helicity angle and the angle between the kaon and the D0 flight direction in the D0 rest frame. OPAL’s excellent d/d capability [14] is additionally used to purify the kaon sample. The D∗′+ candidates are formed by combining the D∗+ candidates with pairs of oppositely charged tracks, in order to explore DELPHI’s observation in the D decay mode. These pions have loose d/d requirements placed on them. The reconstructed mass of the D∗′+ is corrected by using the PDG value for the D∗+ mass and the measured difference between the D∗′+ and the D∗+ candidates.
The analysis proceeds separately for events tagged as bottom and charm, in order to suppress background from Z, and events. To select candidates from a sample enriched in Z events, the D∗+ candidate is required to have , and the magnitude of the vector sum of the momenta of the two pions added to form the D∗′+ candidate is required to be greater than 3.6 GeV. To select candidates in Z events, the separation of the D0 vertex from the primary divided by its error is required to be larger than 4.0. A loose requirement is made on the separation between the D0 vertex and the D∗′+ pion vertex to reduce the combinatoric contamination. Using a Monte Carlo simulation, the efficiency for selecting D∗′+ mesons in Z events is estimated to be (7.10.6)%, while for Z it is estimated to be (6.90.6)%. The combined signal expectation in OPAL is a factor of 1.10.1 times that of DELPHI, although the mass resolution in OPAL is 15 MeV and the background level is about 50% higher, when the b and c analyses are combined.
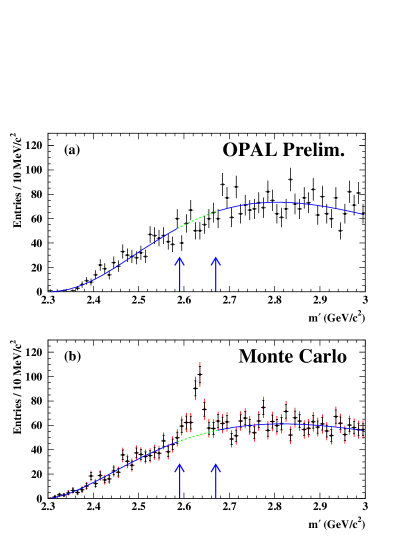
The combined result of the bottom and charm analyses is shown in Figure 3, where events that pass either of the two analyses enter the histogram once. The Monte Carlo expectation for a signal the size of DELPHI’s observation is also shown. Limits have been obtained on the D∗′+ production rate by defining a mass window between 2.59 and 2.67 GeV (), and comparing the observed candidate count against a background from a smooth parameterization shown also in Figure 3. Systematic uncertainties, summarized in Table II, are incorporated in the limits. The 95% CL upper limit on the number of D∗′+ candidates in the combined analysis in the mass window is 32.8, with 443 events observed and 475 expected from the background fit. This can be converted into a limit on the production fraction:
| (4) |
No signal is seen separately in the tagged b or c samples, and the upper limits are
| (5) |
and
| (6) |
The analysis has been checked by reconstructing the orbitally excited D and D, following a very similar selection procedure, except only one pion is added to the D∗+ candidate. The rates and widths of these are consistent with Monte Carlo expectations. Combining the limits above with the measurements of these rates, which share common systematic uncertainties, OPAL sets a limit of at the 95% CL, where is defined in Equation 3.
| error source | relative contribution | ||
|---|---|---|---|
| c sample | b sample | combined sample | |
| relative errors on Monte Carlo efficiency | |||
| Monte Carlo statistics | |||
| detector resolution | |||
| kaon dd | |||
| pion dd | |||
| D∗′+ width | |||
| fragmentation modeling | |||
| production rates in b/c | none | none | |
| total efficiency error | |||
| relative errors on external branching ratios | |||
| branching ratio DD, DK | |||
| error on | none | ||
| total branching ratio error | |||
III Measurement of
The measurement of has been carried out mainly because of its interest in interpreting measurements of to extract the quantity , which is an approximate measure of semileptonic branching fraction of the . The average lifetime of the has been measured to be approximately 80% that of the B mesons, while theoretical predictions can accommodate ratios between 90% and 100% [15]. It is therefore important to check the shortened lifetime with a measurement of the semileptonic branching ratio, which is expected to be proportional to the lifetime within the B hadron family, provided that the leptonic decay currents are the same for the b baryons and the B mesons. A second reason for measuring this product branching ratio is that it allows one to extract .
This analysis is fully described in Reference [16] and a summary is provided here. The procedure is to identify p decays in b-tagged events, and then to use the momentum, , and transverse momentum, of each with respect to its jet, to separate the contributions from b baryon decay, B meson decay, and ’s produced by the fragmentation process.
Events are tagged as Z if at least one jet tags as a b using displaced secondary vertices as described in [17]. The estimated overall efficiency is about 21% per jet and the purity is about 96% per event. The selection requires that the reconstructed mass of the p combination be within 8 MeV of , that it be farther than 6 MeV from the K0 mass when interpreted as a pair, that the flight distance be at least 8.0 cm from the interaction point when projected into the plane, that the momentum points back at the interaction point, that it have a momentum exceeding 5 GeV, and that it be within 0.2 radians of its jet axis. In addition, OPAL’s d/d capability is used to require that the proton’s candidate track’s ionization is consistent with that expected from a proton.
The Monte Carlo is used to provide distributions of and ‡‡‡The of the is measured with respect to the nearest jet axis, the calculation of which includes the momentum. for ’s from each of the three sources, b baryon decay, B meson decay, and fragmentation. Other backgrounds contribute 3% of the sample, dominated by D+ mesons tagging as B mesons because of their long lifetime. Because the D+ does not have enough mass to decay into a and another baryon, the main contribution comes from fragmentation ’s in events with tagged D+ mesons. These are incorporated into the fragmentation lambda portion of the fit. These distributions of and are jointly fit for the fractions of ’s in each of the three categories, and the results are shown in Figure 4 and summarized in Table III. The momentum is a powerful discriminator between b baryon decay and fragmentation, while the transverse momentum is effective for separating b baryon decays from B meson decays, although this separation is more difficult, which is reflected in the correlations shown in Table III. A summary of the systematic errors on the fit fractions is given in Table IV. Checks of systematic biases in the and spectra were made by comparing events with -lepton pairs and comparing the averages of and in the right- and wrong-sign samples to obtain estimations for a pure sample of semileptonic decays.

| Source | Fit fraction (%) | Correlations | ||
|---|---|---|---|---|
| frag | B | |||
| 37.4 5.3 | 1.0 | –0.15 | –0.64 | |
| frag | 37.1 5.1 | –0.15 | 1.0 | –0.61 |
| B | 25.5 6.6 | –0.64 | –0.61 | 1.0 |
| Sources of Systematic Errors for | negative | positive |
|---|---|---|
| errors | errors | |
| ) and from B | % | 3.5% |
| of Fragmentation ’s | % | 0.8% |
| of Fragmentation | % | 12.7% |
| from | % | 4.8% |
| from | % | 19.8% |
| Tracking Uncertainty | % | 2.7% |
| Total | % | 24.4% |
The other important ingredient in the analysis is to understand the efficiency of the b-tag for jets containing a . This can be accomplished by counting events with one and two b-tagged jets while assuming the value of and the efficiency to tag non-b events and solving for , the b-tagging efficiency, using
| (7) |
| (8) |
Large biases enter, however, from the facts that 1) the has a shorter lifetime than the B mesons and therefore tags less often, 2) the decay products are not included in the secondary vertex, leaving a lower average multiplicity and momentum of charged tracks which do participate in the secondary vertex, and 3) that if a high-momentum fragmentation is present, the b hadron will have less momentum than average. These biases are accounted for by counting the number of selected ’s in hemispheres with b-tags and hemispheres opposite b-tags. The tag efficiency corrections for each class of are modeled in Monte Carlo, and the overall efficiency correction is scaled to match that of the data, obtained from the -tag statistics. The scaled correction for the component is then used as the correction, which amounts a factor of , for an estimated event b-tag efficiency of .
The product branching ratio is then formed as follows:
| (9) |
where is the number of candidates in the final sample, is the number of hadronic Z0 decays in the final sample, is the b-tagging efficiency for events with ’s in them. Table V gives a summary of the uncertainties on the measurement of the product branching ratio. Combining these factors with the appropriate systematic errors added in quadrature yields
| (10) |
Combining this measurement with a previous measurement of the product branching ratio using a companion baryon technique [18] yields a more precise estimation, as the overlap in the selected event sample is less than 20%. The combined measurement is
| (11) |
in agreement with a measurement from DELPHI [19] of . Using the measured value of in hadronic Z0 decays of [20], one obtains
| (12) |
| Uncertainty on | ||
| 2323302 | — | |
IV Summary
OPAL has produced a wide spectrum of heavy-flavor physics results in the past year. In addition to the measurements described here of the b baryon longitudinal polarization, the search for the radial excitation D∗′+, and the measurement of the product branching ratio , OPAL has completed its final measurement [21], studied CP violation in the -K channel [22], measured the and B0 lifetimes using a topological tag [23], and measured the semileptonic branching fraction of inclusive b hadrons [24]. Each analysis uses OPAL’s full LEP1 data sample and are among the most precise published measurements of their respective quantities.
REFERENCES
- [1] J. Fernandez (SLD Collaboration), talk presented at DPF99, UCLA, January 6–9, 1999, these proceedings.
- [2] AFB reference
- [3] A. F. Falk and M. E. Peskin, Phys. Rev. D49, 3320 (1994).
- [4] T. Mannel and G. Schuler, Phys. Lett. B279, 194 (1992).
- [5] J. G. Körner, Nucl. Phys. Proc. Suppl. B50, 140 (1996).
- [6] G. Bonvicini and L. Randall, Phys. Rev. Lett. 73, 392 (1994); C. Diaconu, M. Talby, J. G. Körner, and D. Pirjol, Phys. Rev. D53, 6186 (1996).
- [7] OPAL Collaboration, G. Abbiendi et al., Phys. Lett. B444, 539 (1998).
- [8] OPAL Collaboration, R. Akers et al., Z. Phys. C69, 195 (1996).
- [9] DELPHI Collaboration, P. Abreu et al., Phys. Lett. B426, 231 (1998).
- [10] D. Ebert, V. O. Galkin, and R. N. Faustov, Phys. Rev. D57, 5663 (1998). Erratum – ibid, D59 019902 (1999).
- [11] R. Kokoski, N. Isgur, Phys. Rev. D35, 907 (1987); as quoted in [9].
- [12] D. Melikhov and O. Péne, LPTHE-ORSAY-98/53, hep-ph/9809308 (1998).
- [13] Ian Shipsey (CLEO Collab.), talk ID # 902 given at ICHEP98, Vancouver, 23–29 July, 1998.
- [14] M. Hauschild et al., Nucl. Instr. and Meth. A314, 74 (1992).
- [15] D. Abbaneo, talk given in session 3a of DPF99, UCLA, 6–9 January, 1999.
- [16] OPAL Collaboration, G. Abbiendi et al., CERN-EP-98-196 (1998), submitted to Euro. Phys. J. C.
- [17] OPAL Collaboration, R. Akers et al., Z. Phys. C66, 19 (1995); as quoted in [16].
- [18] OPAL Collaboration, K. Ackerstaff et al., Z. Phys. C74, 423 (1997).
- [19] DELPHI Collaboration, P. Abreu et al., Phys. Lett. B347, 447 (1995).
- [20] Particle Data Group, C. Caso et al., Euro. Phys. J. C3, 1 (1998).
- [21] OPAL Collaboration, G. Abbiendi et al., CERN-EP/98-137 (1998); accepted by Euro. Phys. J. C.
- [22] OPAL Collaboration, K. Ackerstaff et al., Euro. Phys. J. C5, 379 (1998).
- [23] OPAL Collaboration, G. Abbiendi et al., CERN-EP/98-195 (1998); submitted to Euro. Phys. J. C. See also the talk given by R. Coxe, DPF99, Los Angeles, 5–9 January, 1999.
- [24] P. Gagnon, OPAL Collaboration, talk ID # 808 given at ICHEP98, Vancouver, 23–29 July, 1998.