Branching Ratio and Form Factor Measurements of Beta Decay
Abstract
We present a branching ratio measurement for the beta decay of neutral Cascade hyperon, , using the KTeV detector at Fermilab. We used the principal decay mode of where , as the flux normalization mode. The status of the measurement of the ratio of the axial-vector to vector coupling (/) for the Cascade beta decay will also be discussed. Furthermore, we present the preliminary branching ratio measurement for the muonic channel .
I Introduction
We report a measurement of beta decay, , branching ratio (BR) based on data collected during E799-II data-taking in Summer of 1997. The first observation and BR measurement of this decay mode was reported by the KTeV collaboration earlier [1]. Under and quark interchange, this process is the direct analogue of the neutron beta decay, . Thus, in the flavor symmetric quark model, differences between these two decays arise only from the differing particle masses and from the relevant Cabibbo-Kobayashi- Maskawa (CKM) [2] matrix elements ( rather than ). In the symmetry limit, the predicted branching ratio is . Flavor symmetry violation effects [3],[4] are expected to modify this branching ratio by as much as 20-30%. The directly-measurable final state polarization will allow measurements of form factors, providing additional information on flavor symmetry.
II Neutral Hyperon Program at KTeV
The KTeV experiment [5] was mainly designed to study the Kaon system. The detector was far (about 94 m) from the production target to ensure mostly in the neutral beam would reach the detector. However, a copious amount of neutrons, and some very high momentum hyperons entered the detector along with ’s. The and the were the only two hyperons with lifetimes long enough to be observable at the decay volume of the experiment.
A wide range of topics in hyperon physics is being studied at KTeV. This includes but is not limited to:
-
Semileptonic (Beta) Decays of , and .
-
Two Body Radiative Decays of : and .
-
Three Body Radiative Decays of and : and .
-
Rare Decays of (produced from decays): .
-
Polarization measurements of and .
-
Precision mass measurements of and .
We made the first observation of some of the above decays, and increased the world statistics of the previously observed ones by one to two orders of magnitudes. This discussion will focus on the beta decays of particle.
III The beam and detector
An 800 GeV/c proton beam, with up to protons per 19 s Tevatron spill every minute, was targeted at a vertical angle of 4.8 mrad on a 1.1 interaction length (30 cm) BeO target. A set of sweeping magnets was used to remove the charged particles and a set of collimators defined two nearly parallel neutral beams that entered the KTeV apparatus (Fig. 1) 94 m downstream from the target. The 65 m vacuum ( Torr) decay region extended to the first drift chamber.
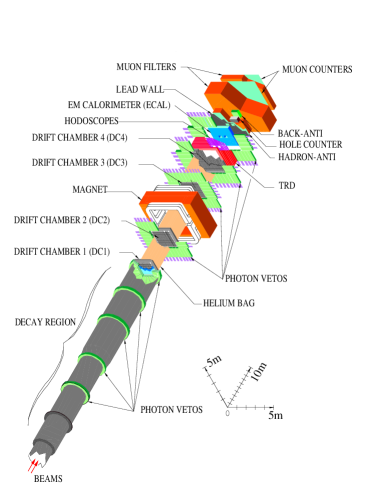
The charged particle spectrometer consisted of a dipole magnet surrounded by four drift chambers (DC1–4) with 100 m position resolution in both horizontal and vertical views. To reduce multiple scattering, helium filled bags occupied the spaces between the drift chambers. In E799-II, the magnetic field imparted a MeV/c horizontal momentum component to charged particles, yielding a momentum resolution of (GeV/c).
The ( m2) electromagnetic calorimeter (ECAL) consisted of 3100 pure CsI crystals. Each crystal was 50 cm long (27 radiation lengths, 1.4 interaction lengths). Crystals in the central region ( m2) had a cross-sectional area of cm2; those in the outer region, cm2. After calibration, the ECAL energy resolution was better than 1% for the electron momentum between 2 and 60 GeV. The position resolution was 1 mm. We also used the ECAL as the main particle identification detector. It had a rejection of better than 500:1.
Nine photon veto assemblies detected particles leaving the fiducial volume. Two scintillator hodoscopes in front of the ECAL were used to trigger on charged particles. Another scintillator plane (hadron-anti), located behind both the ECAL and a 10 cm lead wall, acted as a hadron shower veto. The hodoscopes and the ECAL detectors had two holes ( cm2 at the ECAL) and the hadron-anti had a single cm2 hole to let the neutral beams pass through without interaction. Charged particles passing through these holes were detected by cm2 scintillators (hole counters) located along each beam line in the hole region just downstream of the hadron-anti.
IV Decay
The topology of the decay, followed by (shown in Fig. 2), is similar to the dominant decay sequence, followed by , which was used for normalization.

Both sequences had a high momentum (100 GeV/c) positive track (proton) which remained in or near the neutral beam region, a second lower momentum negative track ( or ), and two neutral (i.e. not associated with any track) ECAL energy clusters (photons from a ). The beta decay was distinguished by the presence of a decay electron and by its different vertex structure. We used a dedicated beta-trigger to collect events which was a subset of a more general hyperon-trigger with some tighter requirements at the trigger level to optimize the number of signal events and reduce the more frequent events.
To reconstruct a event, we looked at events with two tracks and three in-time electromagnetic clusters one of which was associated with the negative track. The secondary decay vertex was located at the point along the stiff proton track where the two highest energy neutral ECAL clusters matched the mass. The primary vertex was then defined at the point of closest approach of the extrapolated path and the negative track. We identified ’s as negative tracks which deposited more than 93% of their energy in the ECAL. Since the decay product contains a missing neutrino, the reconstructed mass of would be broad and below the known mass of . Luckily, was the only event which produced particles. Therefore, reconstructing this intermediate particle would be an indirect but confident indication of the signal.
In fact, the absence of a competing two-body decay containing a ( is not energetically allowed) eliminated a major potential background to our signal. The possible backgrounds were: (a) , , decays with two accidental photons; (b) with one accidental photon; (c) , ; and (d) with either or as subsequent decays. Besides trigger requirements and reconstruction techniques, we applied some quality cuts which strongly suppressed these backgrounds. Detailed Monte Carlo (MC) studies of the signal and the background events suggested various cuts based on the topology of the decays, momenta of the decay products, reconstructed mass and momenta of the parent particles etc. The primary residual background were , and followed by .
A The BR Measurement
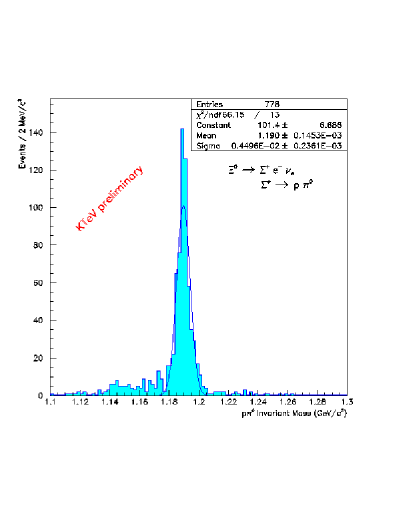
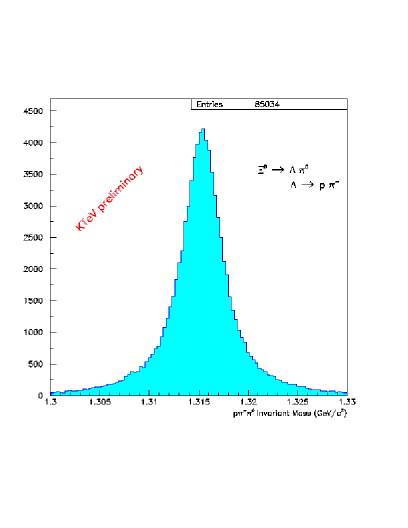
Figs. 4 and 4 show the reconstructed mass of for the signal mode and for the normalization mode respectively, after passing all the trigger requirements and analysis cuts. The background level in the signal plot is less than 10% and well understood. We collected the signal events from the beta-trigger which was not prescaled, and the normalization events form the nominal hyperon-trigger which had a prescale of 50.
The branching ratio of decay normalized to decay can be calculated from the following relation:
Where and are the number of and selected events, =1.54 is the acceptance correction from the Monte Carlo (MC) simulations of the events, and Ps(beta-trigger) and Ps(hyperon-trigger) are the prescales of the two triggers.
In Fig. 4, there are events between 1.175 GeV and 1.205 GeV (within 15 MeV or equivalently of the known mass of , 1.1894 GeV) on the top of background events. We used a sideband background subtraction method to estimate the level of background.
Using the values for and from [6] we determined the BR:
The systematic error has contributions from the trigger inefficiency, background subtraction and uncertainty in the value of different cuts due to detector calibration, and uncertainty in the MC estimation of acceptance. We are planning to reduce the systematics in the future. We are also trying to extract a BR for beta decay based on about 70 candidates [7].
B Form Factor Measurements
For , the transition amplitude in the V-A theory can be written:
| (1) |
where is the universal weak coupling constant, and is the CKM matrix element for strangeness changing S=1 decays. and are the Dirac spinors of the initial and final baryons. The vector and axial vector currents can be written as
| (2) | |||||
| (3) |
There are 3 vector from factors (vector), (weak magnetism) and (induced scalar); plus 3 axial-vector from factors (axial-vector), (weak electricity) and (induced pseudo-scalar) which are functions of the baryons’ momentum transfer squared, . Time invariance implies that all of them are real. and are suppressed by the mass of the lepton and can be ignored in the case of decays to an electron.
The Cabibbo [2] theory relates the form factors of different Hyperon Semileptonic Decays (HSD) to one another by the SU(3) flavor symmetry assumption. In this limit vanishes (no second-class current) and the remaining form factors for e-mode processes at are written in terms of only two reduced form factors F and D which are the free parameters in this model. For Cascade beta decay and , similar to the well studied neutron beta decay. Thus, in the flavor symmetric quark model, differences between these two decays arise only from the differing particle masses and their CKM matrix elements.
We are measuring the ratio at KTeV by looking at the electron-proton asymmetry in the rest frame of . With an order of 1000 events, can be measured to about 0.2. This ratio for the neutron beta decay. This analysis is in progress and the results will be announced soon.
The total decay rate is also a function of and , which can be calculated from the BR of the decay and the measured lifetime of . Hence, these two measurements at KTeV can provide a good test of the SU(3) symmetry assumption and either verify or rule out several theoretical models which predict the values of these form factors based on SU(3) symmetry breaking assumptions.
V BR measurement of Decay
This decay is the muonic channel of beta decay. For this decay the contributions from the f3 and g3 form factors may no longer be considered negligible [8]. Because of a smaller available phase space, the decay rate of this mode is about two orders of magnitude smaller than that of decay and therefore more challenging to observe.
For , We performed a similar analysis as in . Similar or very close selection criteria were applied, except the requirement of identifying a muon instead of an electron. Various analysis cuts were adjusted to account for the greater mass of muons compared to electrons.
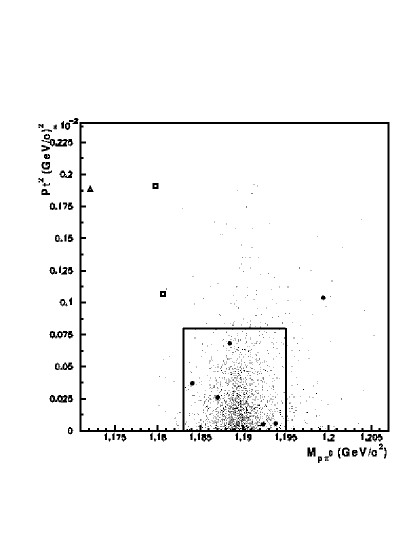
To select muons, hits in the muon counters were required in combination with almost no energy deposited by the muon in the calorimeter and no hadronic showering in the back of the calorimeter. In addition to usual kinematic criteria, the reconstructed mass was required to be greater than to remove with background. The remaining effects of this background have been studied with wrong sign events since anti-hyperons were suppressed by a factor of 10-12 at production. Mass cuts were also used to remove most of the background of events with when the either decays in flight or fakes a muon. Finally in all the data taken, five events remain with an estimated background of 0 events in the 90% confidence level box as can be seen in Fig. 5. The single event outside of the box is also consistent with expectations for the background. The first observation of this decay mode based on these events was presented earlier [7]. For the BR calculations we used decay [1] as the flux normalization mode. Based on the five observed events, the BR is measured:
in good agreement with the SU(3) symmetry prediction of 2.20 10-6. The main source of systematic error comes from the uncertainty of the BR of the normalizing mode, and uncertainty in the background estimation.
VI Conclusion
We presented the latest results on the measurement of the BR for the two beta decays of from the KTeV data. They are both in agreement with the Cabibbo model based on SU(3) flavor symmetry assumption for HSD, within the errors. The first form factor measurement of will be finalized soon. KTeV is approved to run in 1999 and we expect to triple our statistics during the upcoming data-taking period.
REFERENCES
- [1] A. Affolder et al., preprint FERMILAB-Pub-98/403-E (to be published in Phys. Rev. Lett.)
- [2] N. Cabibbo, Phys. Rev. Lett. 10, 531 (1963) and M. Kobayashi and T. Maskawa Prog. Theor. Phys. 49, 652 (1973).
- [3] See, for example, R. Flores-Mendieta, E. Jenkins, and A. V. Manohar, Phys. Rev. D 58, 094028 (1998); M. Roos, Phys. Lett. B 246, 179 (1990); P.G. Ratcliffe, Phys. Lett. B 365, 383 (1996)
- [4] A. Garcia and P. Kielanowski, The Beta Decay of Hyperons (Lecture Notes in Physics, 222, Springer–Verlag, 1985).
- [5] K. Arisaka et al., KTeV (Kaons at the Tevatron) Design Report, Fermilab Report No. FN-580, 1992.
- [6] Particle Data Group, C. Caso et al., Eur. Phys. J. C 3, 1 (1998).
- [7] E. Monniere Conference Proceedings of the 3rd Int Conf on Hyperons,Charm,and Beauty, Genoa, Italy 1998 (to be published in Nuclear Physics B)
- [8] V. Linke, Nucl. Phys. B 12 (1969) 669.