Measurement of the Neutrino-induced Semi-contained Events in MACRO
Abstract
A preliminary analysis is presented of low-energy () neutrino interactions observed by the MACRO detector. These include neutrino interactions in the detector, as well as upgoing neutrino-induced muons that stop in the detector. At these energies, essentially all observed interactions can be attributed to atmospheric neutrinos. A large deficit is observed compared to a no-oscillations Monte Carlo prediction, although the systematic errors are large. However, the observation agrees well with neutrino oscillations with parameters suggested by the MACRO upward throughgoing muon analysis as well as other experiments (maximal mixing with of a few times ).
I Introduction
Recent measurements of atmospheric neutrino flux [1], [2] as well as some older measurements [3], [4] give absolute values and ratios of various quantities that are inconsistent with expectations for massless (non-oscillating) neutrinos, although some older measurements [5], [6], [7], [8] reported no evidence for oscillations. The ongoing MACRO measurement [9] of neutrino-induced upgoing muons that traverse the entire detector (so-called “throughgoing muons”) also suggests oscillations with parameters ( a few times and ) roughly consistent with [1] and [2]. The MACRO analysis has been extended to event topologies that probe lower neutrino energies, and the preliminary results are presented here.
The MACRO detector [10] located at a depth of 3700 mwe at the Gran Sasso laboratory in Italy is a large (77 m 12 m 9.3 m) detector of penetrating radiation. Although it was designed primarily to search for exotic slow-moving supermassive particles such as GUT monopoles, it is also capable of measuring neutrino-induced muon fluxes. The bottom half of the detector is filled with crushed rock absorber and planes of limited streamer tubes (with wire and strip views) with a pitch of 3 cm. Each outer face of the detector and a central layer are filled with boxes of liquid scintillator that provide sub-nanosecond timing resolution. The outer faces also contain additional streamer tube layers. The interior of the upper portion of the detector is hollow. (See Figure 1.)
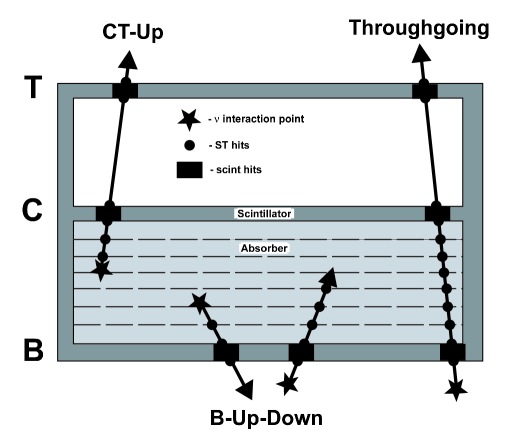
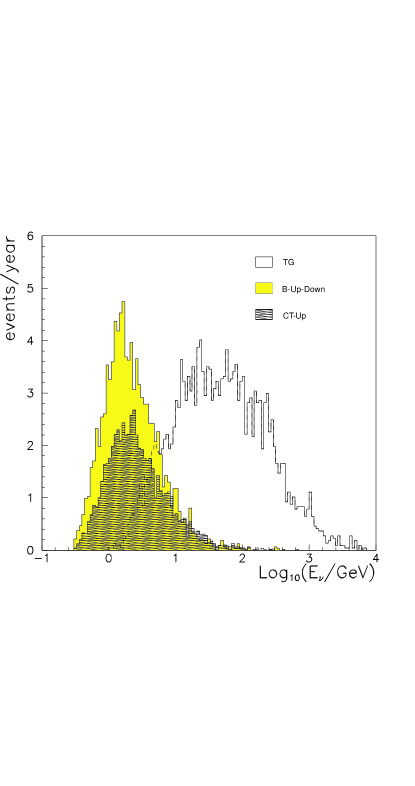
Almost all neutrino interactions in the detector take place in the lower half, where most of the mass is. Because of its large granularity, MACRO has very poor efficiency to detect neutral current events or neutrino-induced electrons. It is primarily sensitive to muons (from charged current interactions) which travel a few meters or more. There are three event topologies of neutrino-induced muons analyzed in MACRO (again, refer to Figure 1). Throughgoing muons, labeled TG, are from neutrino interactions below the detector which send a muon through the entire detector. The TG analysis is described elsewhere [9]. Upward contained-vertex events, labeled CT-Up, in which the muon strikes the Center (“C”) layer of scintillator as well as a higher layer (“T” for Top) constitute the first topology in the present analysis. Of course, there are also neutrino-induced downgoing muons, both throughgoing and stopping in the detector. However, they are indistinguishable from primary atmospheric muons from cosmic ray showers, which even at MACRO’s depth outnumber neutrino-induced muons by 100,000 to 1. Therefore for these topologies only upward muons are considered, as determined by the time of flight between two or three scintillator layers. The final topology, labeled B-Up-Down, consists of two classes of events: downward muons from contained-vertex events and upward muons from external events which stop in the detector. Because only one layer of scintillator is hit (“B” for Bottom) and because the streamer tubes do not provide accurate timing information, it cannot be determined if the particles are moving up or down, so the B-Up-Down analysis sums over both classes of events (upward and downward). Figure 2 shows the distribution of parent neutrino energies contributing to the different topologies, from a no-oscillations Monte Carlo calculation (described below). The current analyses utilize neutrinos more than an order of magnitude less energetic than the TG analysis.
II The CT-Up Analysis
The first analysis, CT-Up, looks for upward muons from neutrino interactions in the lower part of the detector. The muon must strike a scintillator tank in the center layer, as well as a higher layer (either the top layer or the upper portion of the side walls). The analysis requires these two scintillator hits, as well as enough colinear streamer tube hits in two different views to reconstruct a track in space. Typically this is 4 hits per view, but varies depending on which planes the track traverses. To ensure that the vertex is truly internal, a projection of the track below the lowest streamer tube hit is required to pass through several streamer tube or scintillator planes which did not fire. Thus, muons that enter from below through cracks in the detector are rejected.
The vast majority of events passing these geometry cuts are downgoing atmospheric muons. The final cut relies on the time of flight measured between the two scintillator boxes to select only upgoing events. Defining by , with the convention that upgoing particles have negative , Figure 3 shows the observed distribution for all events passing the geometry cuts. A substantial peak of upgoing events is well-separated from the large background of downgoing events, although the events between the peaks show a residual background due to mistimed events.

III The B-Up-Down Analysis
The B-Up-Down analysis searches for two types of events, both of which have the same topological signature in MACRO: downward contained vertex events and externally-produced upward muons that stop in the detector. In both cases the signature is a hit in the bottom scintillator layer and a few associated colinear streamer hits. In the absence of oscillations, we expect about equal numbers from the two classes because for every downgoing neutrino that makes a track starting in the detector and ending below, there is a corresponding upgoing neutrino that could make a track of the same length in the opposite direction.
The analysis requires a B-layer scintillator hit associated with streamer tube tracks in two views (wire and strip). At least 3 colinear hits are required to define a track, which implies at least of scintillator and crushed rock must be traversed. To reduce the background attributable to the huge number of downgoing primary atmospheric muons, all hits are required to be more than from the side walls, and a projection of the track above the highest streamer tube hit must pass through several streamer planes and/or scintillator tanks which did not fire.
Experience has shown that many events passing these simple cuts do not appear to be clean neutrino-induced events. Therefore, a final hand scanning procedure is implemented to reject events where the reconstructed track appears wrong or hits outside the fiducial volume appear to be correlated with the track. Fully half the candidates are rejected by the hand scan. However, it should be noted that two different people performed the scan and made the same judgment on more than 95% of events. Simulated events passed the hand scan with greater than 95% efficiency. A small systematic uncertainty is included in the final results due to these effects.
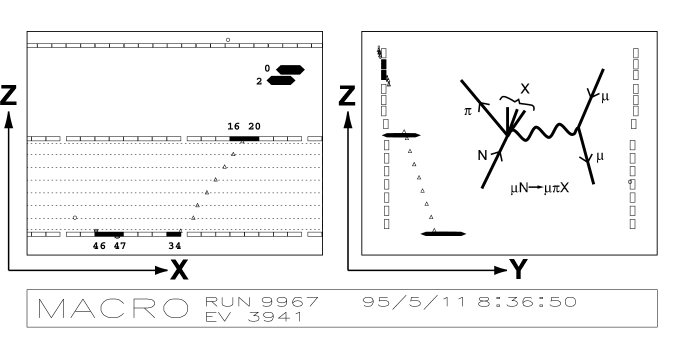
In addition to neutrino-induced events, upgoing particles (typically soft pions) are induced by downward atmospheric muons, through a photonuclear process such as
Figure 4 shows an event probably produced by this mechanism. A downgoing muon traversed the detector, and a few nanoseconds later an upgoing particle hit the detector nearby. In this case, because we saw the muon we would reject this event in the neutrino analysis. However, if the muon missed the detector and we saw only the soft pion, it would be indistinguishable from the neutrino-induced muons we are searching for. We have made a study [11] of 243 events similar to that shown in Figure 4 to characterize the spectrum of particles produced by downgoing muons. We estimate such events give an irreducible background which amounts to about 4% of the number of events we observe. MACRO’s non-compact geometry is well-suited for measuring this background, and the results in [11] can be adapted for use in other underground experiments.
IV The Monte Carlo Calculation
An approximate event rate could be determined by a semi-analytic calculation; however, it is most precise to use a Monte Carlo calculation that takes into account the detector geometry and all relevant energy loss mechanisms. The basic ingredients of the Monte Carlo calculation are a calculation of the atmospheric neutrino flux, a model of the neutrino interaction cross section, and detector simulation. We use the Bartol flux calculation [12] including geomagnetic effects. The cross section model is due to Lipari, et al [13] which computes the total cross section as the sum of three component processes – quasielastic, resonant and deep inelastic. For the deep inelastic cross section, the current work uses parton distribution function set S1 of Morfin and Tung [14], but future work will utilize a more modern distribution function. The detector simulation is the standard Geant-based MACRO simulation program, GMACRO, which has been tuned to match the copious downgoing muon data. Events output by GMACRO are in the same format as real data, and are analyzed by the same software chain as real data.
The calculation assumes that atmospheric neutrinos are the only relevant source of neutrinos. In this regard, we may point out that, in the absence of oscillations, the atmospheric neutrino flux alone overpredicts the number of observed events. Also, MACRO searches for two exotic sources of neutrino flux (WIMP annihilation in the center of the earth or the sun [15], and astrophysical point sources [16]) have been negative.
In the case of the B-Up-Down analysis, after cuts Monte Carlo events are randomly merged with real events before the hand scan, so that the people performing the scan do not know if they are looking at a real or a Monte Carlo event.
V Results
The B-Up-Down analysis had an effective livetime of 2.81 years, occurring between July, 1994 and November, 1997. 125 events passed the scan, of which 5 are estimated to be background due to soft pion production. The zenith angle distribution of the background-subtracted sample is shown in Figure 5a. In this case, we do not know if any individual event is upgoing or downgoing, so the horizontal axis is , with vertical to the left and horizontal to the right.
The CT-Up analysis utilized a total effective livetime of 3.16 years, accumulated between April, 1994 and November, 1997. 88 events are identified in the upgoing peak of Figure 3, of which an estimated 3 are due to the mistimed background. The zenith angle distribution of the background-subtracted sample is shown in Figure 5b. All of these events are upgoing.
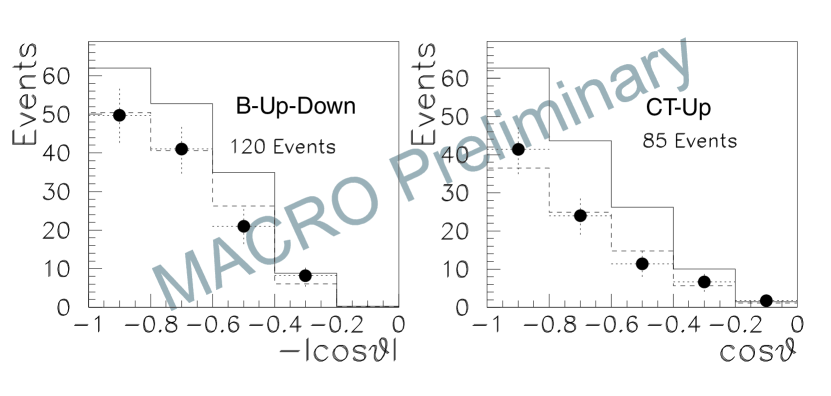
Also shown in Figure 5 in a solid line is the result of the Monte Carlo prediction, assuming no oscillations. Integrating over all zenith bins, the Monte Carlo predicts, for B-Up-Down, events and for CT-Up, . Forming the ratio of observed to expected, we get our preliminary results,
Both ratios, especially CT-Up, differ significantly from unity, though the significance is greatly degraded by the theoretical uncertainty, of order 25%, on the neutrino flux and neutrino cross section. We have not done a complete analysis of oscillations pending a more careful calculation of the uncertainties. However, the zenith distributions are highly suggestive of oscillations with maximal mixing and of a few times . With these parameters, we expect neutrinos from below, which travel thousands of kilometers through the earth, to be fully oscillated (50% deficit) while neutrinos from above or from the horizontal, which travel only tens of kilometers, are hardly suppressed at all. For the B-Up-Down analysis, in which the vertical bins sum over upward and downward neutrinos, we expect half the upward and none of the downward neutrinos to disappear, giving a deficit of 25%. In fact, we have shown on Figure 5 in the dashed lines the expectation for a test point of and which seems to fit the data quite well (but the remarkable fit should not be taken at face value due to the large theoretical errors in the prediction, not shown in the figure).
VI Conclusions
The CT-Up and B-Up-Down analyses, presented in preliminary form here, provide a measurement of the atmospheric neutrino flux that is independent of, and complementary to, the MACRO TG analysis, although with smaller statistics. Both preliminary analyses seem inconsistent with no oscillations, although the theoretical uncertainties are large. Both analyses agree well with oscillations with parameters ( and ) consistent with those suggested by the MACRO TG analysis, as well as other experiments.
In the near future, we will analyze an additional 1.25 years of data already in the can, and do further work to quantify systematic and theoretical uncertainties. We will also compute double ratios to try to cancel some uncertainties. A ratio of the present low-energy events to the standard throughgoing events is of limited value in canceling errors, because the primary cosmic ray flux and the cross sections at the different energies may have different systematics. A more promising ratio is that of the two low-energy analyses, . Referring again to Figure 2, these events come from the same energy range, so a great cancellation of uncertainties will occur. This should strengthen the conclusions outlined in rough form in Section V.
REFERENCES
- [1] Messier, M. (for the Super Kamiokande Collaboration), these DPF’99 Proceedings. Also, Habig, A. (for the Super Kamiokande Collaboration), these DPF’99 Proceedings.
- [2] Goodman, M. (for the Soudan 2 Collaboration), these DPF’99 Proceedings.
- [3] Casper, D. et al (IMB), Phys. Rev. Lett. 66, 2561 (1991).
- [4] Fukuda, Y. et al (The Kamiokande Collaboration), Phys. Lett. B335, 237 (1994).
- [5] Boliev, M.M. et al (Baksan), Nucl. Phys. B70 (Proc. Suppl.) 371 (1999).
- [6] Daum, K. et al (Frejus), Z. Phys. C66, 417 (1995).
- [7] Aglietta, M. et al (NUSEX), Europhys. Lett. 8, 611 (1989).
- [8] Becker-Szendy, R. et al (IMB), Phys. Rev. Lett. 69, 1010 (1992).
- [9] Longley, L. (for the MACRO Collaboration), these DPF’99 Proceedings. Also Ambrosio, M. et al (the MACRO Collaboration), Phys. Lett. B434 451 (1998).
- [10] Ahlen, S. et al (the MACRO Collaboration), Nucl. Instr. and Meth. A324, 337 (1993).
- [11] Ambrosio, M. et al (the MACRO Collaboration), Astropart. Phys. 9, 105 (1998).
- [12] Agrawal, V. et al (Bartol), Phys. Rev. D53, 1314 (1996).
- [13] Lipari, et al., Phys. Rev. Lett. 74, 4384 (1995).
- [14] Morfin, J.G. and W.K. Tung, Z. Phys. C52, 13 (1991).
- [15] Michael, D.G. (for the MACRO Collaboration), these DPF’99 Proceedings. Also Ambrosio, M. et al (the MACRO Collaboration), hex-ex/9812020, submitted to Phys. Rev. D.
- [16] Ambrosio, M. et al (the MACRO Collaboration), Proceedings of High Energy Phenomena in Astrophysics, Moriond, January 18-25, 1997.