First Observation of the Decay
Abstract
The decay has been observed with the CLEO II detector. The is reconstructed in two decay channels, and . The is reconstructed from the decay . The measured branching fraction is . We also measure the inclusive branching fractions without requiring the resonance, and . The results indicate that the resonance dominates the mass spectrum.
M. Bishai,1 S. Chen,1 J. Fast,1 J. W. Hinson,1 N. Menon,1 D. H. Miller,1 E. I. Shibata,1 I. P. J. Shipsey,1 S. Glenn,2 Y. Kwon,2,***Permanent address: Yonsei University, Seoul 120-749, Korea. A.L. Lyon,2 S. Roberts,2 E. H. Thorndike,2 C. P. Jessop,3 K. Lingel,3 H. Marsiske,3 M. L. Perl,3 V. Savinov,3 D. Ugolini,3 X. Zhou,3 T. E. Coan,4 V. Fadeyev,4 I. Korolkov,4 Y. Maravin,4 I. Narsky,4 R. Stroynowski,4 J. Ye,4 T. Wlodek,4 M. Artuso,5 E. Dambasuren,5 S. Kopp,5 G. C. Moneti,5 R. Mountain,5 S. Schuh,5 T. Skwarnicki,5 S. Stone,5 A. Titov,5 G. Viehhauser,5 J.C. Wang,5 J. Bartelt,6 S. E. Csorna,6 K. W. McLean,6 S. Marka,6 Z. Xu,6 R. Godang,7 K. Kinoshita,7 I. C. Lai,7 P. Pomianowski,7 S. Schrenk,7 G. Bonvicini,8 D. Cinabro,8 R. Greene,8 L. P. Perera,8 G. J. Zhou,8 S. Chan,9 G. Eigen,9 E. Lipeles,9 J. S. Miller,9 M. Schmidtler,9 A. Shapiro,9 W. M. Sun,9 J. Urheim,9 A. J. Weinstein,9 F. Würthwein,9 D. E. Jaffe,10 G. Masek,10 H. P. Paar,10 E. M. Potter,10 S. Prell,10 V. Sharma,10 D. M. Asner,11 J. Gronberg,11 T. S. Hill,11 D. J. Lange,11 R. J. Morrison,11 H. N. Nelson,11 T. K. Nelson,11 D. Roberts,11 B. H. Behrens,12 W. T. Ford,12 A. Gritsan,12 H. Krieg,12 J. Roy,12 J. G. Smith,12 J. P. Alexander,13 R. Baker,13 C. Bebek,13 B. E. Berger,13 K. Berkelman,13 V. Boisvert,13 D. G. Cassel,13 D. S. Crowcroft,13 M. Dickson,13 S. von Dombrowski,13 P. S. Drell,13 K. M. Ecklund,13 R. Ehrlich,13 A. D. Foland,13 P. Gaidarev,13 R. S. Galik,13 L. Gibbons,13 B. Gittelman,13 S. W. Gray,13 D. L. Hartill,13 B. K. Heltsley,13 P. I. Hopman,13 J. Kandaswamy,13 D. L. Kreinick,13 T. Lee,13 Y. Liu,13 N. B. Mistry,13 C. R. Ng,13 E. Nordberg,13 M. Ogg,13,†††Permanent address: University of Texas, Austin TX 78712. J. R. Patterson,13 D. Peterson,13 D. Riley,13 A. Soffer,13 B. Valant-Spaight,13 A. Warburton,13 C. Ward,13 M. Athanas,14 P. Avery,14 C. D. Jones,14 M. Lohner,14 C. Prescott,14 A. I. Rubiera,14 J. Yelton,14 J. Zheng,14 G. Brandenburg,15 R. A. Briere,15 A. Ershov,15 Y. S. Gao,15 D. Y.-J. Kim,15 R. Wilson,15 H. Yamamoto,15 T. E. Browder,16 Y. Li,16 J. L. Rodriguez,16 S. K. Sahu,16 T. Bergfeld,17 B. I. Eisenstein,17 J. Ernst,17 G. E. Gladding,17 G. D. Gollin,17 R. M. Hans,17 E. Johnson,17 I. Karliner,17 M. A. Marsh,17 M. Palmer,17 M. Selen,17 J. J. Thaler,17 K. W. Edwards,18 A. Bellerive,19 R. Janicek,19 P. M. Patel,19 A. J. Sadoff,20 R. Ammar,21 P. Baringer,21 A. Bean,21 D. Besson,21 D. Coppage,21 C. Darling,21 R. Davis,21 S. Kotov,21 I. Kravchenko,21 N. Kwak,21 L. Zhou,21 S. Anderson,22 Y. Kubota,22 S. J. Lee,22 R. Mahapatra,22 J. J. O’Neill,22 R. Poling,22 T. Riehle,22 A. Smith,22 M. S. Alam,23 S. B. Athar,23 Z. Ling,23 A. H. Mahmood,23 S. Timm,23 F. Wappler,23 A. Anastassov,24 J. E. Duboscq,24 K. K. Gan,24 T. Hart,24 K. Honscheid,24 H. Kagan,24 R. Kass,24 J. Lee,24 H. Schwarthoff,24 A. Wolf,24 M. M. Zoeller,24 S. J. Richichi,25 H. Severini,25 P. Skubic,25 and A. Undrus25
1Purdue University, West Lafayette, Indiana 47907
2University of Rochester, Rochester, New York 14627
3Stanford Linear Accelerator Center, Stanford University, Stanford, California 94309
4Southern Methodist University, Dallas, Texas 75275
5Syracuse University, Syracuse, New York 13244
6Vanderbilt University, Nashville, Tennessee 37235
7Virginia Polytechnic Institute and State University, Blacksburg, Virginia 24061
8Wayne State University, Detroit, Michigan 48202
9California Institute of Technology, Pasadena, California 91125
10University of California, San Diego, La Jolla, California 92093
11University of California, Santa Barbara, California 93106
12University of Colorado, Boulder, Colorado 80309-0390
13Cornell University, Ithaca, New York 14853
14University of Florida, Gainesville, Florida 32611
15Harvard University, Cambridge, Massachusetts 02138
16University of Hawaii at Manoa, Honolulu, Hawaii 96822
17University of Illinois, Urbana-Champaign, Illinois 61801
18Carleton University, Ottawa, Ontario, Canada K1S 5B6
and the Institute of Particle Physics, Canada
19McGill University, Montréal, Québec, Canada H3A 2T8
and the Institute of Particle Physics, Canada
20Ithaca College, Ithaca, New York 14850
21University of Kansas, Lawrence, Kansas 66045
22University of Minnesota, Minneapolis, Minnesota 55455
23State University of New York at Albany, Albany, New York 12222
24Ohio State University, Columbus, Ohio 43210
25University of Oklahoma, Norman, Oklahoma 73019
The study of the hadronic decays of the lepton is important for a better understanding of the weak hadronic current and its symmetries. The decays involving an meson are associated with the Wess-Zumino-Witten anomaly [1] and are rare. The first such decay, , was observed by CLEO in 1992 [2] and subsequently by ALEPH [3]. More recently, CLEO has measured the branching fractions of two other decays [4], [5] and [6], where or . Both measurements are two orders of magnitude higher than the predictions by Pich [7] based on chiral perturbation theory. However, the recent calculation by Li [8] using an effective chiral theory in the limit of chiral symmetry is in good agreement with these results. In the calculation, the former decay proceeds through the vector current with dominant and the latter decay proceeds through the axial-vector current with dominant. For the decay , Pich predicts that the enhancement in the system with and while Li predicts that the axial-vector current is dominant with . In this Letter, we report a first measurement of the decay , and . We also measure the inclusive branching fractions without requiring the resonance.
The data used in this analysis have been collected from collisions at a center-of-mass energy of GeV with the CLEO II detector at the Cornell Electron Storage Ring (CESR). The total integrated luminosity of the sample is 4.7 fb-1, corresponding to the production of pairs. The CLEO II detector has been described in detail elsewhere [9].
We select events in which one charged particle from the tag decay is recoiling against one or three charged particles of the signal decay. The candidate events must therefore have two or four charged tracks and zero net charge. To reject beam-gas events, we require that the distance of closest approach to the interaction point of the non- candidate tracks be within 0.5 cm (5 cm) transverse to (along) the beam direction. Each event is divided into two hemispheres (tag vs. signal) using the plane perpendicular to the thrust axis [10], calculated from both charged tracks and photons. Photons are defined as energy clusters in the calorimeter of at least 60 MeV in the barrel, , and 100 MeV in the end cap, , where is the polar angle with respect to the beam axis. There must be two or more photons in the barrel for the signal hemisphere. However, if there are more than two (four) photons with an energy above 100 MeV, including the end cap, the event is rejected in the () analysis. The opening angle between the total momentum vectors of the decay products of the two leptons must be greater than . The tag hemisphere must contain only one charged particle, and its momentum must be greater than 0.5 GeV/c. The hemisphere may not contain more than three energetic photons ( MeV). In the case of two or more photons, there must be at least one candidate reconstructed, MeV/c2 (). The hadronic background is suppressed by a requirement that the total invariant mass of the particles in each hemisphere be less than the mass, GeV/c2. Two-photon, Bhabha, and hadronic events are suppressed by the requirements on the total visible energy, , and on the measured net transverse momentum of the event, GeV/c. All charged particles and photons are included in the calculation of these kinematic variables.
Particle identification for the decay is based on a confidence level ratio which is constructed from the confidence levels for and hypotheses [5], and . The confidence level ratio for is , and similarly for (). The confidence level is computed from the probability for a particle hypothesis using a combination of the time of flight and drift chamber () information.
Candidate mesons are reconstructed using pairs of oppositely charged tracks with vertices separated from the primary interaction point by at least 10 mm in the plane transverse to the beam. The invariant mass is required to be within 15 MeV/c2 () of the mass.
The mesons are reconstructed with photons in the barrel using the decay channel. Each photon must have an energy above 150 MeV and a lateral profile of energy deposition consistent with that expected of a photon. In addition, we do not use the fragments of a nearby large shower. The photon may not combine with any other photon to form a candidate.
For the analysis, events with three charged particles in the signal hemisphere were selected. Figure 1 shows the invariant mass spectra of two photons accompanying the candidate, with the requirements that the mass be in the signal band (0.81 - 0.97 GeV/c2) or sidebands (0.70 - 0.78, 1.00 - 1.08 GeV/c2). An signal is observed in the signal region, and there is no indication of a signal in the sideband region. The curves show fits to the data using a Gaussian signal and a linear background. The width of the Gaussian is constrained to the Monte Carlo expectation, MeV/c2. The fit shown in Fig. 1(a) yields a signal of events. The yield in the sidebands is events. We have therefore observed for the first time the decay .
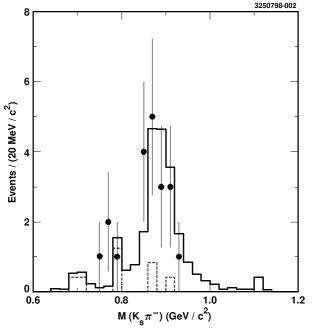
As a check of the validity of the signal for , we show the invariant mass spectrum of the system for events with an candidate ( MeV/c2) in Fig. 2. A clear signal is observed.

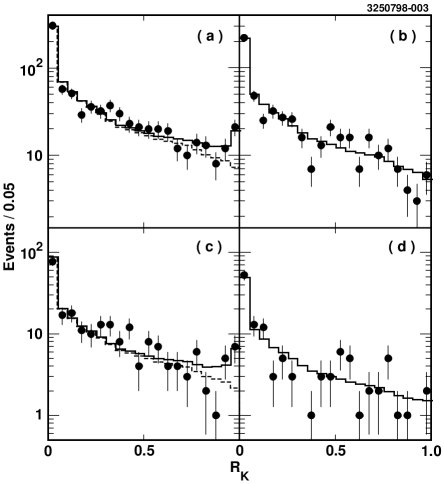
For the analysis, we select events with the signal hemisphere containing a charged particle, a candidate reconstructed using barrel photons plus two other barrel photons. The distributions for the charged particle in the signal hemisphere is shown in Fig. 3. The invariant mass of the two photons accompanying the charge particle and candidate is required to be (a) in the signal band (0.50 - 0.59 GeV/c2), and (b) in the signal sideband (0.440 - 0.485, 0.605 - 0.650 GeV/c2). Figures 3(c) and 3(d) show the corresponding distributions for the case in which the mass is in the signal band with the assumption that the charged particle is a kaon. There are enhancements at 0 and, in (a) and (c), 1.0, as expected from the decays and respectively. The histograms show fits to the data using the Monte Carlo expectation for spectra for these two decays and the migration from other decays. The fit results on the number of events with a kaon accompanying the candidate are summarized in Table I.
The detection efficiencies for the candidate events and background from hadronic events are calculated with a Monte Carlo simulation. The KORALB program [11] is used to generate pairs and the Lund program [12] for hadronic events. The signal decays are modeled by phase space assuming a weak interaction. The detector response is simulated using the GEANT program [13]. The identification and misidentification efficiencies of pions and kaons are calibrated as a function of momentum by comparing the efficiencies measured from samples of pions and kaons from the decays and with the hadronic Monte Carlo expectations. In the estimation of the hadronic background, the multiplicity in the hadronic Monte Carlo program has been normalized to produce the observed multiplicity in events with the invariant mass of one of the hemispheres greater than . Two-photon interactions are estimated to be a negligible source of background [5].
| Requirements | Fig. 3 | /DOF | |
|---|---|---|---|
| signal band | (a) | 23/18 | |
| sideband | (b) | 35/18 | |
| signal band, region | (c) | 25/18 | |
| sideband, region | (d) | 21/15 |
The signals, backgrounds, and detection efficiencies are summarized in Tables II and III. In calculating the detection efficiencies and backgrounds in the analysis, the Monte Carlo predictions have been corrected for the appropriate momentum-dependent identification and misidentification efficiency scaling factors. The branching fraction for [6] is used to estimate the feeddown in the analysis.
| requirement | Yes | No |
|---|---|---|
| Signal | ||
| Signal ( sideband) | - | |
| ( sideband) | - | |
| Eff. (%) | ||
| requirement | Yes | No |
|---|---|---|
| band | ||
| sideband | ||
| - | ||
| Eff. (%) | ||
| 1.4 | 1.4 | |
| 0.8 | 0.8 | |
| 2 | - | |
| Hadronic background | 5 | 6 |
| sideband subtraction | - | 29 |
| Fit | 5 | 27 |
| detection eff. [15] | 2 | - |
| Acceptance | 3 | 3 |
| Decay model | 4 | 4 |
| MC statistics | 3 | 2 |
| Total | 10 | 40 |
There are several sources of systematic errors as shown in Table IV. These include the uncertainties in the number of events produced, branching fractions, background subtraction, fitting procedure, detection efficiency, acceptance calculation, decay modeling, as well as the uncertainty due to limited Monte Carlo statistics. The uncertainty in the spectrum at for pions (tail) and kaons (peak) is a major source of the systematic error in the fitting analysis. The kaon peak depends on the momentum distribution which is different for and non-resonant decays. The differences are taken as the systematic error estimate. The systematic error in the acceptance calculation includes the uncertainties in the simulation of the tracking, photon detection and veto efficiencies. The acceptance depends also on the decay model; the corresponding systematic error is estimated by comparing the detection efficiencies for the decays and with and without the resonance.
The branching fractions for , and are extracted after correcting for backgrounds and detection efficiencies. The results are
,
.
Combining these results with the isospin requirement yields
.
The inclusive measurements without the resonance requirement are
,
,
where the first error is statistical and the second systematic. The inclusive results are in reasonable agreement with the measurements requiring the resonance.
In summary we have measured for the first time the branching fraction of . The result is somewhat higher than the theoretical prediction by Li [8] (). We also measure the inclusive branching fractions without requiring the resonance. The measurements are significantly higher than the theoretical predictions by Pich [7]. The results for the mode indicate that the resonance dominates the mass spectrum.
We gratefully acknowledge the effort of the CESR staff in providing us with excellent luminosity and running conditions. This work was supported by the National Science Foundation, the U.S. Department of Energy, Research Corporation, the Natural Sciences and Engineering Research Council of Canada, the A.P. Sloan Foundation, the Swiss National Science Foundation, and the Alexander von Humboldt Stiftung.
REFERENCES
- [1] J. Wess and B. Zumino, Phys. Lett. B37, 95 (1971); E. Witten, Nucl. Phys. B223, 422 (1983).
- [2] CLEO Collaboration, M. Artuso et al., Phys. Rev. Lett. 69, 3278 (1992).
- [3] ALEPH Collaboration, D. Buskulic et al., Z. Phys. C74, 263 (1997).
- [4] Charge conjugation is implied throughout the paper.
- [5] CLEO Collaboration, J. Bartelt et al., Phys. Rev. Lett. 76, 4119 (1996).
- [6] CLEO Collaboration, T.Bergfeld et al., Phys. Rev. Lett. 79, 2406 (1997).
- [7] A. Pich, Phys. Lett. B196, 561 (1987).
- [8] B. A. Li, Phys. Rev. D55, 1436 (1997); Phys. Rev. D57, 1790 (1998).
- [9] CLEO Collaboration, Y. Kubota et al., Nucl. Instrum. Methods A320, 66 (1992).
- [10] E. Farhi, Phys. Rev. Lett. 39, 1587 (1977).
- [11] S. Jadach and Z. Was, Comput. Phys. Commun. 36, 191 (1985); 64, 267 (1991); S. Jadach, J.H. Kuhn, and Z. Was, ibid. 64, 275 (1991).
- [12] T. Sjöstrand and M. Bengtsson, Comput. Phys. Commun. 43, 367 (1987).
- [13] R. Brun et al., CERN Report No. CERN-DD/EE/84-1, 1987 (unpublished).
- [14] Review of Particle Properties, R.M. Barnett et al., Phys. Rev. D54 (1996).
- [15] CLEO Collaboration, M. Bishai et al., Phys. Rev. Lett. 78, 3261 (1997).