Siberian Branch of Russian Academy of Science
BUDKER INSTITUTE OF NUCLEAR PHYSICS
M.N.Achasov,
V.M.Aulchenko,
S.E.Baru,
K.I.Beloborodov,
A.V.Berdyugin,
A.V.Bozhenok,
A.D.Bukin,
D.A.Bukin,
S.V.Burdin,
T.V.Dimova,
S.I.Dolinsky,
V.P.Druzhinin,
M.S.Dubrovin,
D.I.Ganushin,
I.A.Gaponenko,
V.B.Golubev,
V.N.Ivanchenko,
P.M.Ivanov,
I.A.Koop,
A.A.Korol,
M.S.Korostelev,
S.V.Koshuba,
A.P.Lysenko,
A.A.Mamutkin,
I.N.Nesterenko,
A.V.Otboev,
E.V.Pakhtusova,
E.A.Perevedentsev,
A.A.Polunin,
E.E.Pyata,
A.A.Salnikov,
S.I.Serednyakov,
V.V.Shary,
Yu.M.Shatunov,
V.A.Sidorov,
Z.K.Silagadze,
A.N.Skrinsky,
Yu.V.Usov,
A.A.Valishev,
A.V.Varganov,
A.V.Vasiljev,
Yu.S.Velikzhanin
Experiments at VEPP-2M with SND detector
Budker INP 98-65
NOVOSIBIRSK
1998
Experiments at VEPP-2M with SND detector
M.N.Achasov,
V.M.Aulchenko,
S.E.Baru,
K.I.Beloborodov,
A.V.Berdyugin,
A.V.Bozhenok,
A.D.Bukin,
D.A.Bukin,
S.V.Burdin,
T.V.Dimova,
S.I.Dolinsky,
V.P.Druzhinin,
M.S.Dubrovin,
D.I.Ganushin,
I.A.Gaponenko,
V.B.Golubev,
V.N.Ivanchenko,
P.M.Ivanov,
I.A.Koop,
A.A.Korol,
M.S.Korostelev,
S.V.Koshuba,
A.P.Lysenko,
A.A.Mamutkin,
I.N.Nesterenko,
A.V.Otboev,
E.V.Pakhtusova,
E.A.Perevedentsev,
A.A.Polunin,
E.E.Pyata,
A.A.Salnikov,
S.I.Serednyakov,
V.V.Shary,
Yu.M.Shatunov,
V.A.Sidorov,
Z.K.Silagadze,
A.N.Skrinsky,
Yu.V.Usov,
A.A.Valishev,
A.V.Varganov,
A.V.Vasiljev,
Yu.S.Velikzhanin
Budker Institute of Nuclear Physics SB RAS
630090 Novosibirsk, Russia
Abstract
Short overview of experiments with SND detector at VEPP-2M collider in the energy range and preliminary results of data analysis are presented.
©Budker Institute of Nuclear Physics SB RAS
1 Introduction
The SND detector [1] was proposed in 1987 [2] to continue successful series of experiments with the ND detector [3] at VEPP-2M collider [4] in Novosibirsk. The goal of experiments was a detailed investigation of annihilation processes in the same energy range , in particular the final states with photons and other neutral particles (), decaying into photons.
The main part of the SND is a spherical electromagnetic calorimeter, consisted of 1630 crystals. The total weight of is 3.6 t, the solid angle coverage is of steradian. Energy resolution for photons is [5], angular resolution is about degrees. The angles of charged particles are measured by two cylindrical drift chambers covering 95% of steradian solid angle. Angular accuracy of charged tracks measurements () is about and degrees in azimuth in polar directions respectively. From the outside SND detector is covered by muon system, consisting of streamer tubes [6] and plastic scintillation counters.
2 PHI-96 Experiment
Detailed description of PHI-96 experiment and first physical results, based on about half of the statistics, were published in [7]. The PHI-96 experiment was carried out in the period from February 1996 until January 1997. Seven successive scans PHI_9601 PHI_9606 and PHI_9608 were performed in the center of mass energy range from 980 to 1044 MeV. Data were recorded at 14 different values of the beam energy. The total of integrated luminosity was collected, corresponding to 8.3 million mesons produced. Most of the results presented in this paper are based on full recorded statistics.
3 MHAD-97 Experiment
The MHAD-97 experiment was described in [7]. In the period from January until June 1997 two scans were performed in the energy range from 960 to 1380 MeV with a step of 10 MeV and total integrated luminosity of . At present the MHAD9701 scan is accessible for processing completely, while only part of MHAD9702 scan has been preprocessed. The results of this paper are based on the integrated luminosity from both scans, corresponding to production of about pairs.
4 PHI-97 and OMEGA-98 Experiments
The 1997—1998 data taking runs started in October 1997. The goal was a significant increase of the meson statistics in order to improve the accuracy of measurements of electrical dipole decays and , observed with SND for the first time. Three big scans PHI_9703, PHI_9801, PHI_9802 were carried out, covering 16 energy points in the center of mass energy range . The total recorded integrated luminosity was , corresponding to 15 million mesons produced, that is two times more than in PHI-96 experiment.
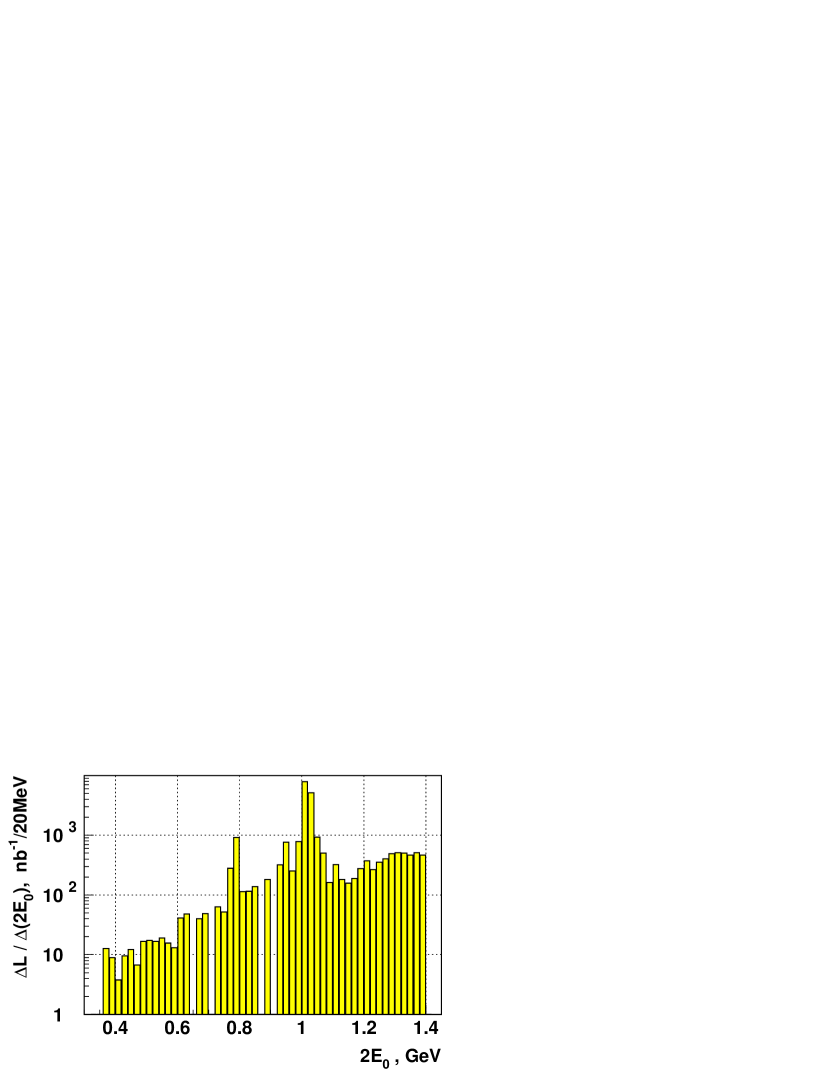
From March to June 1998 both SND and CMD-2 detectors took data in the energy range from down to (OME_9803 scan). The goal of this run was measurement of hadronic production cross sections and search for rare decays of and mesons. Integrated luminosity of was collected, corresponding to pairs and mesons produced. Significant part of data — were accumulated in the energy range , where mesons were produced. In Fig. 2 a week-by-week graph of statistics, recorded by SND is shown. Fig. 2 shows the VEPP-2M luminosity averaged over experimental time as a function of energy. Solid curve in Fig. 2 corresponds to dependence, normalized to the experimental value at . All listed above experiments were carried out with a superconducting wiggler [8].
A distribution of full integrated luminosity accumulated with SND up to now is shown in Fig. 5. The data processing of last runs PHI-97 and OMEGA-98 will be started in the end of 1998. We believe, that preprocessing of this data will be finished in half a year. After that, new data will be available for analysis.
5 General remarks on data processing
5.1 The analysis of “neutral” modes
SND has an advantage in detection of pure “neutral” final states. Up to now the PHI-96 and MHAD-97 experimental data were analyzed in order to study or search for the following -meson decays:
| (1) |
| (2) |
| (3) |
| (4) |
| (5) |
| (6) |
| (7) |
| (8) |
as well as non-resonant or non -meson processes:
| (9) |
| (10) |
| (11) |
| (12) |
| (13) |
| (14) |
| (15) |
| (16) |
| (17) |
| (18) |
| (19) |
In analysis of any processes listed above, all remaining processes should be considered as a background. Processes with any number of photons in the final state could mimic any certain process, particularly in case, when the cross-section of the background process is much larger. The number of found photons in an event could be less than the number of produced photons, due to the merging of close showers in the calorimeter, or when some of particles escape detection. On the other hand, additional photons could be found in events due to shower splitting or beam background photons hitting the detector.
Parameters, which are widely used in different analyses are listed below:
— number of found photons.
— total energy deposition.
— absolute value of total momentum.
— total energy deposition in the calorimeter,
normalized by the center of mass energy.
— absolute value of total momentum of all detected
particles in assumption, that all particles are electrons and photons,
normalized by the total energy deposition.
— total energy deposited by neutral particles,
normalized by the center of mass energy .
— energy deposition of -th particle.
— maximum energy of neutral particle in an event.
— polar angle of -th particle (particles are enumerated
in the following way: charged particles first, then neutral particles
in descending order in energy within each group).
— minimum polar angle between particle and beam direction
in an event.
— azimuth angle of -th particle.
— the likelihood
of a hypothesis, that given transverse energy profile of a cluster of
hit crystals in the calorimeter can be attributed to a single photon
[9],[10].
This parameter allows one to separate events with isolated photon showers,
from events, which have
overlapping showers or group of hit crystals from -meson
decay or nuclear interaction.
— parameter, describing the degree of energy-momentum balance
in an event under assumption that all particles are photons
and electrons.
— parameter, similar to
, describing likelihood of assumption,
that there is an intermediate state in event
(for instance could be , ,
etc.).
— number of found -s.
For example for primary selection of 5- events of the processes (1), (2), and (9), the following cuts were imposed:
| (20) | |||||
5.2 Analysis of the processes with charged particles
Up to now the following processes with charged particles in the final state were analyzed:
| (21) |
| (22) |
| (23) |
| (24) |
| (25) |
| (26) |
| (27) |
| (28) |
| (29) |
| (30) |
| (31) |
| (32) |
| (33) |
| (34) |
Let us list typical parameters, used in analyses of events with charged particles:
— number of detected charged particles;
— distance between -th particle track and beam axis in plane;
— coordinate of the point on the track of -th particle, closest to the beam axis;
— number of fired wires in the drift chamber.
— spatial angle between -th and -th particles.
— energy deposition in drift chamber for -th particle.
Parameters of kinematic fit like are also used with additional assumptions about masses of charged particles in a similar way as .
6 Physical results from the PHI-96 experiment
6.1 The decay
The decay is a radiative magnetic
dipole transition of into meson,
studied previously in many experiments [11]. In this
work we measured the decay rate into
multi-photon final state:
(5). To suppress the background
the events were selected satisfying the following criteria:
; ;
;
;
;
.
The presence of mesons in event
was not required in the kinematic fit.
As a result of such selection cosmic background was completely rejected and
main background process
(6) was suppressed significantly, as one can see
in the distribution in
, recoil mass of the most energetic photon in the
event
(Fig.27), where peak at mass dominates.
For final selection of events the soft
cut on was used:
.
The estimated detection efficiency is close to and
background contribution,
obtained using the number of events from the
interval , is about .
The ratio of the background events numbers in these two regions was
taken from simulation of the process (6).
The fit of visible cross section was done for each of the 6 scans
separately. Free parameters of the fit were the shift of the
energy scale of VEPP-2M, meson width, and the branching ratio
.
Also taken into account were collider beam energy spread,
instability of average beam energy, the radiative corrections,
the VDM contribution of and resonances,
and presence of dead calorimeter channels.
The fit results are listed in Table 1.
| Experiment | , MeV | ||
|---|---|---|---|
| PHI_9601 | 1045 | ||
| PHI_9602 | 1436 | ||
| PHI_9603 | 2163 | ||
| PHI_9604 | 1241 | ||
| PHI_9605 | 2222 | ||
| PHI_9606 | 1709 |
Averaging the data from the Table 1 one can obtain the branching ratio
Here the first error is statistical and the second is a systematic one,
estimated to be . The systematic error
is mainly determined by the following contributions:
the systematic uncertainty of normalisation ();
the background subtraction error ();
the error in the detection efficiency ();
the error in ( [11]);
the error in ( [11]);
the error in value of interference term (.
The results in Table 1 show some difference between separate PHI-96 scans. The scale factor for the branching ratio, calculated according to PDG recommendations, is equal to 1.4. It was taken into account in the presented statistical error.
The result obtained in the present work is in agreement with PDG value [11]. At the moment it is the most accurate single measurement of .
6.2 Analysis of the decay
The decay is closely related to the radiative decay , where, instead of a real photon, virtual one is produced, decaying via the channel . This type of decays is called Dalitz or conversion one. Experimental study of these processes is a test of quantum electrodynamics. Besides this, existence of transition form factor [12] affects invariant mass spectrum , which was evaluated in different models. Theoretical value of for a unit form factor is
This decay was observed for the first time in our experiment with the detector ND [13] in 1985, with a branching ratio of . Later similar result was obtained with the CMD-2 [14] detector: .
In present analysis the decay was studied in the reaction (21). The following event selection criteria were used:
where is a logarithmic likelihood function, obtained as a result of kinematic fit, using the energies and angles of all particles (invariant mass of two photons being evaluated as well). All 7 -meson scans were processed with these selection criteria.
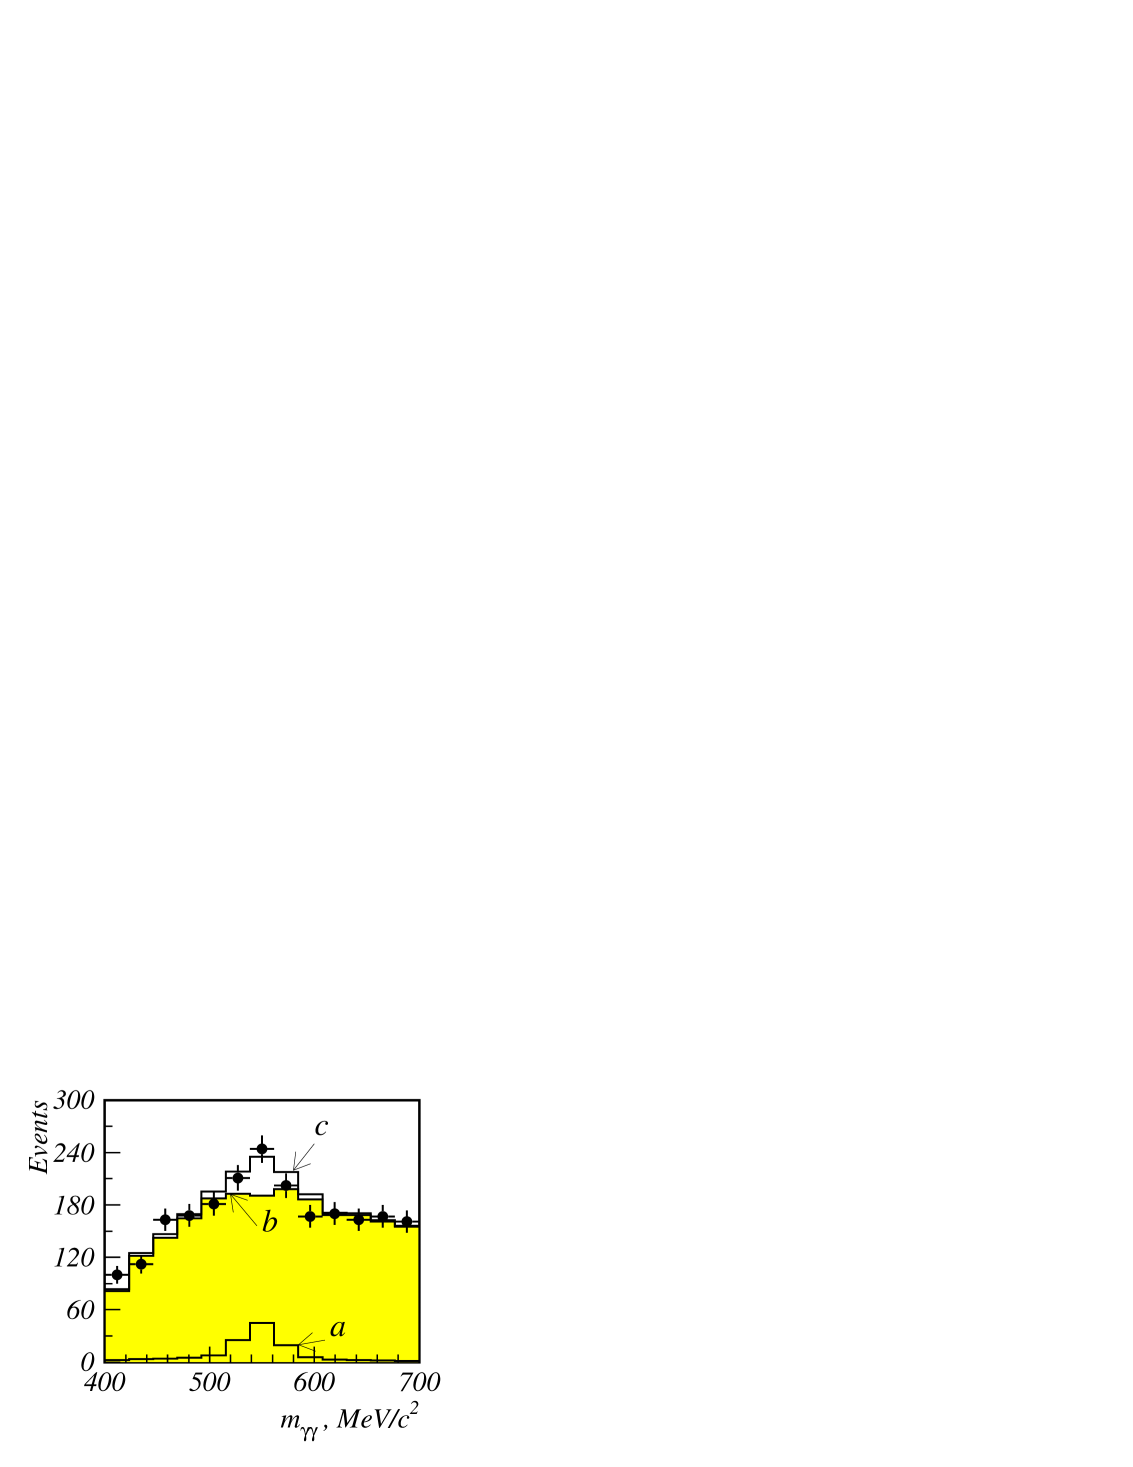
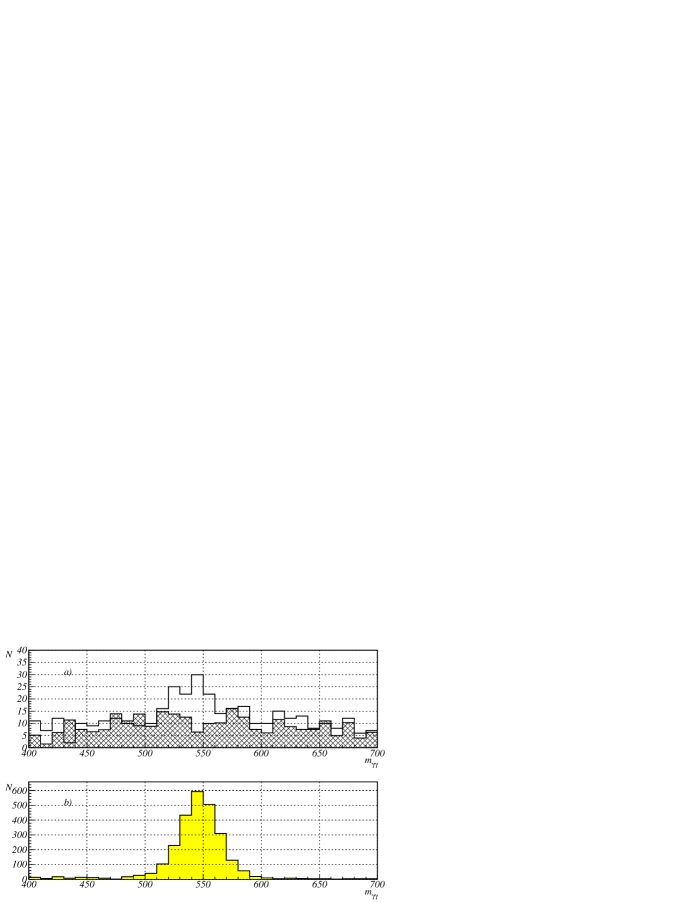
The distributions of experimental events over invariant mass of two photons together with corresponding distributions of simulated and QED events are shown in Fig.5. The simulated distributions are normalized to the branching ratio from [11] for , and to the total integrated luminosity for QED reaction. One can see that the experimental background is almost entirely provided by QED process, which has identical final state as the one, searched for. Now let us evaluate the result in two ways.
First, the experimental distribution over was fitted with a background, approximated by a third order polynomial and Gaussian, representing the process. As a result of the fit (Fig.5) we obtain the number of events in the peak . Branching ratio reads:
| (35) |
where is the number of produced -mesons, is a detection efficiency, obtained by simulation. Systematic error in here was neglected.
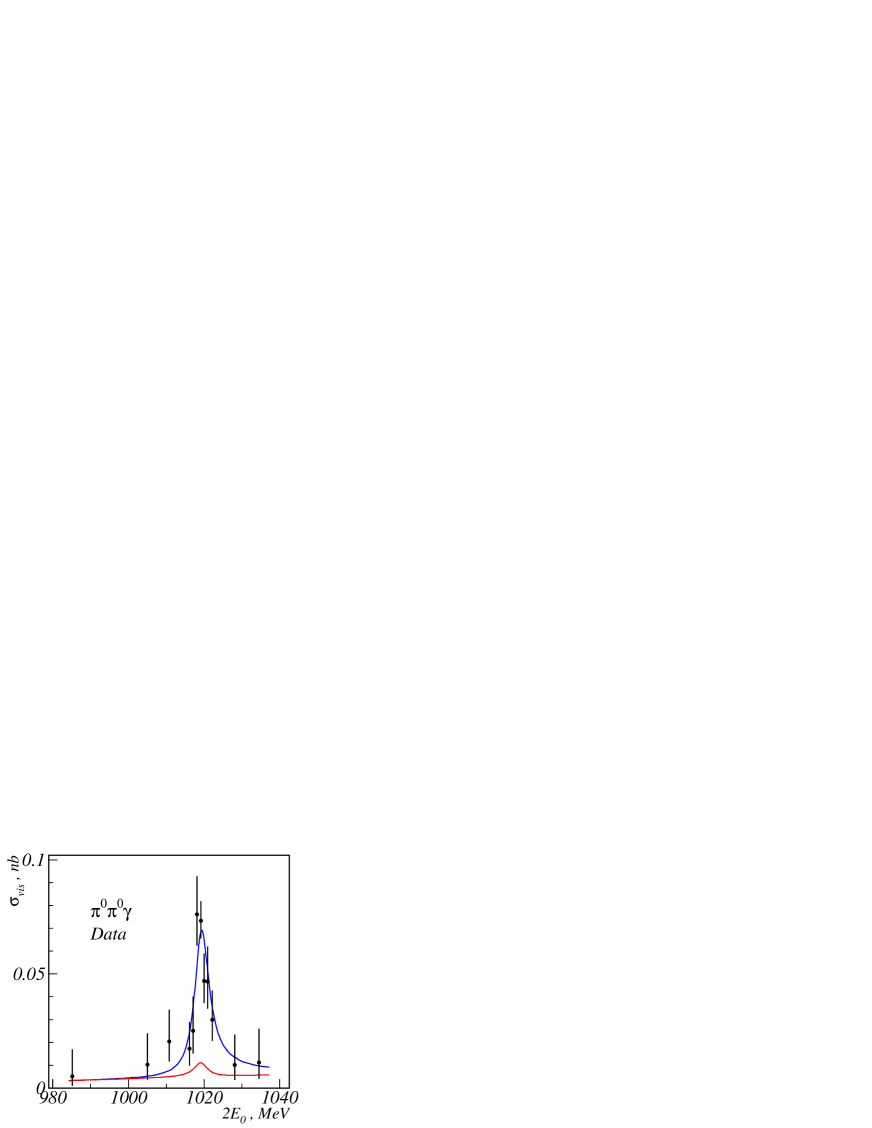
Second, let us derive branching ratio , using the energy dependence of visible cross section of the events, satisfying the additional condition . The fitted resonance curve is shown in Fig.9. -meson mass and width were fixed at the values and [11]. As a result of the fit the following parameters values were obtained: , background level . Apparently, the value of is excessive due to resonant background admixture (supposedly a greater part is due to ). Correction for this resonant background we estimate in the following way. Let be the ratio of the resonant and non-resonant background level. The values of , derived by fitting a resonance curve to energy distributions of background events of the intervals , , and , are well approximated with a straight line. Thus at the value of we obtain
After subtraction of the resonant background one gets:
| (36) |
Obtained in essentially different ways the two values of : (35) and (36) are in a good agreement. As a final result one can choose (35) as the most precise of them and consider their difference as a measure of systematic error of or . After taking into account other known sources of systematics the error estimate increases up to and the final result reads as
| (37) |
It is close to the theoretical value and does not contradict previous measurements.
6.3 Study of the process ,
The Dalitz decay was studied in the reaction (22). The ratio of probabilities of the Dalitz decay and the two photon decay of meson is given by the following expression[12]:
where is a invariant mass, - -meson transition form factor. The main contribution is given by small , where . The expected branching ratio is: .
This decay was measured in only one experiment [37], where in two successive papers the results differ by a factor of 3. We believe, that our measurement could clarify the situation with this decay.
Data analysis
The following event selection criteria were used :
positive charged event trigger;
; ;
; ;
; ;
, ;
;
the events with invariant mass of photon pairs
close to masses of mesons
;
;
are excluded.
;
recoil mass of one photon is close to
meson mass in the decay :
;
.
After application of these selection criteria 60 events survived. We estimated their origin in the following way:
| Experiment (total) | 60 |
|---|---|
| Contribution from the process | 35 |
| Contribution from the process | 0.5 |
| Contribution of the process under study | 24.5 |
Taking the efficiency from simulation [12], we have
The energy dependence was fitted by the sum of QED non-resonant background and resonant contribution from the decay under study (fig.9). The following fit result was obtained . The systematic error was estimated to be about . The final result is:
The result obtained in this work is in good agreement with the PDG value [11] and with the prediction . The accuracy of our measurement is close to the world average value[11].
6.4 Search for the decay
Radiative decays of vector mesons , where is a scalar or pseudo-scalar state, is an important source of information on the structure of these states. For only main decays [15] were studied by now at a relatively high level of accuracy of . Regarding rarer decays like , even the latest data [16], [10], [17] are still preliminary and have rather low accuracy.
The decay was observed in the only experiment with CMD-2 detector at VEPP-2M collider [17] with a branching ratio of . The quark model prediction for this value [18] is under assumption that there is no gluonium component in . In case of consisting of pure gluonium, the expected branching ratio of the decay would be 4 [19].
In this work the decay was studied. The pseudo-scalar final state could appear from the decay of (958) or from states with higher masses and large widths like (1295) or (1440). The expectation for the branching ratio, based on quark model predictions [18], is .
The selection criteria In this work the reactions (3) and (4) were studied, both producing a 7-photon final states. The main background comes from the -meson decays (5) and (6).
Sel.1 – event configuration does not contradict energy and momentum conservation: . This requirement suppresses the background from the process (6).
Sel.2 – the energy of the most energetic photon in the event . Fig.9 shows, that such a threshold almost completely rejects the background from process (5), although the detection efficiency for the process (4) becomes twice smaller.
Sel.3 – the transverse spread of each shower in the calorimeter does not exceed certain standard value, characteristic for individual showers . This cut suppresses the background events from the process (6), where some close photon showers merge together.
Sel.4 – among all photon pairs in the event, three meson candidates must be found: two -mesons with the effective mass and one -meson with . Analysis of simulated events of process (4) showed, that the pair of most energetic photons in the event is produced by decay. This fact significantly reduces combinatorial background in the search of and candidates in the event.
Sel.5 – the effective mass of -system is close to mass. The obtained mass spectra of for simulated events of process (4) is shown in Fig.9.
The data analysis. The decay detection efficiency with respect to all events of this decay was obtained using simulation of the process (4) with the selection criteria Sel.1 — Sel.5. Corresponding efficiency with respect to events of the process (4) with exactly 7-photons in the final state is much higher 9%. Among all experimental events =3 were found, satisfying selection criteria. They are shown as black triangles in the scatter plot Fig.11. The vertical axis of the plot depicts the effective mass of the found (550) meson, while the horizontal axis shows its momentum. After the additional cut on (550) momentum two experimental events survive. Simulated events of the process (4) are shown in the Fig.11 as circles. One event, shown as a square, was found in the analysis of the simulated background sample. The estimated detection efficiency for this background is close to .
In the analysis of 4.7 simulated events of the reaction (6) no events of decays, satisfying selection criteria Sel.1—Sel.5 were found, but one should take into account, that simulation statistics is 5 times smaller than the experimental one. Because the simulation is not precise, certain contribution of the process (6) into the sample of two selected experimental events cannot be completely excluded.
Both found experimental events correspond to a collider beam energy near (1020) maximum, which confirms their resonant origin. If both events originate from the process (4), the branching ratio would be equal to (. But as it was pointed out above, the background origin of these events from processes (5) and (6) could not be excluded. Thus only upper limit on the branching ratio of the decay (4) could be reliably established. At a confidence level of 90% it is equal to
| (38) |
where coefficient comes from Poisson distribution of observed decays [11].
To check the whole procedure on possible systematic errors we studied another decay chain (5) with a similar 7- final state. Its probability is known and could be compared with an obtained value. The selection criteria Sel.1Sel.3 were imposed. In addition it was required for each selected event to contain three candidates. We found , that is 18% lower than the table value. Such large discrepancy could be attributed to excessively stringent selection criteria Sel.1Sel.3, used in the search of process (4). Now we can correct the detection efficiency obtained using simulated events by 18% down to a value of , and use it within the expression (38) as an experimentally obtained detection efficiency.
In search for the process (3) without any assumptions about its dynamics the cuts Sel.1—Sel.4 were applied. The detection efficiency was determined from a sample of simulated events of the reaction (3)with the matrix element similar to that of the process (4) and effective masses of system ranging from 850 to 1000 MeV. The obtained value of is nearly constant in this effective mass range and equals to 3% with the correction described above imposed. In the experimental sample =3 events were found, one event was found in simulated sample of background process (5) and none were found in the simulated sample of (6). After formal background subtraction the estimated the number of events from the process (3) is . Given such a small number of events and not reliable estimation of background, only upper limit of the branching ratio can be placed using the expression (38):
.
Conclusion. In the analysis of 7- events the following upper limits at confidence level were placed:
(incl.).
6.5 Observation of the decay
The result of the first measurement of branching ratio in , decay mode with the CMD-2 detector at VEPP-2M [17] is . At the same time in SND experiment only upper limit was obtained [7] in another decay mode: , : at 90% confidence level.
This work is devoted to the search for the
decay in the decay mode
, ,
(23).
The background processes are the following:
, (32);
(31);
(25). The main problem in search for (23) is,
that the process (32) has the same final state,
while its cross section is two orders of magnitude higher.
Processes (31, 25) give similar signatures
and could contribute to the process under study.
Event selection.
Full statistics of 7 scans was analyzed, corresponding to
the production of mesons.
The expected numbers of experimental events as well as numbers of
simulated events are listed in the Table 2.
| Process | Expected number of experimental events — | Number of simulated events — | |
|---|---|---|---|
| 830, at | 9996 | 0.083 | |
| 104580 | 368176 | 0.284 | |
| 75000 | 17.3 | ||
| 33784 | 1.12 | ||
| 24991 | 163 | ||
| 194551 | 14.5 |
The following cuts were applied for the preliminary event selection:
charged particles trigger;
; ;
; ;
;
; ;
; ;
;
.
The cut on allows to exclude the background process
, ,
and possible background from
Bhabha scattering and higher order QED processes.
21103 experimental events passed these cuts:
The analysis of the kinematics of the reaction (23) shows, that the photon from the radiative decay always has the smallest energy , while the energy of photons from the decay lies in the interval . In the process (32) the radiative photon has a maximum energy , while the energy of photons from the decay lies in the interval . It should be mentioned, that a probability for photons to reach the boarders of mentioned intervals is small due to the phase space suppression. Hence, there is almost no combinatorial background for these processes, even taking into account the finite resolution of the detector.
In Fig. 11 the distribution of 11239 experimental events over recoil mass of the most energetic photon is shown. It was obtained with the additional cut ( meson mass resolution is equal to ). The clear peak on mass from the process (32) is seen together with a broader distribution from the processes (31, 25). Fitting the data by the sum of Gaussian distribution and 7-th order polynomial one could estimate the number of events in the peak . The order of polynomial is not important, if the mass range is limited to . The detection efficiency is equal to . It leads to the branching ratio , where the error is a pure statistical one. The obtained result is only 5% smaller than the table value [11], confirming validity of our analysis and absence of significant systematic errors. With additional cut, excluding meson , the peak at mass vanishes. So to exclude the events of the process (32) the cut
was imposed, where each denominator is equal to three times the
resolution () for corresponding meson mass.
In order to reach more effective suppression of background events,
the characteristic kinematic features of the investigated process were used:
the sum of three photons energy exceeds ;
the photon energy from the decay
exceeds . For 16512 experimental events the distribution
over the energy deposition of neutral particles and over the
reconstructed energy of the 2-nd photon is shown in Fig. 13
and Fig. 13 as well as estimated contribution of background
processes. These figures show that the processes (31) and
(25) are dominant. To reduce their contribution the following cuts
, ,
were applied, shown by arrows
in Fig. 13 and Fig. 13.
A cut ensuring the quality of photon showers in calorimeter was also
used
.
367 events passed the cuts listed above.
A scatter plot of invariant masses of photon pairs
, and
(for example see Fig. 14)
shows a concentration of events along
the lines corresponding to masses, which also confirms their
background nature.
To exclude events of this kind the cuts
,
were added. Second of these cuts simply tightens
the condition, used for
event selection of the decay .
Scatter plot of 28 remaining experimental events in recoil mass of the photon with minimal energy — versus invariant mass of pair of most energetic photons — is shown in Fig. 15d. The same distribution of simulated events for searched and main background processes is shown in Fig. 15a,b,c. Numbers of simulated events are not normalized. In order to display contributions from the processes (31) and (25), events in Fig. 15c were selected without the cut on parameter.
Projection of two dimensional plot on the axis is plotted in Fig. 18. Calculated contribution from the process (23) at , as well as the main background process (32) are plotted in Fig. 18. Besides the peak at mass, background events of the processes (31) (25) form the peak at mass.
In Fig. 18 the second projection of two-dimensional scatter plot on the axis is shown with additional cut . The peak at mass is observed, confirming the existence of the decay. Histogram and smooth curve show distribution of 14 experimental events and its optimal fit by the sum of linear function and Gaussian with fixed parameters: and , obtained from simulation of the process (23). Hatched histogram and dashed line show the estimated contribution from the background process (32) and its approximation by the linear dependence. One can see, that the difference in the background estimation from experimental data and simulation does not exceed 0.6 events in the interval (2.6 and 3.2 events respectively). The number of useful events in the peak equals to . The detection efficiency of the final state is equal to . Taking into account table values of and [11], we obtain
| (39) |
which is nearly twice lower than CMD-2 result [17], but does not contradict it because of large error in both measurements.
6.6 Study of the decay
Search for decay was first carried out in the ND experiment at the VEPP-2M collider in 1987 and the upper limit [20, 15] was placed. As it was shown later by Achasov [21], study of this decay can provide a unique information on the structure of the light scalar meson. Subsequent studies [22, 23, 24, 25, 26, 27, 28] proved this idea. In these works different models of the -meson structure were considered. The most popular were two-quark model [29], four-quark model [30], and a molecular model [25].
In 1997 the first indications of the process (1) were reported by SND [10]. In this work the results of analysis of full statistic of this experiment are presented. Main resonant background to the decay (1) comes from the neutral decay (5) due to the merging of photons and/or loss of photons through the openings in the calorimeter. The main source of non-resonant background is a process (9). The background from the decay turned out to be small [24, 31], nevertheless, its amplitude was taken into account in the simulation of the process (9). The background from the QED 5- annihilation process was found to be negligible.
In order to suppress the contribution of background
the events were selected satisfying the following
criteria:
; ; ;
; ;
;
.
Parameter facilitates efficient
separation of the events with well isolated photons from the
events with merged photons or those produced by mesons.
The decay
can contribute due to nuclear interactions
of mesons in the material of the calorimeter but after
described cuts it is not seen at present level of statistics.
The ,
kinematic fit parameter, describes the degree of
energy-momentum conservation in the event
with additional
requirement of presence of two mesons. During this fit all
possible combinations of photons in the event were checked in a search for
invariant masses and , satisfying the condition
.
In the energy region of this experiment the invariant mass of the
pion pair in the process (9) is less than . In the events,
selected under this condition the clear (782) peak is seen
in distribution (Fig. 18), proving
the domination of the process (9) in this kinematic region.
The parameter was defined as an invariant mass of the
recoil photon and one of mesons, closest to the mass of meson.
The 499 events found in the invariant mass region
were assigned to an
class. 189 events with outside this interval and
were assigned to the class.
Subtracting calculated contribution of the process (1) and
using estimated probabilities of events misidentification for
the processes (1) and (9) the number
of the events of the process (9) in the
class were estimated to be equal 449.
The corresponding number of events of the decay (1)
in the class is 164.
The background from the process (9) was estimated using events
of the class, no additional knowledge of
the actual production cross section of this process was necessary.
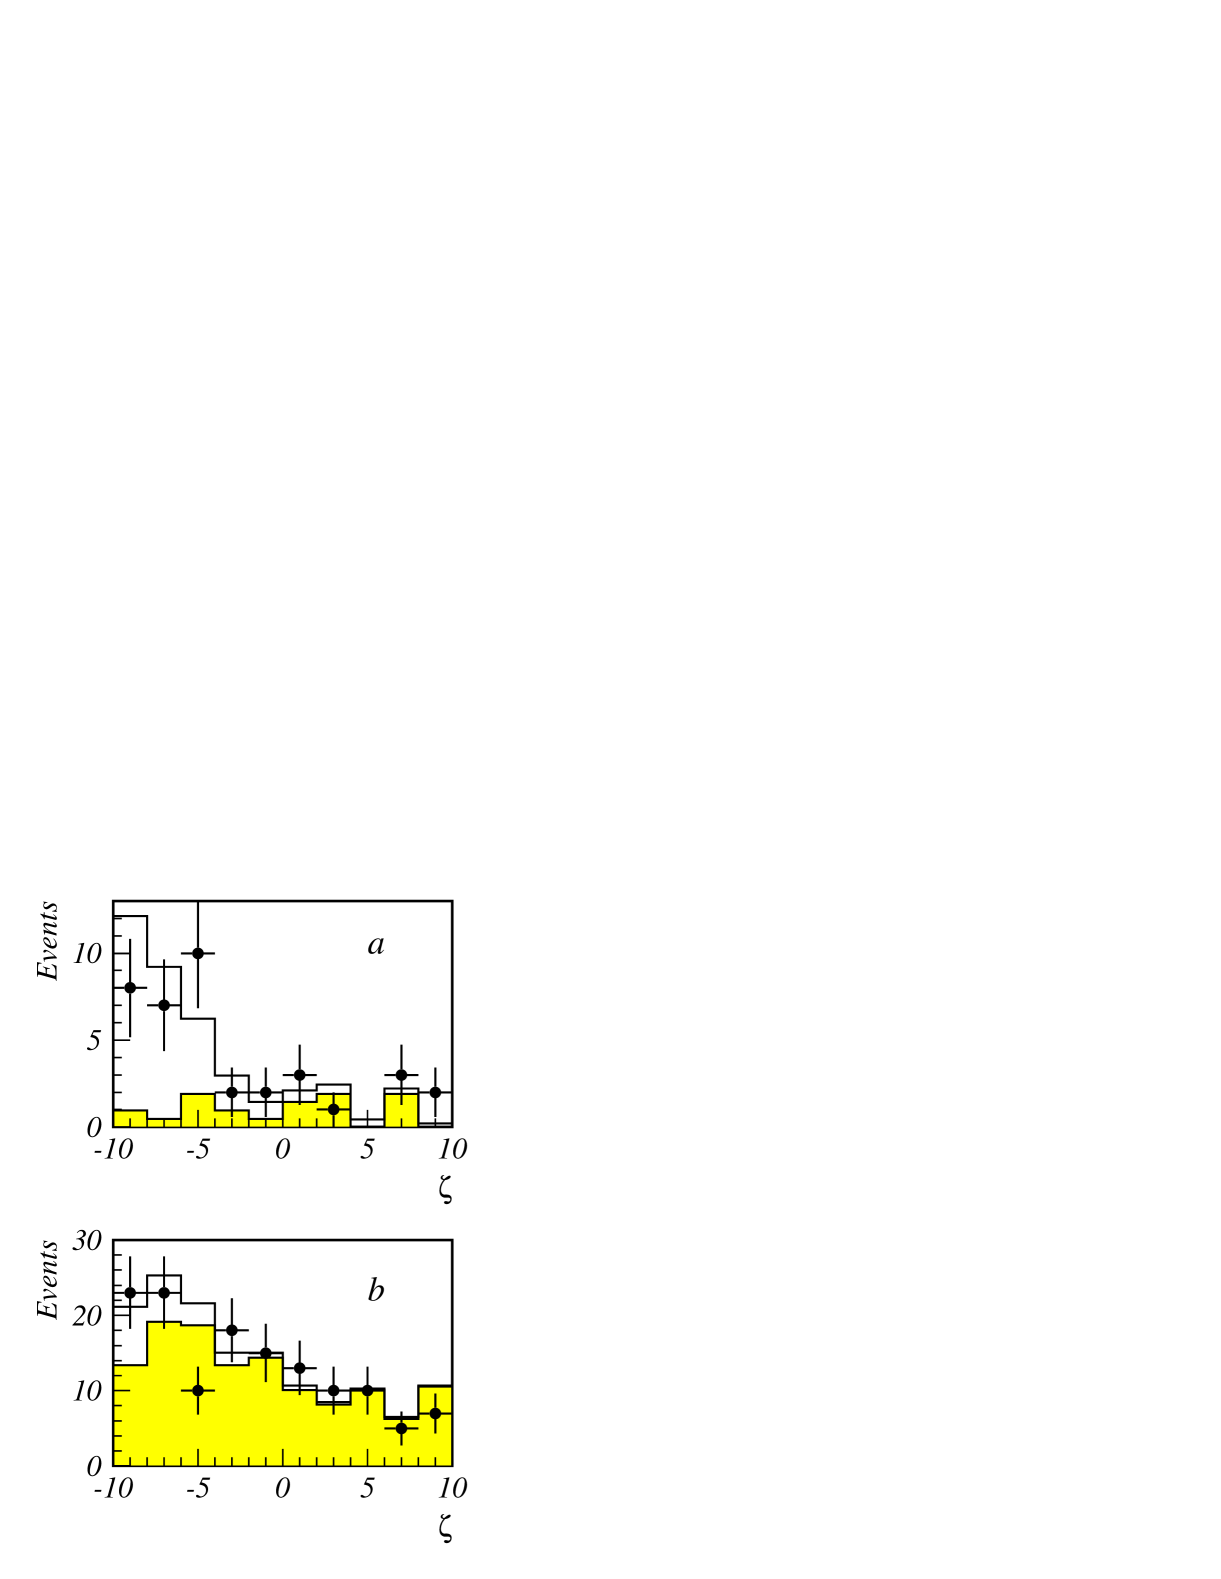
Then, for the events of the and classes the comparison of experimental and simulated distributions in and angles was made. Here is an angle between the recoil photon and the direction of pion in the two-pion center of mass reference frame, is an angle of the recoil photon with respect to the beam. As it is known, the distribution in for class is proportional to and is uniform in . The comparison (Fig. 19a,c) shows, that in this class of events pions are actually produced in scalar state. On the contrary, the experimental events of the class (Fig. 19b,d) also well match the hypothesis of the intermediate state with quite different distribution.
The invariant mass distribution of the events with outside the interval (Fig. 23a) shows significant excess over background at large . At the sum of background contributions dominates. Detection efficiency (Fig. 23b) for the process (1) was determined using MC simulation of the process with a scalar states , with different masses ranging from 300 to and zero width. In addition, this simulation provided information on invariant mass resolution and event misidentification probability as a function of . After background subtraction and correction for detection efficiency the mass spectrum was obtained (Fig. 23). For masses in the interval the invariant mass resolution is equal to , so the bin size was chosen. At higher masses the resolution improves, reaching at , thus the bin size of was used for higher masses.
For the spectrum normalization the events of the process (5) with 7 photons in the final state and reconstructed mesons were analyzed. All other selection criteria were the same as in the present analysis. The number of observed events of the process (5) together with the PDG Table value for [11] provided independent estimation of the total number of mesons produced. Such an approach minimizes systematic errors corresponding to inaccurate simulation of tails of distributions over parameters, used for event selection. The measured branching ratio of the decay (1) for the restricted mass range is equal
| (40) |
and for
| (41) |
Here the first error is statistical and the second is systematic, which was estimated to be close to . The systematic error is mainly determined by the following contributions:
-
•
the background subtraction error, which decreases almost linearly with the increase of invariant mass and is on average;
-
•
error in the detection efficiency estimation, which increases with and is equal to on average;
-
•
systematic error in is equal to .
The invariant mass spectrum was fitted with a smooth curve (Fig. 23) according to Refs.[21, 31] and further used for simulation of the decay (1). As a result the detection efficiency of the process (1) was estimated for invariant masses within the . This efficiency was used in the fitting of the -resonance excitation curve. The cross section was described as a sum of the processes (1), (5), and (9) with radiative corrections taken into account (Fig. 23). The background due to the process (9) was estimated by fitting the detection cross section of the events of the type. The background from the process (5) was obtained from simulation. The beam energy spread and the accuracy of the beam energy determination were also taken into account during fitting [7, 10]. As a result, the following value was obtained:
| (42) |
which, in contrast with (40) and (41), is valid for the whole mass spectrum. In the systematic error estimation the following considerations were taken into account. In comparison with the results (40) and (41) the accuracy of normalization and efficiency estimation are higher here, the background subtraction error is the same, but an additional systematic error of exists, due to uncertainty in extrapolation of the invariant mass spectrum into the region . Smaller systematic uncertainty has a ratio of branching ratios:
| (43) |
Assuming that the process (1) is fully determined by mechanism, using the relation , and neglecting the decay [21], we can estimate from (42)
In the invariant mass spectrum in Fig. 23 the -meson peak is clearly seen. The visible peak position is close to , with the width about . The analysis of our preliminary data together with other already known properties of the meson, performed by N.N.Achasov [32], permits to assume, that the 4-quark component constitutes a large part of the meson. Actually, the observed decay probability about together with the invariant mass spectrum (Fig.23) can be only due to quarks constituting noticeable part of the meson. The results of the fitting of the mass spectrum, performed using formulas from Refs.[21, 31], are following:
The systematic error in mass is determined by the detector resolution. Although the values of the constants are strongly model dependent, their ratio is almost model independent. The value of the coupling constant obtained from the fit agrees with the predictions of 4-quark model , but contradicts the value predicted by 2-quark model and by almost 3 standard deviations higher than molecular model prediction: .
Of course the more complex mechanism of the decay under study cannot be excluded, e.g. contribution of the heavy and broad state [31]. But such a state can probably produce a smooth invariant mass spectrum, not masking resonance signal from the meson in the mass region To take into account all mechanisms of the transition one have to perform a simultaneous analysis of all data within the framework of one model.
In conclusion we would like to emphasize that the radiative decay was observed for the first time and its branching ratio was measured. It was shown, that the transition mechanism dominates in this decay. Invariant mass spectrum of system and the rate of the decay give grounds to the assumption of 4-quark structure of the meson.
6.7 Search for the decay
The decay can be described as a radiative electric dipole transition from a light vector meson state into a scalar state like (980) with emission of a photon. Although electric dipole transitions are common in radiative decays of heavy quarkonia, only few were observed in the light quark mesons and none of -meson. Since even lightest known scalar resonances are quite heavy, the energy yield in the decay is low () leading to a small phase space for a photon. A number of estimations exist on the branching ratio in different models [21]. Since the values strongly depend on the quark structure of the scalar intermediate state, the decays of this type could be a unique probe of the structure of light scalar mesons. It was suggested, that the decay proceeds mainly through the intermediate state and the decay probability is determined by its structure. At present the structure of meson it is not well established and several theoretical models exist, including simple two-quark model, molecular model, different 4- quark schemes. The values of branching ratio calculated in these models vary in the range of , making the decay a good probe of the inner structure of the state.
Because of great significance of the decay, two independent analyses were made. The results obtained are described below.
6.7.1 Analysis 1
The main background sources for the process under study (2) are the following -meson decays: (1), (5), (6) and non-resonant process (9).
The expected number of events of the process (2) at a branching ratio of is about 300, while the number of background events (5) is . Although this process does not produce 5- final states, the topology of the process (2) could be faked due to merging of close photons and loss of soft photons through openings in the calorimeter. Total statistics of the process (6) is events with decays. The -s produced in -meson decays are slow and their decay length is about 3 m, while the nuclear interaction length in NaI(Tl) is about 30 cm. Characteristic feature of fake 5- events produced by decays due to either nuclear interaction of -s or their decays in flight is an energy-momentum imbalance and poor quality of at least one photon in the event.
Primary event selection was based on simple criteria (5.1) for - final state. Such criteria greatly reduce background from the processes (5) and (6), not affecting the decays (1, 2), and (9).
Next step in the event selection was based on photons quality parameter and kinematic fit parameter . The requirements were imposed that , for all photons. Then kinematic fit was performed under the assumption, that selected events are ones and corresponding parameter , describing the likelihood of this assumption was calculated. Events with were also rejected. Study of simulated events of true processes (1, 2) and (9) shows, that the and cuts reject less than of true events while suppressing the process (5) by a factor of 3 and making the expected background due to the process (6) very small, of the order of 10 events. It should be noted, that in contrast with other background processes the simulation of the process (6) is much less accurate due to nuclear interaction of , and data analysis may not exclusively rely on this estimation.
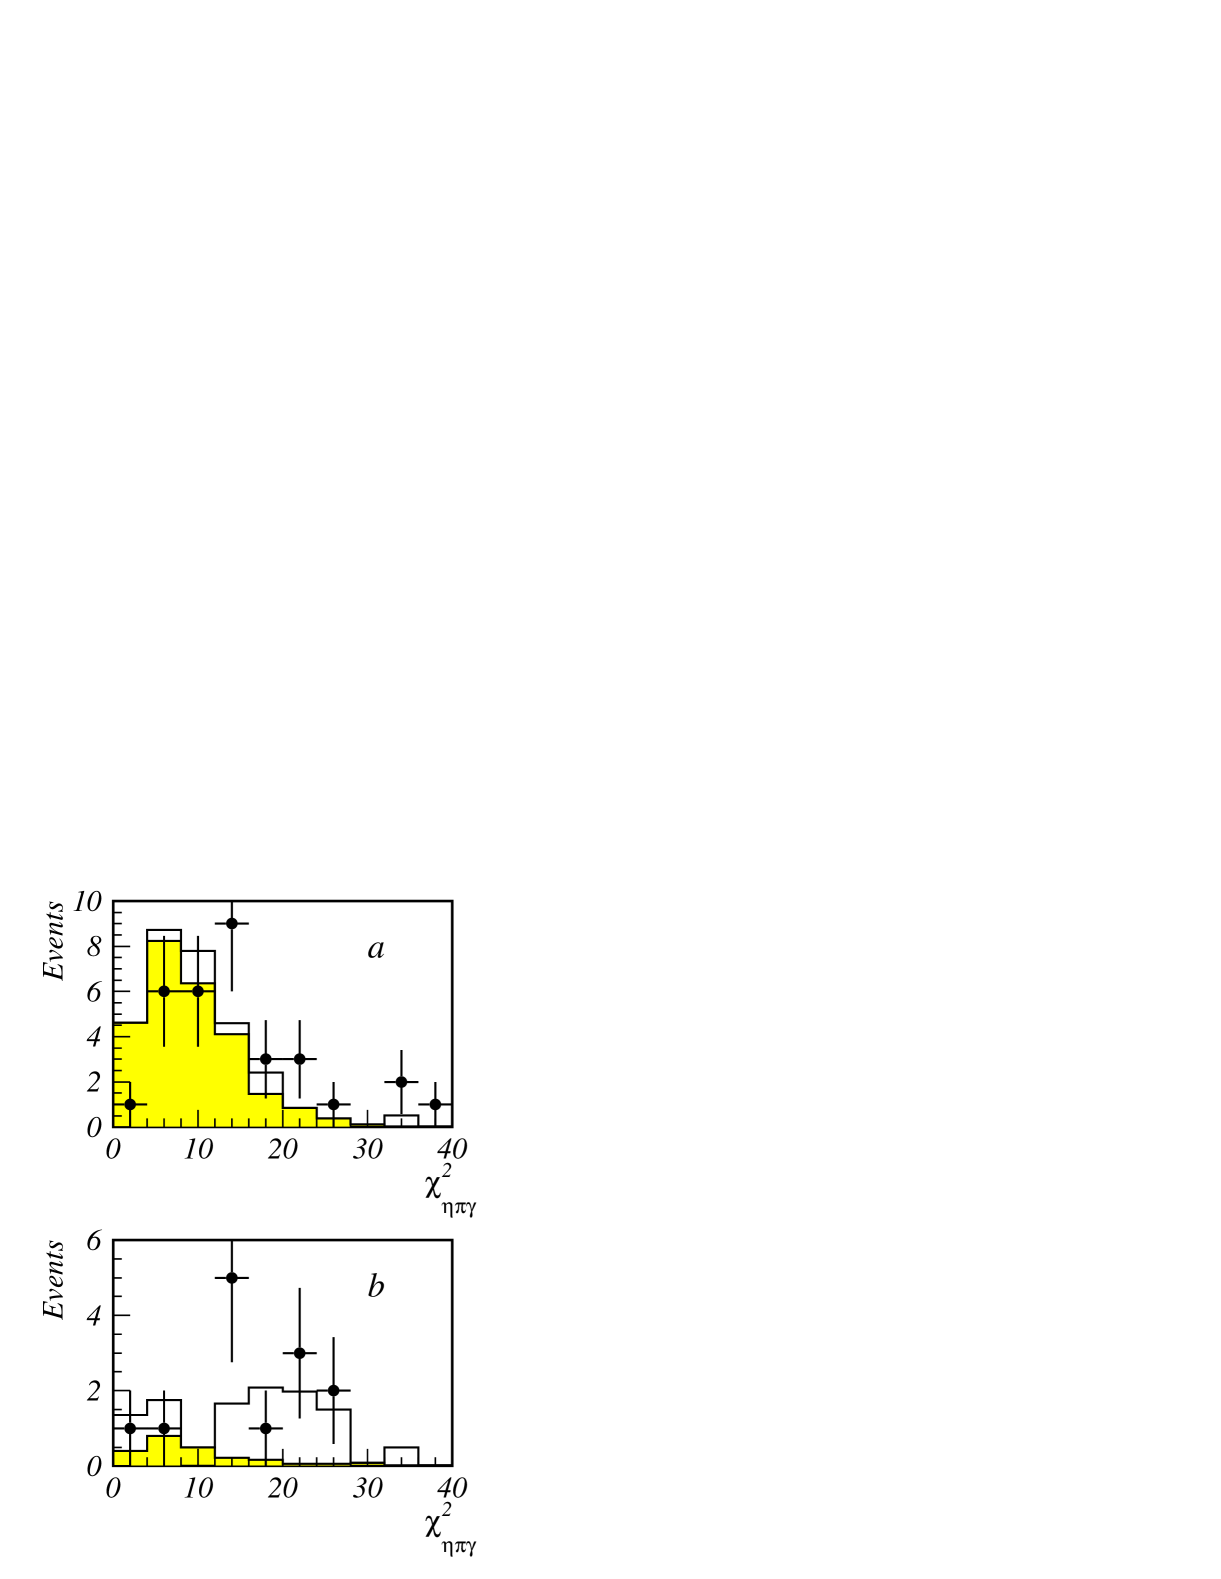
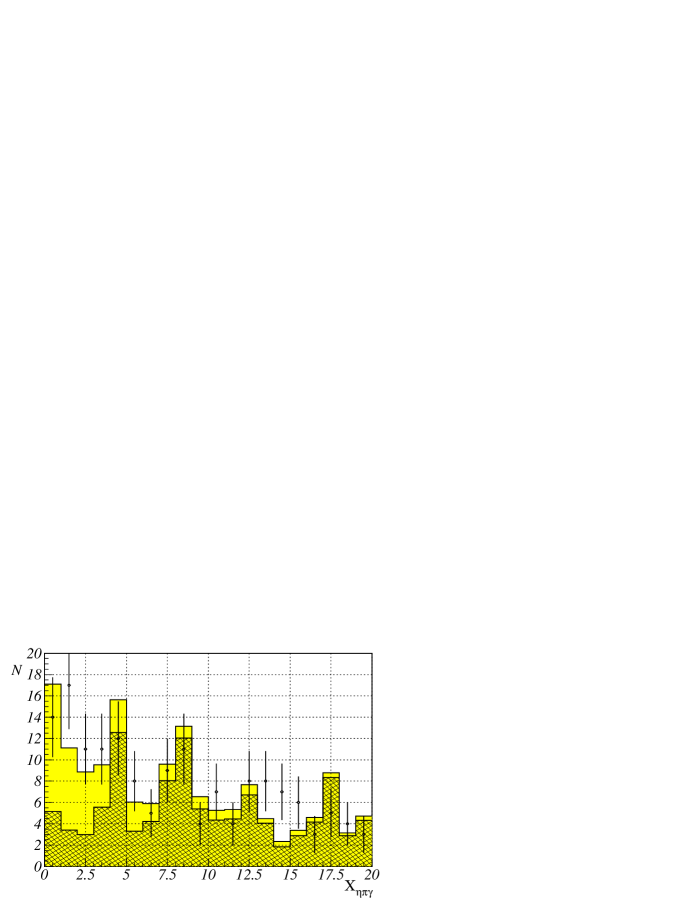
Characteristic feature of the process (2) is that its events must contain two photon pairs with invariant masses of and mesons. Simulation shows that if the energies of photons in an event are enumerated in descending order in energy, the photons from decay have the numbers of either 1 and 2 or 1 and 3. Corresponding experimental and simulated distributions in and with an additional requirement, that the rest of photons contain a pair with and more stringent photon quality requirements . are shown in Fig. 23. Background estimations are based on PDG table value for decay branching ratio [11], our study of reaction and decay [7]. Distribution of experimental events in shows an enhancement centered at -meson mass, while sum of background processes is nearly flat in this region. The sum of all simulated background processes, where each one was normalized to the number of events expected for a given integrated luminosity and total number -meson decays, describes the spectrum outside the enhancement quite well. If this enhancement is due to the decay (2), its branching ratio should be of the order of , but it is not possible to extract more accurate result and error estimates from these inclusive spectra, because of poor signal to background ratio and decay dynamics remaining obscure.
Detailed study of the process (2) requires considerable suppression of background. It was done using kinematic fit with intermediate and mesons taken into account. For each event and hypotheses were tried and corresponding , and calculated. To suppress the processes (1) and (9) the following requirements were imposed: , , and for additional suppression the process (5): . With these requirements, the contribution from the processes (1) and (9), which are themselves relatively rare becomes negligible.
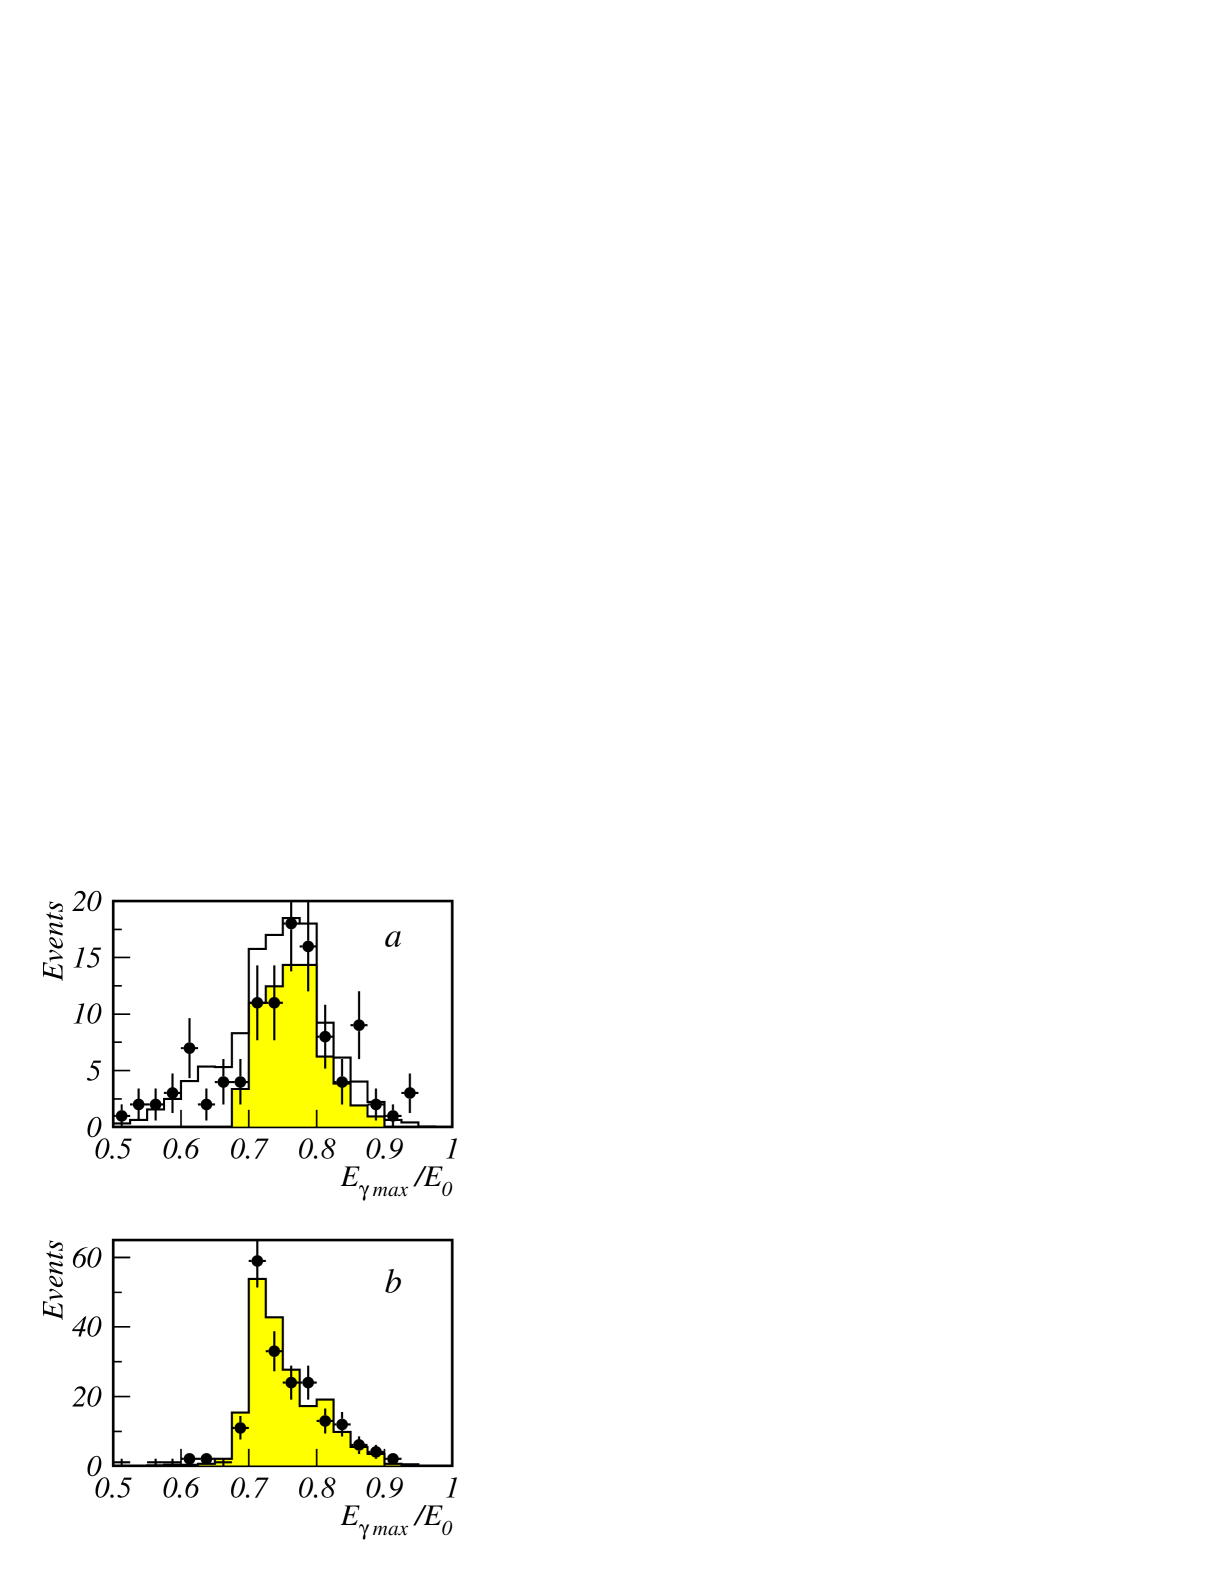
The resulting spectra of the , energy of the most energetic photon, are shown in Fig. 25. Since the recoil photon in the process (5) has a narrow spectrum close to 360 MeV, must be more than 0.7 in this decay. This can be seeing in Fig. 25. While the spectrum in Fig. 25b is well reproduced by simulation of the process (5) alone, the spectrum in Fig. 25a shows excess of events over the simulation of (5). Absence of corresponding excess in the Fig. 25b indicates, that additional events are true 5- ones, because the cut suppresses the number of such events by an order of magnitude. In the event sample with , the background (5) still dominates at , so further analysis was conducted with events where was less than 0.7, where contribution of (5) is small. From Fig. 25a one can see, that this roughly halves the detection efficiency for the process (2) and enhances its dependence on the invariant mass. The detection efficiency varies from at to at .
The distributions of the events over photon quality parameter are shown in Fig. 25. Selection criteria here were the same except the less stringent requirement on photon quality: . It can be seen, that simulation well describes the background from the process (5), while the excess of events in Fig. 25a at low is compatible with existence of the decay (2) with BR of the order of . Additional information could be obtained from the distribution in (Fig. 27). The distributions of good events with and background with do not contradict the simulation. The enhancement at low for good events is clearly seen. The number of selected events is 25, from which 5 were estimated to be a background. The corresponding branching ratio was calculated using the invariant mass distribution of the selected events and detection efficiencies, obtained from simulation. The resulting value is , where error is a statistical one. For such stringent selection criteria the systematic error in detection efficiency could be as high as , but at present level of experimental statistics the statistical error dominates.
6.7.2 Analysis 2
In the decay we consider 5- final
state with the following selection cuts :
; ; ;
; ;
; .
The main background processes (5), (6),
(9) and (1) have 5 photons final state
with two . For supressing this background
besides the cut two additional cuts were applied:
1 – – event is not consistent
with hypothesis,
2 – – the kinematics of the event is
not consistent with the hypothesis.
All experimental events, that passed the selection cuts above, contained
at least one -meson candidate.
Among other three photons not included into
, the pair of
photons with invariant mass closest to that of meson, was chosen
(Fig. 29). The visible excess of events close to -meson mass
could be considered as an evidence of the decay .
For the background
estimation we used events in two intervals of :
and outside this interval:
or
.
104 experimental events were found outside -mass interval and 96 simulated events from background processes (5), (9). Their ratio is equal to . Taking into account this value and the detection efficiency of 7.2%, we obtained .
Then the following cuts were applied: , , . Fig.29 and 33 show the distribution over for the cut , and over the parameter for the cut respectively. It is seen that at the small values of and there is a considerable excess of experimental events (78) over the expected background ( 34 for the background process (5) and 4 for (9), while in the region and the experimental events number is in agreement with the expected background. Taking into account the selection efficiency of the process under study in the region and (4.5%) we have: .
For more accurate background estimation, the events, satisfying the cut and , were divided into 4 classes (table 3).
| 78 | 38 | |
| 58 | 27 |
The c.m. energy dependence of the cross section in each of 4 classes, was approximated by the sum of the cross section of the process under study, background process (5) with coefficient and nonresonant background. The expected distributions over all main parameters (, ) in each class of events were obtained from simulation. Only distribution for the process under study was derived from experimental events of the process (1). The fit results obtained are the following:
| (44) |
where is the ratio of found cross section of the process (5) to the expected one. Nonresonant background was found to be negligible. Fig.33 shows the distribution over invariant mass , corrected for detection efficiency dependence on the invariant mass. The errors indicated include statistical errors and error in background estimation. The fitted curve [21] is indicated by solid line. The accuracy of our measurements is not enough to obtain the coupling constant . Its value was set to ([21]). As a result of the fit the following parameters were obtained:
| (45) |
6.8 Evidence of the decay
Recently in experiments with SND and CMD-2 detectors at VEPP-2M the study of meson rare decays with branching ratios of became possible [16, 7, 17]. One of the decays this kind of decays is OZI and G-parity forbidden decay. The expected branching fraction of this decay is of order of [33, 34]. Predictions vary in wide limits depending on the nature of , , mixing and existence of direct transition. Because of the significant cross-section of the non-resonant reaction in the vicinity of -resonance, the decay reveals itself as a narrow interference pattern in the cross section energy dependence. This allows to determine from the data both the real and imaginary parts of the decay amplitude. The decay was not observed by now. In our preliminary study [16, 7] only an upper limit of the decay probability was established at . The present work is based on full statistics of PHI-96 run and part of the data from PHI-97 run at the energy points 980, 1040 and 1060 MeV. The total integrated luminosity is , corresponding to -mesons produced.
Events selection. For search of the decay we studied the cross section of the process (25) in the vicinity of the resonance. The final state consists of 2 charged particles and 4 photons. Unfortunately, in addition to 4 produced photons, we found in selected events with the probability of 20% one or two faked photons. So, for analysis we selected events with 2 charged particles and 4 or more photons. The reconstructed production point of charged particles should be within 0.5 cm from the beam and 7.5 cm from the center of the detector in the beam direction (the interaction region length is about 2 cm).
Because of the large probability of faked photons production
virtually all main -meson decays are a potential source of background
in the search for decay. To suppress
the background from the decays
(28),
(29)
the following selection criteria were applied:
;
Ionization losses of charged particles
are close to those of minimum ionizing particles.
The first condition suppressed events from the process (29), where minimum angle between pions from the decay is , and considerable number of events from the process (28), where charged kaons produce two collinear tracks. Part of events of the process (28) survives this cut due to decay or nuclear interaction of one of the kaons in the material of the beam pipe or drift chamber shell. Remaining charged kaon due to its low velocity has high dE/dx in the SND drift chamber, allowing to reject these events using separation parameter ) (Fig. 33).
In the kinematic fit the energy-momentum balance and masses of intermediate
particles () were included. Three following
hypotheses of the event origin were considered for each event:
The event originates from the process .
The value of likelihood function is .
The event is from the process
.
The photon recoiled mass
was calculated.
The event is due to the process
The value of likelihood function is . The recoil mass of
mesons was calculated and one
closest to meson mass was chosen.
In case if number of found photons was greater than that in considered
hypothesis, extra photons were rejected as fake photons. To do that,
all combinations were considered and one was left with a minimum value of
likelihood function. The same approach was applied in search
for the best candidates among all possible photon pairs in the event.
The distribution of
experimental and simulated events from the process (25)
over the parameter , is shown in Fig. 33.
One can see a considerable contribution from process (31)
as a peak at low values of . Fig. 37
shows the experimental spectrum over , where clear peak
of meson from the reaction (32) is seen.
To suppress the background from processes (31) and
(32 the following cuts were used:
,
.
Data analysis. Fig. 37 shows the distribution of experimental and simulated events from the process (25) over . The considerable difference between the “tails” of measured and simulated spectra is a sign of background, which survived the cuts. In Fig.37 the distribution over recoil mass is presented for experimental events with , simulated events of the process (33) without intermediate state (the model was used) and simulation of the process (25) with 7% addition of the process (33). The last distribution is in a good agreement with experimental data.
For further analysis all events were divided into 4 classes:
-
1.
, ;
-
2.
, ;
-
3.
, ;
-
4.
, .
The visible cross section for each class was fitted using the following formulae:
where , is a nonresonant cross section of the process (25) at , – its slope, – the detection efficiency of the process (25) with and , – complex interference amplitude, – meson mass and width, – -meson propagator, – the branching ratio of the decay [11], – radiative correction [35], – the visible cross section of the process (33), – the visible resonant background cross section for -class selection, and – the probabilities for events from processes (25) or (33) to be found in the -class.
The fitting was performed for all 4 classes simultaneously. The class 1 with a small resonant background, was the most important for evaluation of , , parameters. Classes 2-4 were used to determine the background from -decays , , . It was suggested in the fit, that for resonant background the distribution over does not depend on , and for class 1 the background can be obtained from the expression: . The cross section of the resonant background in the resonance maximum was found to be , what was about 4% of the visible cross section (25) in class 1.
The contribution of the process (33) was determined from the ratio of nonresonant cross section for events in the intervals and of the -meson mass. The value of the cross section (33) was found to be % of the cross section (25). With the chosen cut this contribution was suppressed down to .
The chosen selection criteria suppress resonant background, but decrease the detection efficiency of the process (25). In addition, the tracking in the drift chambers and nuclear interaction of pions are simulated imprecisely. Therefore, the detection efficiency, obtained from the simulation, was corrected in three ways. First, we processed the data with softer cuts on the parameters and , second, we studied a class of events with 1 charged and 4 photons outside the -peak, and third, we compared the efficiencies under different cuts for both data and simulation. The total correction obtained from experimental data was found to be 12%. It was mainly due to inaccuracy of the simulation of parameter distribution and drift chamber reconstruction errors. The corrected detection efficiency was at . Its value is almost constant in the energy range under study. The systematic error was estimated as 10%. The number of events in classes 1–4 (, ) was obtained in part from simulation or from the fit results. The parameters , of the energy dependence in linear approximation were obtained also from the fit with the constraint, that detection efficiency is energy independent.
The number of fit parameters, describing energy dependence of the cross sections in 4 classes of selected events, was 12. In each class the cross section was measured in 14 energy points. At the following values of main fit parameters were obtained:
| (46) | |||
The visible cross section in class 1 and fit are shown in Fig. 37. Despite 4% resonant background, the interference pattern is clearly seen. The interference amplitude can be presented in the form with
The branching ratio of the decay is obtained in the following way:
where – the cross section in the maximum [11].
To estimate systematic errors caused by possible detector instability during lengthy data taking runs, we processed data from 1 – 3 runs separately from 4 – 6 runs and PHI-97 run. It was found, that all three data samples are well described by the fit obtained above from the whole data.
To investigate reliability of the obtained results (6.8), we changed the cuts: for the parameter we used cuts 50 and 100 instead of 20 and 40, for the parameter we used values 50 and 100 instead of 30 and 60. The detection efficiency increased up to 20%, the resonant background in the maximum was , that is 20% from the visible cross section (25). But the interference amplitude was obtained: , , which does not contradict to (6.8) and thus confirms our procedure of the background subtraction. As a final result we prefer (6.8), because it was obtained at lower resonant background.
Conclusion. Obtained in this work non-resonant cross section of the process is in agreement with our old result [15] for the neutral decay: . Our preliminary result in [7] is by 16% lower, but this deviation is explained by systematic uncertainty in simulation, discussed above. The measured non-resonant cross section exceeds in two times the expected value, where only transition is taken into account. The agreement should be significantly improved with radial excitations, included into calculations. The measured interference amplitude (6.8) is near lower edge of theoretical predictions [34]. But in [34] the known radial excitations of also were not considered. Another important remark is small value of measured real part of interference amplitude , which could hardly be explained by well known mixing model [34]. For example, the predicted in [33] branching ratio of the decay , is 1.5 times higher than measured in this work. The interference amplitude
measured in this work, is of six standard deviation significance. Thus, we claim the existence of the decay with the branching ratio of
6.9 Study of the process
During the study of the reaction (25), the decay was observed for the first time with the branching ratio 6.8. The decay reveals itself as an interference wave in non-resonant cross section of the process . In principle, the similar picture should be observed in neutral channel (9). Really the whole situation here looks more complicated because of other meson neutral decays like , [21], which can create the same final state and interfere with the (9) process. The interference amplitude with the decay is about 10%, which is close to the value 17%, obtained in [7]. In our preceding study of the reaction (25) [16, 7], we did not observe the interference because of small statistics and non-resonant background.
In the present work we studied the cross section of the process (9) in the vicinity of meson. Besides this process, the same 5 photon final state have processes (1), (6), (5),
Some contribution to the background give cosmic rays and particles from collider beams. The events from two photon annihilation with splitting showers also mimic 5 photon configuration, because of its large cross section. The cut imposed on the total energy deposition and total momentum (5.1), strongly suppressed the process (6), the cosmic and beam background and considerably reduced the contribution of the process (5). Two photon events were suppressed by the cut on the the energy of two most energetic photons .
In the kinematic fit the requirement was imposed, that two are found in 5 photon event. The corresponding parameter for experimental events and simulation of the processes (9) and (5) is shown at the Fig. 41. The cut was imposed for further analysis. Then the recoil mass was chosen , closest to mass (Fig. 41). The cut for this parameter was used later. The additional suppression of processes (6) and (5) was obtained with the parameter , describing the transverse profile of the electromagnetic shower (Fig. 41). For events selection the cut was applied.
Analysis of data. The events selected by the criteria, described above, were divided into 7 following classes:
The 6 photon events were put into the last class. It was done to investigate, for example, a possible background from beams, where sixth photon is superimposed on the event. In the fit such a photon was supposed to be spare. In the Table 4 there are shown the probabilities for the process under study to be found in classes, described above.
| Class | ||||
|---|---|---|---|---|
| 1 | 0.591 0.031 | 0.633 | 0.18+0.20+0.00=0.38 | 0.25 |
| 2 | 0.061 0.013 | 0.067 | 0.20+0.18+0.00=0.38 | 0.23 0.11 |
| 3 | 0.069 0.015 | 0.049 | 0.43+0.02+0.00=0.45 | 0.49 0.12 |
| 4 | 0.020 0.009 | 0.012 | 0.37+0.02+0.00=0.39 | 0.36 0.08 |
| 5 | 0.196 0.023 | 0.202 | 1.33+0.11+0.09=1.53 | 1.74 0.23 |
| 6 | 0.042 0.012 | 0.033 | 0.30+0.01+0.00=0.31 | 0.40 0.10 |
| 7 | 0.021 0.012 | 0.006 | — | 1.87 0.16 |
The probabilities for events of the process under study to be found in classes 1–7 are shown in Table 4 as well as the background resonant cross sections, normalized by the cross section. The process (1) was simulated for intermediate state with the branching fraction of . The simulation shows that the signal to noise ratio (S/N) in class 1 is the largest, which was used later for investigation of the process (9). The contribution of the process (9) in the class 2 is about 10 times lower, which allows to extract from the data the resonant background from the processes (1), (6), (5). Using ratio of the resonant background in classes 6 and 7 obtained from the simulation, one can estimate the background in class 1. The ratio of the background processes in the regions and weakly depends on the cuts in and parameters. For the process (1) this ratio varies from 1.09 to 1.12, while for the process (5) — from 0.9 to 1.07. But in the latter case this range is determined by low simulation statistics of the process (5). The coefficient was taken for background recalculation from class 2 to class 1. The classes 3 – 7 were used for estimation of systematic errors, depending on different selection cuts.
The visible cross section in each class was presented in the following form:
where – non-resonant cross section of the process at , – the slope of the cross section, – detection efficiency of the process (9), – complex interference amplitude, – mass and width of meson, – -meson propagator, – the decay branching ratio [11], – radiative correction [35], – the cross section of the process . The parameters mean the probability for the process (9) to be found in the class , the parameters – non-resonant cross section in the class , normalized to the process cross section. The meson excitation curve was described by the main background process . The differences in excitation curves for different processes (6), (5),(1) were neglected at the present level of accuracy. The fitting of the visible cross section was done for all four classes. The parameters , , , , , except were set free. was found from the expression , from normalization . The detection efficiency =, obtained from the simulation, does not depend on the energy. The coefficients are also energy independent. The total number of fit parameters is 16. In each class the cross section was measured in 15 points. The following values of fit parameters were obtained ():
| (47) | |||
One can see from the Table 4 rather good agreement between experimental and simulated parameters , . This allowed to put the total systematic error to 6% for . For other parameters in (6.9) the statistical error is much higher than the systematic one. The visible cross section for class 1 and fitting curve with are shown in Fig. 41. Fitting curves for the visible cross section of the process (9) and for non-resonant background are also shown there. One could see, that in spite of imposed strong cuts in class 1, the resonant background is about one third of interference amplitude wave. It remains the dominant source of systematic error in .
Conclusions. The measured non-resonant cross section of the process agrees with the result from [15] and with the result from [7] in the decay channel with charged pions . The measured interference amplitude is three standard deviations above zero. The measured in [7] interference amplitude in the decay is , . Our calculation of the interference amplitude for the decay gives , . The sum of these contributions , agrees with our measurement. We did not make a theoretical estimations of the contributions of the processes into interference amplitude. Finally we list parameters of the cross section, obtained in the present work:
6.10 decay search
This decay is a pure CP-violating one, similar to those of and unlike mode, where C-conserving amplitude could be present. Considering the model, where CP-violation originates from the mixing of CP-even and CP-odd states and , it leads to physical state , and the branching of depending on : Very small magnitude of the branching ratio and experimental problems with separation between this decay and background from the process , which has a 9 orders of magnitude higher probability, result in rather high existing experimental upper limit: .
Analysis. In the present work the decay with a total is used as a source of . Our analysis is applied to those events, where leaves the detector without either interaction or decay. simulated events of and simulated events of were processed in the same way. Because the initial decay was not simulated, the calculations take into account the branching ratio [11] and the probability for to leave the detector undetected. The latter value cannot be obtained from simulation due to its low accuracy in nuclear interactions of mesons, so it was estimated to be from the experimental data on decay.
The following criteria were applied to the experimental
data and simulation sample for decay search:
;
;
positive neutral trigger;
;
;
;
.
The hits in the first two layers of the calorimeter
are required.
The kinematic fit was done for the selected events,
in assumption of kinematics.
The output parameters within the limits shown below
were the following:
for the found combination satisfying
decay hypothesis;
minimal angle between photons of the decay
and beam axis ;
polar angle of reconstructed
;
raw invariant masses of three ’s:
.
For the selection of the process
the following criteria were applied:
;
positive neutral trigger;
;
;
;
.
The cut
selects a
slanting stripe in the
(, ) plane, containing most of the
events with tagged (Fig. 63).
The kinematic fit has been carried out also
in assumption of the event kinematics.
The selection criteria after the kinematic fit were the following:
for the found combination of
photons satisfying decay hypothesis;
minimal angle between photons of the
decay and the beam axis
;
the raw invariant masses of the two mesons
;
the reconstructed momentum ;
the reconstructed impact parameter
.
The results. One candidate event of the decay was found. The detection efficiency of this process is . The detection efficiency of the process is . The total statistics of found events of this process after all cuts is 6869 events.
Using the formulae
| (48) |
| (49) |
where are the numbers of produced mesons, we found:
the corresponding upper limit was evaluated to be
Our result is close to the table limit of [11].
6.11 Study of and processes
The process (26) is a QED process of the order of . Its study is interesting not only for QED testing, but also because it is important as an integrated luminosity check. It is also a source of background in searches for rare hadron processes. To compare experimental results with the QED the simulation was used from the work [36].
The process (27) is a QED process of the 4-th order in . Its investigation is also useful as a QED test, especially because it was studied in only one experiment [15] with ND detector, where 223 events were seen. The measurement of its cross-section is important for study of decays, where this process is a main source of background.
The study of the processes is based on the data sample with a total integrated luminosity of in the energy range MeV, while the production cross section measurements are based on the data subset, corresponding to integrated luminosity.
Analysis of (26).
To study the process
(26)
the following selection criteria were used:
positive charged trigger;
; ;
; ;
; ;
no hits in muon system;
, ;
.
Extra photons were allowed to prevent the
events loss due to accidental signals in calorimeter
due to beam background.
For events passing these selection criteria, the
experimental spectra and QED simulation [36] are
shown in Fig. 42.
The events number in simulation corresponds to
integrated luminosity. The cross section values were obtained
separately for each scan. Resulting values are
lieing between 15.5 17.5 nb, giving an average cross section
nb , with d.f..
After that all scans were processed again
with the same configuration of trigger,
the event losses due to trigger inefficiency was taken into account and
luminosity based on events was used.
As a result the difference of measured cross sections in different scans was
reduced to 17.1 17.9 nb, that is less
than 5% .
The average cross section was found to be nb ,
with .
But the simulated cross-section was significantly higher
,
so the difference between the experiment and simulation
was .
It was assumed that this difference appears because of different
angle cuts in our search and in luminosity calculations
(in the first case angle is determined using drift
chamber, in the second – using
calorimeter). To study this problem in two scans
PHI_9603 and PHI_9604 the collinear events were processed.
The “” events were selected with the same criteria
on ,
, as events “”.
Then the value of was calculated for experiment and
simulation. The results are shown below:
One can see that in this case the results in both scans are in good agreement with each other and with simulation. For 2 scans the integrated luminosities were recalculated and the visible cross section was obtained: , . Taking into account the detection efficiency , we obtained the cross section in the polar angle larger than and acollinearity angle larger than : , . The systematic error is determined mainly by the error in the integrated luminosity and is equal to . The simulation and experiment are in good agreement and the statistical error is at a level of . So, to increase the accuracy it is necessary to reduce the systematic error.
Analysis of the process
.
To study the process
(27)
the following selection criteria were used:
charged trigger
; ;
; ;
; ;
no hits in muon system; , ;
to cut events with decays,
the invariant mass of two photons was required to be
outside the interval from 110 to 170 MeV;
;
.
For selected events the spectra are shown in Fig.43 together with simulation[38]. The number of events in simulation corresponds to integrated luminosity of . The main background for this process comes from the reaction (26) with additional soft photon from the beam background. To suppress these events the threshold in minimum photon energy was placed at 50 MeV. For this process the ratio in separate experimental runs and simulation was obtained:
Using corrected luminosity the visible cross section was obtained: . Taking into account the detection efficiency , the cross section for polar angle greater than and acollinearity angle larger than was obtained: , and . The systematic error like in previous analysis is determined mainly by error in luminosity and is equal approximately to . As one can see, the simulation and experiment are in good agreement, but the statistical error in experiment is at a level of . So it is possible to improve accuracy with more statistics. The energy dependence of cross section (26) and (27) is in agreement with QED predictions.
6.12 Study of QED process
Earlier the three photon annihilation process was studied in high energy region [39, 40]. In our previous experiment with ND detector this process was studied as a QED background [15]. Investigation of (11) process at low energy near -meson peak has an advantage, because its cross-section energy dependence provides us with high statistics. This gives us a possibility for more detailed QED test in the third order of perturbation theory. Besides, the process is important as a background source for -meson radiative decays (7) and (8).
In the present study, the experimental data of PHI_9603 scan were analyzed. The total integrated luminosity is . The following selection cuts were applied: , , , . The main background comes from the processes (7), (8) and (10). Taking into account presence of a quasi-monochromatic recoil photons in radiative decays, we imposed the cut to suppress (8) process. To suppress (7) process, the photons with energy in the interval were rejected. The background from (10) process, was significantly reduced by condition imposed on acollinearity angle in the azimuth direction between two most energetic photons . The detection efficiency was obtained by MC simulation, and for described selection criteria it equals . Fig. 47 shows the energy dependence of visible cross-section of the process. The value of the cross section at was found to be: . The first error is statistical, the second one – systematic. The simulation with the standard QED matrix element gives: . The cross-section of background processes at peak does not exceed of that of the process (11). The value is due to resonant background. The detection efficiency for all background processes (7), (8), (10), obtained from simulation was not higher than .
Figs.47, 47, 47 show the softest photon energy spectrum, distributions over photon pair invariant mass and acollinearity angle in the azimuthal direction; points correspond to the experimental data, histogram – to the MC simulation. These distributions show good agreement between experiment and simulation, confirming the validity of QED at our level of accuracy.
7 Physical results from MHAD-97 experiment
7.1 Investigation of , reactions
Processes of -annihilation into four pions attract attention due to the following reasons. First, in the energy region these processes dominate and determine the main part of the hadronic contributions into the anomalous magnetic moment of muon and into QCD sum rules. Second, the processes (24) and (33) are an important source of information for hadron spectroscopy, in particular, for study -meson radial excitations.
According to the existing data, in the energy region there exist two radial excitations of the meson: and [11]. Determination of parameters of these states and their interference with the meson, can be found, for example, in work [41], [42]. A possible mixing of these excited -states with the exotic ones (for example, 4-quark states) is discussed in [43],[44]. Recently some experimental evidence appeared in favor of state existence [45], which possibly is not a conventional quark-antiquark meson [46].
In the past these processes were studied at VEPP-2M [15, 47, 48], DCI[49], ADONE[50] colliders. Statistical accuracy achieved in these experiments is , with a systematic error of , and the discrepancy between different experiments is sometimes as large as [15, 47]. Therefore, measurements with smaller systematic errors are needed to clarify situation with multi-hadron production.
7.1.1 process
To select events of the process
(24)
the following selection criteria were applied:
, ,
,
.
The energy dependence of visible cross section, obtained under
these conditions, is shown in Fig. 49 with error bars
indicating only statistical errors.
The following sources of systematic errors were taken into account:
charged particles reconstruction errors, systematic
errors caused by the use of the selection cuts, i.g. cuts on the
recalculated trigger and the number of hit wires, inaccuracy in
luminosity determination.
As a result, the systematic error was estimated as
(preliminary).
The detection efficiency was determined from the Lorentz-invariant
phase space simulation (LIPS).
As it is seen from two-pion invariant mass distribution
in Fig. 49,
the experimental distribution
has a bump around 750 MeV, which is absent in LIPS simulation.
This can be considered as a manifestation of meson
in the four charged pions final state.
In future, simulation with the intermediate state will be
made to compare experimental data with the simulation. Refinement of the
systematic error and the use of the whole MHAD9702 experiment statistics
is also planned.
7.1.2 process
The process (33) was studied in the final state
with 2 charged particles and 4 photons.
In the energy range above meson this process dominates.
Background comes from process,
from QED processes ,
and also some background comes from cosmic rays and collider beams.
To select events of the reaction (33), the following criteria were
applied:
;
;
;
;
;
;
The calculated trigger corresponds to the experimental trigger for charged
particles with refined thresholds. 32195 events survived the cuts.
For energies a background from the
process is significant.
To suppress this background, additional cuts were used,
related to ionization losses in drift chambers and acollinearity angle:
,
.
The kinematic fit was made under assumption, that charged
particles are mesons and 4 photons originate from two .
To suppress the remaining background, the following cuts were applied:
,
,
.
Data analysis. The detection efficiency for the (33) process, obtained from simulation, is practically energy independent and equals to Various intermediate states such as , , and others can contribute to the reaction under study. The -meson recoil mass distribution in Fig.51 shows that it is possible to separate the (25) process. It is not possible to separate other intermediate states, because they are very broad and distorted by interference effects.
To separate the (25) process, the selected events
were divided into two classes
( , class 1),
or
(not , class 2).
Using the detection efficiencies obtained from simulation with the intermediate state for the class 1, and with Lorenz Invariant Phase Space (LIPS) model for the class 2, the total cross section of the (25) process was calculated. In Fig.51 the cross section of the process (25) is shown together with the process (33) with all other intermediate states without interference between them. Fig.54 shows the cross section of the process (25), in comparison with existing experimental results. It is seen that the measured cross section is lower that obtained in ND experiment [15], but in good agreement with earlier OLYA detector data [48].
Simulations of different intermediate states like , and LIPS shows, that the detection efficiency varies within 5% range, which might be a source of systematic error. Another sources of systematic error are errors in event reconstruction and inaccuracy in simulation of -meson nuclear interaction. In total, the systematic error is estimated still to be about 15%.
7.2 The study of the process
The process (30) in the energy range =1.1-1.4 GeV is interesting for several reasons. It is well known, that near and resonances the cross section is well described by the Vector Dominance Model (VDM). New precise measurements in non-resonant region will allow to investigate the limitations of VDM and determine possible contribution from heavier states like or [11]. These states, decaying into are considered now as radial excitations of . Due to existence of -meson decay into with a 2% probability, the process (30) can proceed via mechanism. As a result, the – interference can be observed in mass spectrum. According to [51], the radial excitations , [11] can increase the – interference significantly.
The process (30) was studied earlier in the energy range up to 1.4 GeV with ND detector at VEPP-2M [15]. The results and the VDM prediction are shown in Fig. 58. One can see, that the measured cross section is significantly higher than the predicted one.
In analysis of the process (30) the events with two charged particles and two photons were selected. To suppress the cosmic and beam background and contribution from the process the cuts were imposed on the location of the production point with respect to collision center: , . The main background processes for (30) are:
| (50) | |||
| (51) | |||
| (52) | |||
| (53) |
The process (52) has the same final state as (30): The processes (50,51) can mimic the process under study (30) because of the showers splitting in the calorimeter. To reduce the contribution of the process (50) the cut was imposed. Because the processes (50,51,52) have collinear tracks in drift chamber, the cut was added to suppress their contributions. The main background comes from (53), where two photons from -decays are lost. We applied the cut , to decrease the contribution of this process. Then we applied kinematic fit to the selected events. To suppress the process (53), we used strong cut . The two-photon invariant mass distribution for events which survived the latter cut, is shown in Fig. 58. For further analysis the events with close to mass within the interval were selected. The cross section can be described as a sum of two terms:
| (54) |
where is a cross section (30) with photon energy less than 40 MeV, – is the cross section with photon energy larger than 40 MeV. The latter value, obtained from known cross section of the processes , can be calculated with the accuracy of 5%. The value is the investigated cross section with the radiative correction not more than 10%. The detection efficiency of the process with sharply decreases with energy, because the selection criteria suppress events with hard photons, emitted by initial particles.
The total cross section (30) was presented in VDM form:
| (55) |
where , , – mass, width and relative phase of vector meson respectively. The values and are free fit parameters. Other values were taken from the Tables [11]. The fit results are the following:
Disagreement with PDG data might indicate the existence of additional contributions besides . In particular, in the cross section (55) the interference with processes was not taken into account. Nevertheless, the function, which was used, describes the measured cross section rather well. This allows to account for radiative corrections and to calculate the cross section in Born approximation. The values of Born cross section in different energy points were calculated in the following way: The results are shown in table 5.
| Total energy | Cross section | Total energy | Cross section |
|---|---|---|---|
| , MeV | , nb | , MeV | , nb |
| 1080 | 1220 | ||
| 1100 | 1240 | ||
| 1120 | 1260 | ||
| 1140 | 1280 | ||
| 1160 | 1300 | ||
| 1180 | 1340 | ||
| 1200 | 1380 |
The systematic error in the cross section is about 12%. It is determined by the detection efficiency error (10%), background subtraction error (5%), error in luminosity (5%). Fig. 58 shows good agreement between old ND data [3] and new more accurate results, obtained in the present work.
To study intermediate state in (30), we measured invariant masses of -meson pairs in the final state. The intermediate state might be and much less probable with the decay . The interference between these two intermediate states can be observed if one compare mass spectra of and . Experimental data in Fig. 58 show clear peak in mass spectrum, which proves the existence of – interference in final state. The relative number of events in the peak area in Fig. 58 leads to the result
which is 4 standard deviations above zero. To obtain the — interference phase, the simulation was done with different values of the phase. The experimental data agrees the best with the phase value of , which is predicted in VDM model.
7.3 Study of the reaction
The cross-section of the process (13) is known with a high accuracy only in the energy range close to the -meson peak. In 1982 the reaction (13) was studied with the DM1 detector (Orsay) in the energy range [52]. At the same time this process was measured in the energy range with OLYA detector (Novosibirsk) [53]. In both experiments the achieved accuracy was not high, so new measurements are desirable.
In the present work we analyzed a part of statistics of the scan
MHAD_9702 with integrated luminosity of .
The process was studied in the decay mode
(17).
The main background comes from the non-resonant process
(9). Cosmic and beam background are also present.
To select events of the reaction (17) the
following cuts were applied:
, .
Cosmic events were rejected using SND calorimeter for
reconstruction of cosmic muon tracks.
The procedure was tested on simulated events of the process (13)
at . From 1733 simulated events
only 3 events were erraneously recognized as cosmic tracks,
while in the experimental data
1716 such tracks were found among 2319 events.
The remaining events should have two 2.
The invariant masses of photon pairs must be within the range:
.
Invariant mass of -meson pair
is compatible with mass.
The cut [9]
was used to suppress possible background from the decay or
its nuclear interaction in the detector material.
Events passing these cuts belong either to the process
(13) or to the process
with emission of photon by initial particles
and subsequent return back to the peak
(14), (9).
At the radiative photon in the process (14)
carries the energy up to , leading to
a significant difference in kinematics
with respect to the process (13).
In particular, the energy of meson decreases and as a result
the detection efficiency with the additional cut
goes down.
The cut rejects significantly the
process (9). The rest of the events of the process
(9) is rejected by cuts
and .
Beam background events have photons located mainly in the
small polar angle region. So, the cut
was applied.
108 experimental events passed all cuts listed above.
Distribution over , invariant mass of -mesons pairs
is shown in Fig. 54. Clear peak at mass is seen.
The detection efficiency to the investigated process (13)
depends on , decreasing from 3.4%
at to 1.8%
at .
Efficiency to the process (14) varies from 1.9% to 0.4%
in the same energy interval.
Efficiency of the process (9) is 0.1%.
The visible cross section of the process (13) is shown in Fig. 54 as well as expected cross section, calculated taking into account -meson resonance and radiative corrections. Experimental data from the OLYA detector are also shown in Fig. 54. One can see, that the data obtained by both detectors are in good agreement and within experimental errors do not contradict theoretical estimations.
7.4 Search for the process
state could appear in and processes. The search for the process was carried out earlier in ND experiment in the decay mode [15, 3], in CMD experiment [54] and in DM1 experiment at DCI [55] in the process . The study of the process in the channel was conducted in DM1-DCI experiment [56] in the energy range and in the energy range in DM2-DCI experiment [57]. The channel was studied in DM2-DCI as well.
New measurements, carried out with SND detector, can significantly improve our knowledge of these processes. In particular, new measurements could clarify the nature of (1480) state [58], found in IHEP (Protvino). With quantum numbers , and decay into , this state is a possible candidate for exotic hybrid or 4-quark state. The model exists, where (1480) is identical to (1450)-meson [59]. The electron width of -state depends on its structure, so the study of (1480) production in collisions could reveal its contents. Although the mass is larger than VEPP-2M maximum center of mass energy, its left slope could be observed with SND in the process .
In our search for the process (15) the decay channel was chosen. The following multi-photon reactions can be a source of background: (9), (16), (13), (18), (12).
The main selection cuts were , , . The number of found -s should be not less than 3 with two of them forming meson, the recoil mass of 3 ’s should be compatible with mass. Fig.59 presents the distribution over invariant mass for experiment and simulation. The contribution of QED background from processes (12) and from the process (9) was found to be negligible. To suppress possible background from the process (16) with unknown cross section we used a set of harder cuts on ETON, PTRT, and triples with invariant mass close to that of meson. We estimated from VDM model, that under these cuts the expected contribution from this process should be small. The same hard cuts allow to suppress the process (18) [57]. Main background comes from the reaction with subsequent decay . The number of such events was estimated [53] to be , which is close to observed 5 events. So, on the basis of the available data only upper limits of the cross sections in the energy range can be placed:
| (90% C.L.), | |
| (90% C.L.), | |
| eV | (90% C.L.), |
The obtained limits are lower than existing values [15, 3, 54].
7.5 Upper limit for electron width of meson
C-even resonance production in collisions is described in the lowest order in by a Feinman diagram shown in (Fig. 63). The unitary limit of the electron width of the meson can be expressed through its two-photon width and a factor of [60], [61]. It can be estimated using the table value of [11]:
| (56) |
Actual cross section can be several times larger due to transition form factor. The only experimental result was obtained at VEPP-2M collider with ND detector [3]. The reaction (19) was studied in a final state [62, 15] and the following upper limit was obtained: at 90% confidence level.
It this work, like in [62], the reaction (19) was studied again. The cross section was opproximated according to [63]:
| (57) |
where , , , – are the meson mass, full width, branching ratios of the decays into and respectively. In the unitary limit the total cross section of the reaction (19) (Fig. 63) is about at . This value is about 30 % larger than that extracted from Breit-Wigner formula, used in [62].
Event selection
For analysis of the reaction (19), events with four
photons in the final state where selected. The main background
processes are the following:
(12) and
(9).
The cross section each of these processes is approximately
three order of magnitude larger than that of the process (19).
To choose selection criteria and estimate detection
efficiency the Monte Carlo simulation was carried out
for the processes (19, 12, 9).
In order to suppress background the following selection criteria were applied:
; ;
;
;
;
; ;
;
; ;
The shown above choise of certain combinations of photon pairs , is based on specific kinematics of the process (19). The probability for other combinations to form -s is about 20 %. The restrictions on the second and fourth photons energies – , essentially reduced background from the process (12).
As a result of all described cuts, 3 experimental events left. The expected background is about 10 events mainly from the process (9). To reduce background, the kinematic fit was applied for remaining events. The fit required the energy-momentum balance, presence of two meson in event. Events with () were selected. The experimental events are shown in Fig. 63. The expected background from the processes(12, 9), estimated from simulation was found to be event.
Results According to simulation the detection efficiency for the process (19) is 21%. Based on the single found event the following upper limit could be placed:
| (58) |
C.L. 90%, where is the Poisson coefficient for upper limit at 90% confidence level for one detected event. Obtained result in four times lower than previous one, obtained with ND [15], but still 15 times higher than unitary limit: .
| Decay mode | Branching ratio (BR) (this work) | Expected BR, ref. | PDG,1996 or recent result | Comments |
| [20] | First observation | |||
| — | First observation | |||
| ; (in 7- mode) | [18] | [17] | Second measurement | |
| [33, 34] | [7, 16] | First observation | ||
| [16] | First attempt | |||
| — | [11] | Most precise measurement | ||
| (for unit form.f.) [12] | [13] [14] | — | ||
| — | ||||
| [26] | — | |||
| (Unit.limit) | [15, 62] | C.L. 90%, the best upper limit |
| The reaction | The average cross-section | Comments |
|---|---|---|
| ; ; | ||
| ; ; | ||
| ; ; | ||
| excl. | ||
| ; C.L. 90% | ||
| ; C.L. 90% |
8 Conclusion
In Tables 6 and 7 the SND physical results,
obtained up to now, are shown. Let us list the most important of them:
1. The existence of meson radiative electric dipole decays
, announced in our previous
work [7], is confirmed. The measured branching ratios
and mass spectrum of and
system support the 4-quark model structure of and
mesons.
2. The decay is observed, confirming
the 1997 CMD-2 first observation of this decay, but SND branching
ratio almost two times less, unless the errors is still high.
3. The decay is observed for the first time.
4. The measurements of and
decay branching ratios
agree well with existing data.
5. The cross-sections of reactions
were measured in agreement with previous results.
6. In analysis of process
the effect of -interference was observed
in final state mass spectrum.
7. We continued study of high order QED processes
.
9 Acknowledgment
This work is supported in part by Russian Foundation of Basic Researches, grants No.96-02-19192; No.96-15-96327; No.97-02-18561; No.97-02-18563; STP “Integration” (Grant No 274); INTAS Foundation, grant No.94-763.
References
- [1] V.M.Aulchenko et al., Proc. Workshop on Physics and Detectors for DANE, Frascati, Italy, April 9–12 (1991), p.605.
- [2] V.M.Aulchenko et al., Preprint INP 87-36, in Russian.
- [3] V.B.Golubev et al., Nucl. Instrum. Meth. 227 (1984), p.467. V.M.Aulchenko et al., Pisma v JETP, 43 (1987) 118 (in Russian).
- [4] G.M.Tumaikin, Proceedings of the 10-th International Conference on High Energy Particle Accelerators, Serpukhov, v.1 (1977) p.443.
- [5] M.N.Achasov et al., Nucl. Instrum. Meth. A441(2–3) (1998) p.337–342; M.N.Achasov et al., Nucl. Instrum. Meth. A401 (1997) p.179.
- [6] V.M.Aulchenko et al., Preprint INP 85-122, Novosibirsk, 1985.
- [7] M.N.Achasov et al., Preprint Budker INP 97-78, Novosibirsk, 1997; e-Print Archive: hep-ex/9710017.
- [8] V.V.Anashin et al., Preprint INP 84-123, Novosibirsk, 1984.
- [9] A.V.Bozhenok, V.N.Ivanchenko, Z.K.Silagadze, Transverse energy profile of electromagnetic shower, Nucl. Inst. and Meth., A379 (1996) pp.507–508.
- [10] V.N.Ivanchenko, Parallel talk given at HADRON-97 Conference, Brookhaven, August 25-30, 1997, to be published in Phys. Atom. Nucl., M.N.Achasov et.al., November 1997. e-Print Archive: hep-ex/9711023.
- [11] Particle Data Group. Review of Particle Physics. Parts I and II. Physical Review D, Particles and Fields v.54 (1996).
- [12] L.G.Landsberg, Phys.Rep 128, N.6 (1985) pp.301–376.
- [13] V.B.Golubev et al., Sov.journal of Nucl.Phys., 41, (1985) p.1183–1186.
- [14] R.R.Akhmetshin et al., Recent results from the CMD-2 detector at VEPP-2M collider. Proc. of the 28-th International Conference on High Energy Physics, Warsaw, Poland, 25–31 July 1996, 522.
- [15] S.I.Dolinsky et al., Phys. Rep. 202 (1991) 99.
- [16] S.I.Serednyakov, Plenary talk given at HADRON-97 Conference, Brookhaven, August 25-30, 1997.
- [17] R.R.Akhmetshin et al, Physics Letters, B415 (1997) p.445.
- [18] P.J.O’Donnell. Rev.Mod.Phys., v.53 (1981) p.673.
- [19] N.G.Deshpande and G.Eilam, Phys. Rev. D, v.25 (1982) p.270.
- [20] V.P.Druzhinin et al., Z.Phys. C37 (1987) pp.1–10.
- [21] N.N.Achasov, V.N.Ivanchenko, Preprint Budker 87-129, Novosibirsk, 1987, Nucl.Phys. B315 (1989) p.465.
- [22] J.Weinstein, N.Isgur, Phys. Rev. D41 (1990) p.2236.
- [23] S.Fajfer, R.J.Oakes, Phys. Rev. D42 (1990) p.2392.
- [24] A.Bramon, A.Grau, G.Panchieri, Phys. Lett., D283 (1992) p.416.
- [25] F.E.Close, N.Isgur, S.Kumano, Nucl.Phys., B389 (1993) p.513.
- [26] N.Broun, F.E.Close, The second DANE Physics Handbook, Vol.2, Frascati: INFN Frascati, 1995, pp.649–662.
- [27] A.Bramon, M.Greco, ibid, pp.663–670.
- [28] J.L.Lucio, M.Napsuciale, Phys.Lett., B331 (1994) p.418.
- [29] N.A.Tornquist, Phys. Rev. Lett., 49 (1982) p.624.
- [30] R.L.Jaffe, Phys. Rev., D15 (1997) pp.267, 281.
- [31] N.N.Achasov, V.V.Gubin, Phys. Rev., D56 (1997) p.4084.
- [32] N.N.Achasov, March 1998. e-Print Archive: hep-ex/9802327; Pisma v JETP 67 (1998) p.445.
- [33] V.A.Karnakov, Yad. Fiz., 42 (1985) p.1001.
- [34] N.N.Achasov, A.A.Kozhevnikov, Int. J. Mod. Phys., A 7 (1992) p.4825.
- [35] E.A.Kuraev,V.S.Fadin, Sov. J. Nucl. Phys., 41 (1985) p.466.
- [36] A.D.Bukin, Simulation of the elastic scattering process with radiative corrections. Preprint BINP 85-124, Novosibirsk, 1985.
- [37] M.R.Jane et al., Phys.Lett., V.59B (1975), p.103. M.R.Jane et al., Phys.Lett., V.73B (1978), p.503, erratum.
- [38] E.A.Kuraev, A.N.Peryshkin, Sov.J.of Nucl.Phys., v.42 (1985) p.1195 (in russian).
- [39] Behrend H.-J. et al.,Phys. Lett., B202 (1988) p.154.
- [40] Fernandes et al., Phys.Rev., D35 (1987) p.1.
- [41] A.B.Clegg, A.Donnachie, Z.Phys., C 62 (1994) p.455.
- [42] N.N. Achasov and A.A.Kozhevnikov, Phys.Rev., D55 (1997) p.2663.
- [43] A.Donnachie and Yu.S.Kalashnikova, Z.Phys. C 59 (1993) p.621.
- [44] A.Donnachie, Yu.S.Kalashnikova and Clegg, Z.Phys. C 60 (1993) p.187.
- [45] D.Aston et al., Nucl.Phys. B, Proc. Supplement 21 105 (1991).
- [46] A.Donnachie, A.B.Clegg, Phys.Lett. B 269 (1991) p.450.
- [47] L.M.Kurdardze et al., JETP Lett. 47 (1988) p.512.
- [48] L.M.Kurdardze et al., JETP Lett. 43 (1986) p.643.
- [49] D.Bisello et al., preprint LAL 90-35 (1990).
- [50] C.Bacci et al., Nucl.Phys. B184 (1981) p.31.
- [51] N.N.Achasov, N.M.Budnev et al., An electromagnetic mixing as a tool for investigation of the reaction , Sov.J. of Nucl. Phys., v.23 (1976) p.610 (in russian).
- [52] F. Mané et al., Phys. Lett., B 99 (1981) p.261.
- [53] P.M.Ivanov et al., Pisma v JETP, v.36, issue.3 (1982) pp.91–94 (in russian).
- [54] G.V.Anikin et al. Preprint INP 83-85, Novosibirsk, 1983.
- [55] B.Delcourt et al. Phys. Lett., 113B (1982) p.93.
- [56] F.Mane et al. Phys. Lett., 112B (1982) p.178.
- [57] D.Bisello et al. Z. Phys. C52 (1991) p.227.
- [58] S.I.Bitukov et al. Phys. Lett., 188B (1987) p.383.
- [59] N.N.Achasov, A.A.Kozhevnikov. Phys. Lett., 207B (1988) p.199.
- [60] A.I.Vainshtein, I.B.Khriplovich, Journal of Nuclear Physics, 13, 2(1971) p.620.
- [61] V.N.Novikov, S.I.Eidelman, Journal of Nuclear Physics, 21, 5(1975) p.1029.
- [62] Vorobyev P.V., Golubev V.B., Dolinsky S.I. et al., Journal of Nuclear Physics, 48, 2(8) (1987) p.436.
- [63] Belkov A.A., Kuraev E.V., Pervushin V.N., Journal of Nuclear Physics, 40, 6(12) (1984) p.1483.