EUROPEAN LABORATORY FOR PARTICLE PHYSICS
CERN-EP/98-055
April 15, 1998
Journal Version
June 5, 1998
An upper limit for the –neutrino mass
from decays
The OPAL Collaboration
Abstract
An upper limit for the –neutrino mass has been determined
from the decay using data collected
with the OPAL detector from 1991 to 1995 in collisions
at .
A limit of 43.2 at 95% CL is
obtained using a two–dimensional method
in the invariant mass and
energy distribution from 22 selected events.
Combining this result with OPAL’s previously published
measurement using decays, a new combined limit of
27.6 (95% CL) is obtained.
(Submitted to European Physical Journal C)
The OPAL Collaboration
K. Ackerstaff8, G. Alexander23, J. Allison16, N. Altekamp5, K.J. Anderson9, S. Anderson12, S. Arcelli2, S. Asai24, S.F. Ashby1, D. Axen29, G. Azuelos18,a, A.H. Ball17, E. Barberio8, R.J. Barlow16, R. Bartoldus3, J.R. Batley5, S. Baumann3, J. Bechtluft14, T. Behnke8, K.W. Bell20, G. Bella23, S. Bentvelsen8, S. Bethke14, S. Betts15, O. Biebel14, A. Biguzzi5, S.D. Bird16, V. Blobel27, I.J. Bloodworth1, M. Bobinski10, P. Bock11, J. Böhme14, M. Boutemeur34, S. Braibant8, P. Bright-Thomas1, R.M. Brown20, H.J. Burckhart8, C. Burgard8, R. Bürgin10, P. Capiluppi2, R.K. Carnegie6, A.A. Carter13, J.R. Carter5, C.Y. Chang17, D.G. Charlton1,b, D. Chrisman4, C. Ciocca2, P.E.L. Clarke15, E. Clay15, I. Cohen23, J.E. Conboy15, O.C. Cooke8, C. Couyoumtzelis13, R.L. Coxe9, M. Cuffiani2, S. Dado22, G.M. Dallavalle2, R. Davis30, S. De Jong12, L.A. del Pozo4, A. de Roeck8, K. Desch8, B. Dienes33,d, M.S. Dixit7, M. Doucet18, J. Dubbert34, E. Duchovni26, G. Duckeck34, I.P. Duerdoth16, D. Eatough16, P.G. Estabrooks6, H.G. Evans9, F. Fabbri2, A. Fanfani2, M. Fanti2, A.A. Faust30, F. Fiedler27, M. Fierro2, H.M. Fischer3, I. Fleck8, R. Folman26, A. Fürtjes8, D.I. Futyan16, P. Gagnon7, J.W. Gary4, J. Gascon18, S.M. Gascon-Shotkin17, C. Geich-Gimbel3, T. Geralis20, G. Giacomelli2, P. Giacomelli2, V. Gibson5, W.R. Gibson13, D.M. Gingrich30,a, D. Glenzinski9, J. Goldberg22, W. Gorn4, C. Grandi2, E. Gross26, J. Grunhaus23, M. Gruwé27, G.G. Hanson12, M. Hansroul8, M. Hapke13, C.K. Hargrove7, C. Hartmann3, M. Hauschild8, C.M. Hawkes5, R. Hawkings27, R.J. Hemingway6, M. Herndon17, G. Herten10, R.D. Heuer8, M.D. Hildreth8, J.C. Hill5, S.J. Hillier1, P.R. Hobson25, A. Hocker9, R.J. Homer1, A.K. Honma28,a, D. Horváth32,c, K.R. Hossain30, R. Howard29, P. Hüntemeyer27, P. Igo-Kemenes11, D.C. Imrie25, K. Ishii24, F.R. Jacob20, A. Jawahery17, H. Jeremie18, M. Jimack1, A. Joly18, C.R. Jones5, P. Jovanovic1, T.R. Junk8, D. Karlen6, V. Kartvelishvili16, K. Kawagoe24, T. Kawamoto24, P.I. Kayal30, R.K. Keeler28, R.G. Kellogg17, B.W. Kennedy20, A. Klier26, S. Kluth8, T. Kobayashi24, M. Kobel3,e, D.S. Koetke6, T.P. Kokott3, M. Kolrep10, S. Komamiya24, R.V. Kowalewski28, T. Kress11, P. Krieger6, J. von Krogh11, P. Kyberd13, G.D. Lafferty16, D. Lanske14, J. Lauber15, S.R. Lautenschlager31, I. Lawson28, J.G. Layter4, D. Lazic22, A.M. Lee31, E. Lefebvre18, D. Lellouch26, J. Letts12, L. Levinson26, R. Liebisch11, B. List8, C. Littlewood5, A.W. Lloyd1, S.L. Lloyd13, F.K. Loebinger16, G.D. Long28, M.J. Losty7, J. Ludwig10, D. Lui12, A. Macchiolo2, A. Macpherson30, M. Mannelli8, S. Marcellini2, C. Markopoulos13, A.J. Martin13, J.P. Martin18, G. Martinez17, T. Mashimo24, P. Mättig26, W.J. McDonald30, J. McKenna29, E.A. Mckigney15, T.J. McMahon1, R.A. McPherson28, F. Meijers8, S. Menke3, F.S. Merritt9, H. Mes7, J. Meyer27, A. Michelini2, S. Mihara24, G. Mikenberg26, D.J. Miller15, R. Mir26, W. Mohr10, A. Montanari2, T. Mori24, K. Nagai26, I. Nakamura24, H.A. Neal12, B. Nellen3, R. Nisius8, S.W. O’Neale1, F.G. Oakham7, F. Odorici2, H.O. Ogren12, M.J. Oreglia9, S. Orito24, J. Pálinkás33,d, G. Pásztor32, J.R. Pater16, G.N. Patrick20, J. Patt10, R. Perez-Ochoa8, S. Petzold27, P. Pfeifenschneider14, J.E. Pilcher9, J. Pinfold30, D.E. Plane8, P. Poffenberger28, B. Poli2, J. Polok8, M. Przybzien8, C. Rembser8, H. Rick8, S. Robertson28, S.A. Robins22, N. Rodning30, J.M. Roney28, K. Roscoe16, A.M. Rossi2, Y. Rozen22, K. Runge10, O. Runolfsson8, D.R. Rust12, K. Sachs10, T. Saeki24, O. Sahr34, W.M. Sang25, E.K.G. Sarkisyan23, C. Sbarra29, A.D. Schaile34, O. Schaile34, F. Scharf3, P. Scharff-Hansen8, J. Schieck11, B. Schmitt8, S. Schmitt11, A. Schöning8, T. Schorner34, M. Schröder8, M. Schumacher3, C. Schwick8, W.G. Scott20, R. Seuster14, T.G. Shears8, B.C. Shen4, C.H. Shepherd-Themistocleous8, P. Sherwood15, G.P. Siroli2, A. Sittler27, A. Skuja17, A.M. Smith8, G.A. Snow17, R. Sobie28, S. Söldner-Rembold10, M. Sproston20, A. Stahl3, K. Stephens16, J. Steuerer27, K. Stoll10, D. Strom19, R. Ströhmer34, R. Tafirout18, S.D. Talbot1, S. Tanaka24, P. Taras18, S. Tarem22, R. Teuscher8, M. Thiergen10, M.A. Thomson8, E. von Törne3, E. Torrence8, S. Towers6, I. Trigger18, Z. Trócsányi33, E. Tsur23, A.S. Turcot9, M.F. Turner-Watson8, R. Van Kooten12, P. Vannerem10, M. Verzocchi10, P. Vikas18, H. Voss3, F. Wäckerle10, A. Wagner27, C.P. Ward5, D.R. Ward5, P.M. Watkins1, A.T. Watson1, N.K. Watson1, P.S. Wells8, N. Wermes3, J.S. White28, G.W. Wilson14, J.A. Wilson1, T.R. Wyatt16, S. Yamashita24, G. Yekutieli26, V. Zacek18, D. Zer-Zion8
1School of Physics and Astronomy, University of Birmingham,
Birmingham B15 2TT, UK
2Dipartimento di Fisica dell’ Università di Bologna and INFN,
I-40126 Bologna, Italy
3Physikalisches Institut, Universität Bonn,
D-53115 Bonn, Germany
4Department of Physics, University of California,
Riverside CA 92521, USA
5Cavendish Laboratory, Cambridge CB3 0HE, UK
6Ottawa-Carleton Institute for Physics,
Department of Physics, Carleton University,
Ottawa, Ontario K1S 5B6, Canada
7Centre for Research in Particle Physics,
Carleton University, Ottawa, Ontario K1S 5B6, Canada
8CERN, European Organisation for Particle Physics,
CH-1211 Geneva 23, Switzerland
9Enrico Fermi Institute and Department of Physics,
University of Chicago, Chicago IL 60637, USA
10Fakultät für Physik, Albert Ludwigs Universität,
D-79104 Freiburg, Germany
11Physikalisches Institut, Universität
Heidelberg, D-69120 Heidelberg, Germany
12Indiana University, Department of Physics,
Swain Hall West 117, Bloomington IN 47405, USA
13Queen Mary and Westfield College, University of London,
London E1 4NS, UK
14Technische Hochschule Aachen, III Physikalisches Institut,
Sommerfeldstrasse 26-28, D-52056 Aachen, Germany
15University College London, London WC1E 6BT, UK
16Department of Physics, Schuster Laboratory, The University,
Manchester M13 9PL, UK
17Department of Physics, University of Maryland,
College Park, MD 20742, USA
18Laboratoire de Physique Nucléaire, Université de Montréal,
Montréal, Quebec H3C 3J7, Canada
19University of Oregon, Department of Physics, Eugene
OR 97403, USA
20Rutherford Appleton Laboratory, Chilton,
Didcot, Oxfordshire OX11 0QX, UK
22Department of Physics, Technion-Israel Institute of
Technology, Haifa 32000, Israel
23Department of Physics and Astronomy, Tel Aviv University,
Tel Aviv 69978, Israel
24International Centre for Elementary Particle Physics and
Department of Physics, University of Tokyo, Tokyo 113, and
Kobe University, Kobe 657, Japan
25Institute of Physical and Environmental Sciences,
Brunel University, Uxbridge, Middlesex UB8 3PH, UK
26Particle Physics Department, Weizmann Institute of Science,
Rehovot 76100, Israel
27Universität Hamburg/DESY, II Institut für Experimental
Physik, Notkestrasse 85, D-22607 Hamburg, Germany
28University of Victoria, Department of Physics, P O Box 3055,
Victoria BC V8W 3P6, Canada
29University of British Columbia, Department of Physics,
Vancouver BC V6T 1Z1, Canada
30University of Alberta, Department of Physics,
Edmonton AB T6G 2J1, Canada
31Duke University, Dept of Physics,
Durham, NC 27708-0305, USA
32Research Institute for Particle and Nuclear Physics,
H-1525 Budapest, P O Box 49, Hungary
33Institute of Nuclear Research,
H-4001 Debrecen, P O Box 51, Hungary
34Ludwigs-Maximilians-Universität München,
Sektion Physik, Am Coulombwall 1, D-85748 Garching, Germany
a and at TRIUMF, Vancouver, Canada V6T 2A3
b and Royal Society University Research Fellow
c and Institute of Nuclear Research, Debrecen, Hungary
d and Department of Experimental Physics, Lajos Kossuth
University, Debrecen, Hungary
e on leave of absence from the University of Freiburg
1 Introduction
The question of whether neutrinos have mass is one of the outstanding issues in particle physics, astrophysics, and cosmology. Massive neutrinos are strong candidates for solving the dark matter problem of the universe [1]. Of the three neutrino species, the –neutrino, is likely to have the largest mass. For instance, in the ‘see–saw’ mechanism [2] a mass hierarchy exists between neutrinos and their corresponding lepton partners, rendering the –neutrino the heaviest of the three known neutrino types.
On the basis of cosmological arguments a stable –neutrino with a mass larger than a few cannot exist [3], however unstable neutrinos may be more massive [4]. Previously, OPAL has published an upper limit on of 74 based on one event in the rare decay channel [5] in the 1992 data. In this final state the distribution of events in energy and invariant mass of the hadronic system at the two–dimensional limit of the kinematic range is sensitive to .
For this paper, all data collected by OPAL from 1991 to 1995 have been analysed to obtain a new limit on the tau–neutrino mass using again the decay channel. Compared to the previous analysis, the number of events considered has increased fivefold.
2 The OPAL detector and simulation
A detailed description of the OPAL detector can be found in [6]. Subdetectors which are particularly relevant to the present analysis are briefly described below.
The central detector consists of a set of tracking chambers providing charged particle tracking over 96% of the solid angle inside a 0.435 T uniform magnetic field parallel to the beam axis. Starting with the innermost components, it consists of a high precision silicon microvertex detector, a precision vertex drift chamber, a large volume jet chamber and a set of –chambers111 The OPAL coordinate system is defined so that is the coordinate parallel to the beam axis, the radius is the coordinate normal to the beam axis, is the azimuthal angle and is the polar angle with respect to . measuring the track coordinate along the beam direction.
From 1991 onwards a silicon strip microvertex detector was also present, consisting of two concentric layers with readout strips at 50 pitch, oriented for azimuthal () coordinate measurement [7]. In 1993 a new silicon strip microvertex detector with –coordinate readout in addition was installed [8].
The jet chamber is designed to combine good space and double track resolution [9], which is important for this analysis. It consists of 159 layers of axial anode wires, which are located between radii of 255 mm and 1835 mm. The efficiency for separating hits from two adjacent particles in the jet chamber is approximately 80% for distances between two hits of 2.5 mm in the projection on the – plane [9] and drops rapidly for smaller hit distances. The transverse momentum resolution of isolated tracks is . The jet chamber also provides energy loss measurements for particle identification (). The resolution is for minimum ionizing pions in jets with the maximum number of hits (159), resulting in a –e separation of at least 2 standard deviations up to momenta of 14 [10, 11].
A lead-glass electromagnetic calorimeter (ECAL) located outside the magnet coil covers the full azimuthal range with excellent hermeticity in the polar angle range of for the barrel region and for the endcap region.
3 Event selection
Data collected during the years 1991 to 1995, corresponding to an integrated luminosity of 155 and almost 200 000 recorded e+e events have been analysed. The event selection is performed in two steps. First, the preselection selects candidates with five charged tracks in a cone. In the second step, background decays and remaining non– events are rejected.
3.1 Preselection
A cone jet algorithm [17] is employed to assign all tracks and electromagnetic clusters to cones with a half opening angle of . For each event exactly two cones are required. The ‘signal’ cone is required to contain exactly five charged tracks with unit total charge. The other ‘recoil’ cone is required to contain at least one track.
All tracks are required to satisfy the following conditions:
-
•
100 , where is the momentum component transverse to the beam direction;
-
•
at least 20 hits in the central jet chamber. This restricts the acceptance of the detector to tracks with ;
-
•
the distance of closest approach of the track to the beam axis must be smaller than 2 cm. The displacement of the track along the beam axis from the nominal interaction point at the point of closest approach to the beam must be less than 75 cm;
-
•
the radial distance from the beam axis of the first hit in the jet chamber associated to a track must be smaller than 120 cm.
To reject non– events the OPAL standard selection of pairs is adopted [18]. The multihadronic background () is reduced by demanding a maximum of six tracks and 10 electromagnetic clusters in the event. A cluster is defined as a group of contiguous lead-glass blocks which has a minimum energy of 100 in the barrel or 200 in the endcap. The requirement on the maximum number of tracks leads to a 5–1 topology of tracks in the signal and recoil cone for all preselected events.
3.2 Final selection
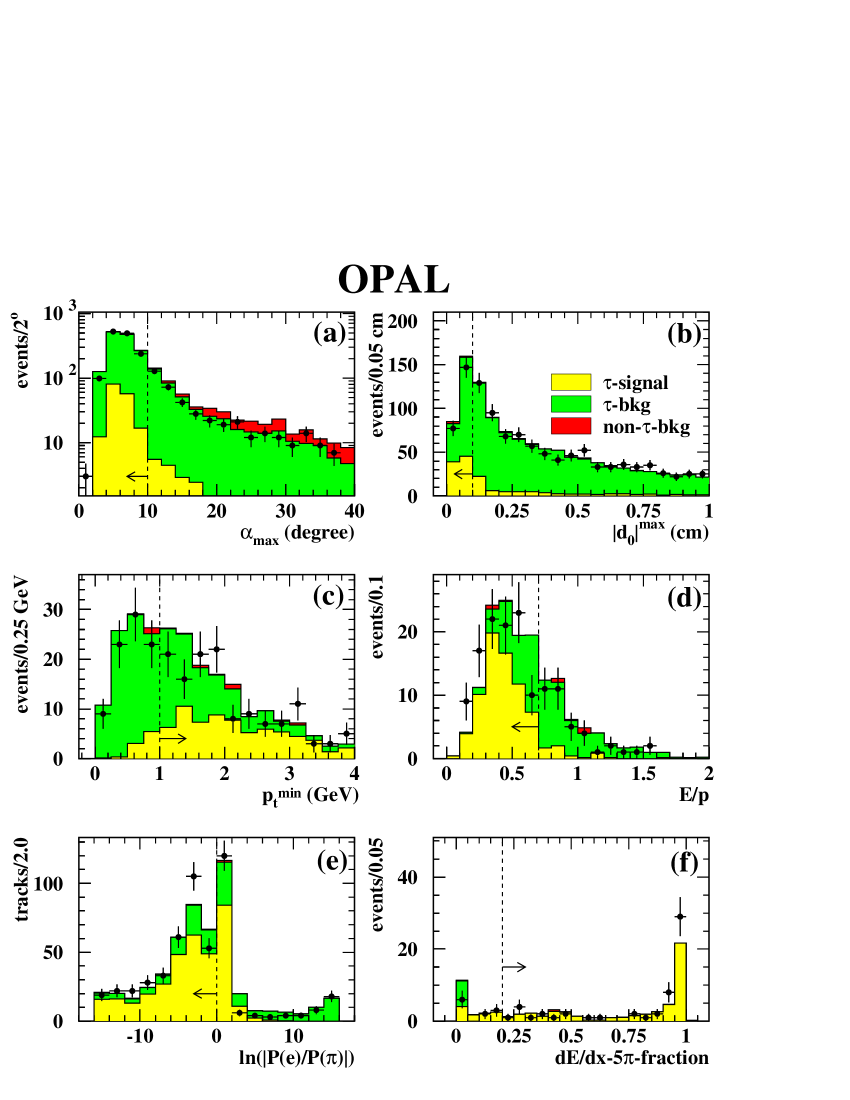
The background from other decays and from multihadronic events is reduced by rejecting events if the maximum opening angle between two tracks in the signal cone is larger than (see figure 1a).
The remaining background is dominated by decays into three charged particles accompanied by a photon conversion to an pair thus creating a final state with five charged tracks. To reject these events the following cuts are applied on the signal side. Events where any track has an impact parameter with respect to the beam axis larger than 0.1 cm are rejected (figure 1b). The minimum transverse momentum of any track has to be larger than 1 (figure 1c). Furthermore the fraction is required to be smaller than 0.7 (figure 1d), where is the deposited energy in the electromagnetic calorimeter and is the sum of the momenta of the five charged tracks.
The next two selection cuts exploit the information of the jet chamber together with the information from the silicon microvertex detector mainly to reject events from where a photon from the decay has converted. If a track appears to be more likely to originate from an electron than from a pion () or if insufficient information is available, at least one associated hit in the silicon microvertex detector is required. Here is the -probability that the track is consistent with the pion (electron) hypothesis derived from the and momentum measurement (figure 1e). A test on the total likelihood for the 5 final state is also performed. The fraction must favour the hypothesis ( 0.2), where and is the sum of the combinatorial possibilities of three particles to be pions and two to be oppositely charged electrons (figure 1f).
Events with a cluster in the electromagnetic calorimeter within the signal cone with energy more than 4 and not associated with a track are discarded because this signature probably comes from a photon.
Additional quality cuts on the tracks have been applied to ensure a good reconstruction of the system. Each track is required to have at least 40 hits in the central jet chamber. Each track fit must have a per degree of freedom smaller than 2. Given the high density of tracks in the final state, this cut aims to reject events with falsely reconstructed tracks due to spatial distortions of the chamber hits or due to hit misassignments by the pattern recognition algorithm. Furthermore events are rejected where the angle between a high–momentum track ( 15 ) and any wire plane of the jet chamber is smaller than 0.3∘. This cut eliminates events with tracks which may be badly reconstructed due to distortions of the drift field in direct proximity of the anode and cathode planes.
After this selection 22 candidate events remain. The positions of these events in the – plane are shown in figure 2. According to the Monte Carlo (MC) simulation, the selection efficiency after all cuts is , where the error is statistical only.
4 Background
A high purity data sample is required for an unbiased neutrino mass limit. The background can be divided into two classes: (a) –pair events with a decay misidentified as on the signal side and (b) non- events with a topology similar to decays. The reconstructed mass and hadronic energy of these events may be accidentally located close to the kinematic boundary in the – plane, leading to an artificially low neutrino mass limit.
The background is estimated from Monte Carlo event samples described in section 2. For the background class (a) we have considered the following decay channels:
-
•
: The decays into three charged pions one of which undergoes a hadronic interaction within the beam pipe or the vertex detector. The final state consists of five pions tending to higher invariant masses.
-
•
: One of the photons from the decay converts in the detector material or a Dalitz decay () occurs. If the two electrons are misidentified as pions, the reconstructed invariant mass is artificially high.
-
•
: If both the decay very close to the interaction point, the final state system cannot be distinguished from the signal. The expected bias is small, because the mass hypothesis for all tracks is the same as for .
-
•
: A 20% contamination from these events is expected in the data. As explained in section 7 these events cannot bias the measurement to lower mass limits and this is therefore not a serious background.
In this background class only one MC event passes the selection corresponding to 0.11 data events in the full – region. The fraction of –sensitive or ‘effective’ background is smaller. An event is denoted as –sensitive, if its position in the – plane could lead to a mass limit of below 100 . Based on the – distribution of MC events in the observed background decay channel it is estimated that less than one tenth of these background events would influence the neutrino mass limit.
| Background | Background | Expected number | Effective number |
| class | source | of events | of events |
| (a) X | , | ||
| (b) non– | |||
| total | |||
Out of the multihadronic MC samples, background class (b), one event is selected. It has many clusters in the electromagnetic calorimeter and the reconstructed mass (2.3 ) of the signal cone is too high to be compatible with a decay. Normalized to the data luminosity this event corresponds to an expected background of 0.45 events. For the estimation of the effective background the multiplicity cuts for tracks on the recoil cone and for clusters in the event are relaxed. Then 11 MC events are selected. Three of these are located inside the kinematically allowed signal region and only one event lies close enough to the boundary such that its consideration would have an impact on the extracted limit. It is therefore concluded that the background that could affect is only about 0.04 events.
The expected multihadron background has also been cross–checked using data events looking for the 5–2 event topology after relaxing the corresponding multiplicity cut. One such event in the data sample is observed with 1.3 expected from the MC, confirming the direct MC prediction of the background.
The background from four fermion events () originates mainly from a decay into three charged tracks combined with the fermion–antifermion pair. In order to estimate the contribution of this background, Monte Carlo samples are used where the pair is either a , , or pair. No such event passes the selection.
The total effective background is therefore expected to be about 0.05 events and is considered as negligible. The estimated background is summarized in table 1.
5 Determination of the mass limit
5.1 Likelihood analysis
The upper limit on the –neutrino mass is obtained employing a likelihood analysis. The probability for observing each selected event at the position () within the kinematic plane is derived as function of the neutrino mass . To obtain this probability the theoretical prediction for measuring the observed distribution in the – plane is convolved with the experimental resolution and the detection efficiency . Hence the probability can be written as
The theoretical prediction is generated as a function of the neutrino mass using KORALZ–TAUOLA [13, 12] including initial–state radiation. The neutrino mass was restricted to positive values. The detection efficiency is derived from Monte Carlo using full detector simulation [16]. The function used to describe the experimental resolution is a two–dimensional Gaussian. The corresponding parameters, the errors on the invariant mass , on the energy , and the correlation between them, are described in the following section.
The efficiency is, to a good approximation, independent of and (). Hence the formula for simplifies to
with a constant .
The sensitivity of the neutrino mass limit to the efficiency is small (see section 7 below).
5.2 Experimental Resolution
Most of the events lie well inside the kinematically allowed region in figure 2 such that they do not contribute significantly to the mass limit. An event is denoted ‘insensitive’, if a limit below 100 cannot be achieved using this event alone. For these events the errors on the track parameters are propagated to errors on the invariant mass, energy and the correlation. These errors are then taken as input for the binormal resolution function.
For the other events which are located near or outside the kinematic boundary (‘sensitive’ events), the exact form of the error ellipse in the – plane is of crucial importance for the determination of the limit on . Therefore an approach is used which considers the strong dependence of the resolution on the specific topology of the event (i.e., hits in particular subdetectors of the tracking system and susceptibility to reconstruction errors).
For these events the measured four–momenta of each event are used as input for the detector simulation [16] and reprocessed through the full simulation several thousand times. The subsample of these events that all have the same reconstruction properties as the original event (e.g., same number of tracks with hits in the silicon microvertex detector and in the –chambers) are used to determine the experimental resolution. This is done by fitting a two–dimensional Gaussian function with correlation in an unbinned likelihood fit to the reconstructed – spectrum of the simulated events. A small non–Gaussian (‘tail’) fraction of the distributions is eliminated to a large extent by discarding events deviating by more than 3 standard deviations from the fitted mean. The fraction of discarded events is about 2%, and the remaining events are used to determine the parameters of the resolution function. The typical mass and energy resolutions for decays in MC are 20–25 and 500 , respectively.
In order to assess a possible bias introduced by the tails in the – distributions the influence of the fraction of events residing in the tails has been estimated. First, a sum of two 2–dimensional Gaussian functions has been used in the fit, where the second wider Gaussian is introduced to describe the tails. The fraction of this Gaussian has been varied by to estimate the impact of the tails. Alternatively, the sum of a Gaussian and a flat pedestal distribution on the – plane has been fitted. In both approaches the effect on the extracted limit on does not vary by more than 3.5 .
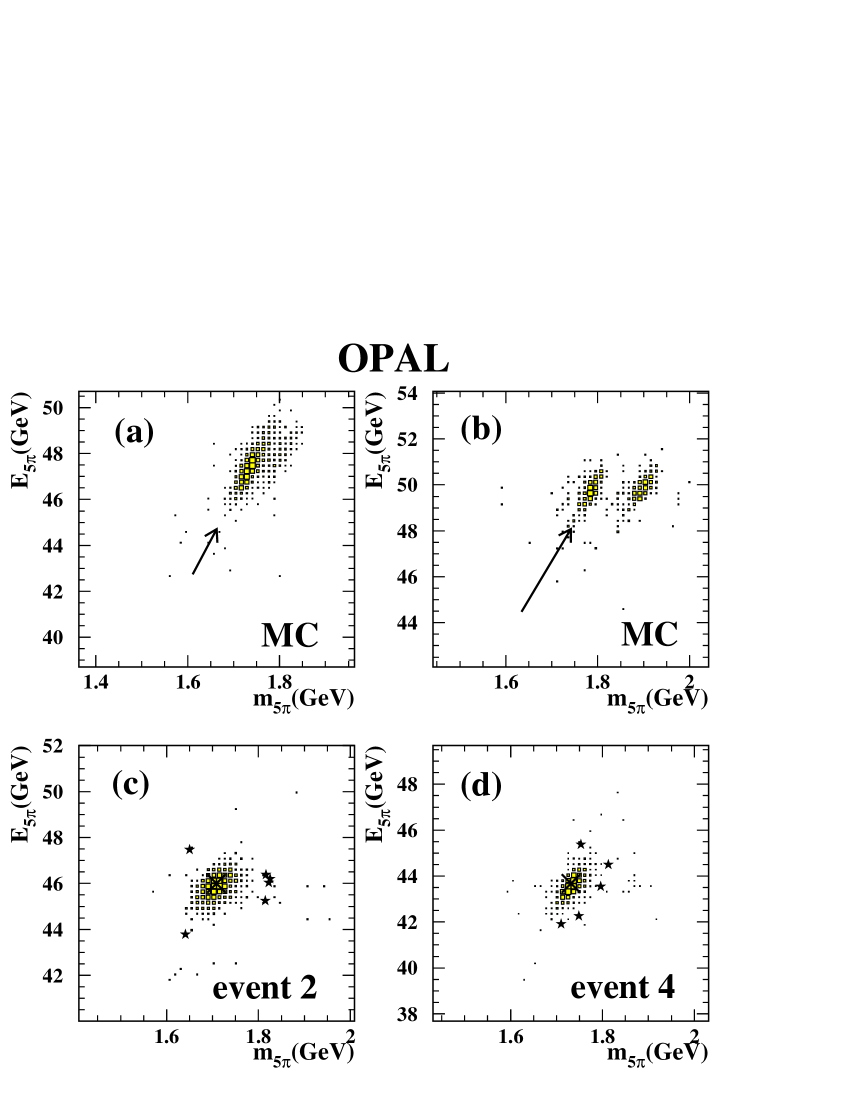
It is essential for this analysis that all events taken into consideration for the mass limit are well measured. Particularly for decays in which two or more tracks cross within the drift chamber volume or approach each other closely, an incorrect hit assignment may cause biases in the tails of the – distributions. Such biases have been studied using MC events for which generated and reconstructed invariant masses and energies can be compared. The same procedure as described previously was employed. When the true and reconstructed – values do not agree within their errors, striking peculiarities in the distribution after the detector simulation are observed. The expected Gaussian peak, generated by the simulation procedure, can appear shifted with respect to its input value (figure 3a) and sometimes ambiguities may occur (figure 3b).
These effects can largely, but not exclusively, be attributed to pathological track topologies, e.g. hit sharing when tracks cross or come very close or when tracks are close to the anode plane of the jet chamber. While the shifts as shown in figure 3a indicate such problematic topologies in a clear way, the quality cuts described in section 3 are sufficient to remove those pathological events in our data sample that are sensitive to . From MC simulation it is estimated that approximately 50% of the pathological events are rejected by the cut against high–momentum tracks in close proximity to a wire plane.
To assure that this measurement does not deteriorate from such defects, all candidate events have been individually inspected. None of the sensitive data events is found to suffer from the discussed biases. For the two most sensitive events it has been additionally verified that the experimental resolution is nearly constant in the – plane. Therefore the resolution has been determined for similar events at several positions around the data event (figure 3c,d). No significant deviation from the resolution of the original data event has been found.
6 Results
Five sensitive events are retained after the selection described in section 3. They are labeled by numbers (figure 2). Three of them (events 2, 3, 4) are well reconstructed. All tracks of the corresponding signal cones are separated sufficiently and have at least 75% of the maximum number of possible hits in the jet chamber.
Event 1 contains two high–momentum tracks that are close to each other throughout the entire volume of the tracking system. Thus the reconstruction of this event is likely to be degraded (see position of this event in figure 2). The effect on the limit is small, because the event is located in a less sensitive region of the – plane.
In the signal cone of event 5, four track crossings occur in the jet chamber. This results in an increased non-Gaussian fraction for the resolution function in the simulated and reconstructed events (section 5.2). This fact causes a relatively large error on the invariant mass and energy by the likelihood fit.
As a result of the background estimation in section 4, the probability that one of the remaining five sensitive events is background is 1%.
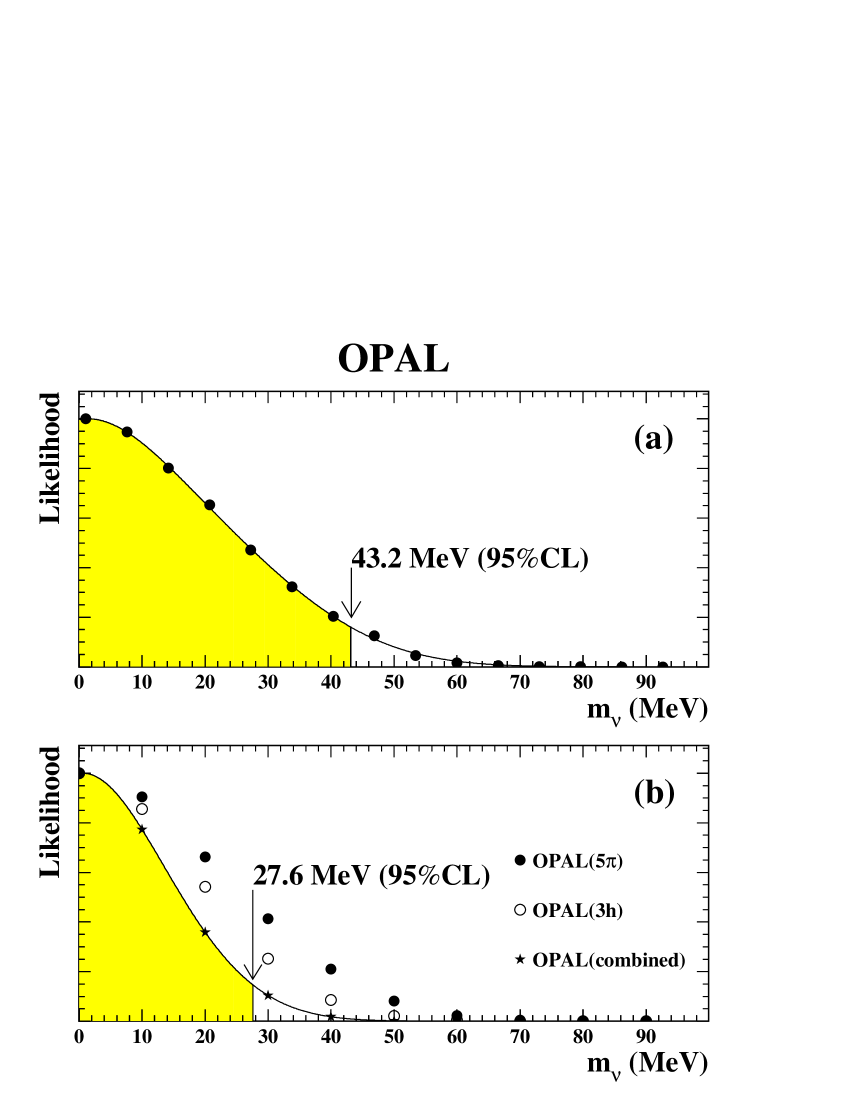
The upper limit for is determined from the 2-dimensional likelihood technique described in section 5.1 using the combined likelihood of all events which have passed the selection. This likelihood function is scanned by changing the assumed true neutrino mass in steps of 6 . A third–order polynomial multiplied by a Gaussian is used to obtain a functional description for the likelihood distribution. A 95% CL upper limit of 39.6 is obtained by integrating the likelihood function over the physical region of . The result is shown in figure 4a already including systematic uncertainties as described in section 7. An alternative (non–Bayesian) approach using the log–likelihood has been applied as a consistency check, resulting in an upper limit in agreement with the one quoted above.
In table 2 the impact of each sensitive event on the mass limit is listed.
| Event | Limit variation | Limit from this |
|---|---|---|
| () | event alone() | |
| 1 | +1.8 | 97.7 |
| 2 | +7.2 | 57.0 |
| 3 | +3.4 | 66.6 |
| 4 | +6.1 | 58.0 |
| 5 | +0.4 | 130.0 |
7 Systematic errors
The largest systematic uncertainty is from the resolution function, especially from the tail fraction. For the sensitive events the parameters of the experimental resolution are varied by the average statistical error of the likelihood fit. The effect on the limit is small (0.5 ).
As described in section 5.2 the experimental resolution is determined by the detector simulation only for sensitive events. For the remaining events the errors from the track fit are used. The consequences of this on and are estimated by varying these errors by 30%. This is the average deviation observed between the resolution determined by simulation and by calculation using track parameter errors. The corresponding variation on the mass limit is 0.2 .
The energy calibration has been checked with e+e events to a level of 510-4. The effect on the mass limit due to this uncertainty is small (0.2 ).
A contamination of 4 events out of the 22 selected events is expected from the decay in the lower and lower region, as predicted by MC. These events do not bias the mass limit to lower values, because the is not included in the reconstruction. To assess a possible impact on the limit, all possible combinations of four events in the lower – region have been successively removed from the event sample and the limit has been recalculated. The shift in the limit is +0.5 . To be conservative we do not correct for this effect.
The structure of the decay dynamics only has a very weak effect on the limit [19, 20], negligible as a contribution to the systematics in this analysis.
| Limit variation | |
|---|---|
| Source | () |
| tail fraction description | 3.5 |
| resolution function for insensitive events | 0.2 |
| resolution function error | 0.5 |
| energy calibration | 0.2 |
| slope of efficiency | 0.3 |
| tau mass | 0.1 |
| beam energy | 0.1 |
| total | 3.6 |
As mentioned in section 5 the detection efficiency is assumed to be constant within the kinematic region. The effect of a possible – or –dependent efficiency has been taken into account by introducing slopes in and , varying the efficiency by . The effect on the mass limit was found to be 0.3 .
A mass of (1777.0 0.3) has been used [21]; its uncertainty leads to a negligible effect on the neutrino mass limit.
For the beam energy uncertainty, an absolute error of 4 and an energy spread of 28 are assumed as obtained by the LEP energy working group [22].
The systematic uncertainties are summarized in table 3. All variations of the limit are added in quadrature and then added linearly to the mass limit. The likelihood distribution including all systematic uncertainties is shown in figure 4a; it is obtained by scaling the raw likelihood distribution (without systematic effects) in by the ratio of mass limits obtained with and without systematic errors. This likelihood allows us to combine the results of this analysis with previous OPAL results on including systematic errors.
8 Discussion
An upper limit for the
–neutrino mass has been derived using the decay
mode .
Including
systematic uncertainties,
the upper limit
43.2 is obtained at 95% confidence level.
This result is based on a data sample that is five times larger than the result previously published by OPAL for this channel [5], and leads to a significant improvement of the limit.
The combination of this measurement with the previously
published OPAL analysis
using decays [23] is obtained by multiplying
the respective likelihood curves including the systematic
uncertainties.
The result is shown in figure 4b.
From the combined new likelihood curve,
the upper limit
27.6 is obtained at 95% confidence level.
Similar limits of 31 and 30 have been also obtained by the ARGUS [24] and CLEO [25] experiments, respectively. Recently, a new upper limit of 18 has been determined by the ALEPH Collaboration [19], also by using the results from three- and five-prong tau decays. Thus, a tau–neutrino mass of less than 30 is well established and confirmed by several experiments.
Acknowledgements:
We particularly wish to thank the SL Division for the efficient operation
of the LEP accelerator at all energies
and for their continuing close cooperation with
our experimental group. We thank our colleagues from CEA, DAPNIA/SPP,
CE-Saclay for their efforts over the years on the time-of-flight and trigger
systems which we continue to use. In addition to the support staff at our own
institutions we are pleased to acknowledge the
Department of Energy, USA,
National Science Foundation, USA,
Particle Physics and Astronomy Research Council, UK,
Natural Sciences and Engineering Research Council, Canada,
Israel Science Foundation, administered by the Israel
Academy of Science and Humanities,
Minerva Gesellschaft,
Benoziyo Center for High Energy Physics,
Japanese Ministry of Education, Science and Culture (the
Monbusho) and a grant under the Monbusho International
Science Research Program,
German Israeli Bi-national Science Foundation (GIF),
Bundesministerium für Bildung, Wissenschaft,
Forschung und Technologie, Germany,
National Research Council of Canada,
Research Corporation, USA,
Hungarian Foundation for Scientific Research, OTKA T-016660,
T023793 and OTKA F-023259.
References
- [1] J. Primack, D. Seckel, and B. Sadoulet, Ann.Rev.Nucl.Part.Sci. 38 (1988) 751.
- [2] M. Gell-Mann, P. Ramond, and R. Slansky, Supergravity, ed. by D. Freedman et al., North Holland, 1979.
- [3] R. Cowsik and J. McClelland, Phys. Rev. Lett. 29 (1972) 669.
- [4] M. Kawasaki et al., Nucl.Phys. B419 (1994) 105.
- [5] OPAL Collaboration, R. Akers et al., Zeit. f. Physik C65 (1995) 183.
- [6] OPAL Collaboration, K. Ahmet et al., Nucl. Instrum. Meth. A305 (1991) 275.
- [7] P. Allport et al., Nucl. Instrum. Meth. A324 (1993) 34.
- [8] P. Allport et al., Nucl. Instrum. Meth. A346 (1994) 476.
- [9] O. Biebel et al., Nucl. Inst. Meth. A323 (1992) 169.
- [10] M. Hauschild et al., Nucl. Inst. Meth. A314 (1992) 74.
- [11] M. Hauschild, Nucl. Inst. Meth. A379 (1996) 436.
- [12] R. Decker, S. Jadach, J. Kühn, and Z. Wa̧s, Comput. Phys. Commun. 76 (1993) 361.
- [13] S. Jadach, B. Ward, and Z. Wa̧s, Comput. Phys. Commun. 79 (1994) 503.
- [14] T. Sjöstrand, Comp. Phys. Comm. 82 (1994) 74.
- [15] J. Hilgart, R. Kleiss, and F. Le Diberder, Comp. Phys. Comm. 75 (1993) 191.
- [16] J. Allison et al., Nucl. Inst. Meth. A317 (1992) 47.
- [17] OPAL Collaboration, G. Alexander et al., Zeit. f. Physik C52 (1991) 175.
- [18] OPAL Collaboration, R. Akers et al., Zeit. f. Physik C68 (1995) 555.
- [19] ALEPH Collaboration, R. Barate et al., Eur. Phys. J. C2 (1998) 395.
- [20] J. Gómez-Cadenas, Sensitivity of Future High–Luminosity e+e- colliders to a Massive Neutrino, in Third workshop on the tau–charm factory, pages 97–140, 1993.
- [21] BES Collaboration, J. Z. Bai et al., Phys. Rev. D53 (1996) 20.
- [22] LEP energy working group, Calibration of centre-of-mass energies at LEP1 for precise measurements of Z properties, 1998, CERN-EP/98-40; submitted to European Physical Journal C.
- [23] OPAL Collaboration, G. Alexander et al., Zeit. f. Physik C72 (1996) 231.
- [24] ARGUS Collaboration, H. Albrecht et al., Phys. Lett. B292 (1992) 221.
- [25] CLEO Collaboration, R. Ammar et al., A limit on the mass for the tau neutrino, 1998, CLNS-98-1551.