EUROPEAN LABORATORY FOR PARTICLE PHYSICS
CERN-EP/98-068
May 7, 1998
Bose-Einstein Correlations
of
Three Charged Pions in Hadronic Z0 Decays
The OPAL Collaboration
Bose-Einstein Correlations (BEC) of three identical charged pions were studied in hadronic decays recorded with the OPAL detector at LEP. The genuine three-pion correlations, corrected for the Coulomb effect, were separated from the known two-pion correlations by a new subtraction procedure. A significant genuine three-pion BEC enhancement near threshold was observed having an emitter source radius of and a strength of . The Coulomb correction was found to increase the value by and to reduce by . The measured corresponds to a value of when one takes into account the three-pion sample purity. A relation between the two-pion and the three-pion source parameters is discussed.
(Submitted to European Physical Journal, C)
The OPAL Collaboration
K. Ackerstaff8, G. Alexander23, J. Allison16, N. Altekamp5, K.J. Anderson9, S. Anderson12, S. Arcelli2, S. Asai24, S.F. Ashby1, D. Axen29, G. Azuelos18,a, A.H. Ball17, E. Barberio8, R.J. Barlow16, R. Bartoldus3, J.R. Batley5, S. Baumann3, J. Bechtluft14, T. Behnke8, K.W. Bell20, G. Bella23, S. Bentvelsen8, S. Bethke14, S. Betts15, O. Biebel14, A. Biguzzi5, S.D. Bird16, V. Blobel27, I.J. Bloodworth1, M. Bobinski10, P. Bock11, J. Böhme14, M. Boutemeur34, S. Braibant8, P. Bright-Thomas1, R.M. Brown20, H.J. Burckhart8, C. Burgard8, R. Bürgin10, P. Capiluppi2, R.K. Carnegie6, A.A. Carter13, J.R. Carter5, C.Y. Chang17, D.G. Charlton1,b, D. Chrisman4, C. Ciocca2, P.E.L. Clarke15, E. Clay15, I. Cohen23, J.E. Conboy15, O.C. Cooke8, C. Couyoumtzelis13, R.L. Coxe9, M. Cuffiani2, S. Dado22, G.M. Dallavalle2, R. Davis30, S. De Jong12, L.A. del Pozo4, A. de Roeck8, K. Desch8, B. Dienes33,d, M.S. Dixit7, M. Doucet18, J. Dubbert34, E. Duchovni26, G. Duckeck34, I.P. Duerdoth16, D. Eatough16, P.G. Estabrooks6, E. Etzion23, H.G. Evans9, F. Fabbri2, A. Fanfani2, M. Fanti2, A.A. Faust30, F. Fiedler27, M. Fierro2, H.M. Fischer3, I. Fleck8, R. Folman26, A. Fürtjes8, D.I. Futyan16, P. Gagnon7, J.W. Gary4, J. Gascon18, S.M. Gascon-Shotkin17, C. Geich-Gimbel3, T. Geralis20, G. Giacomelli2, P. Giacomelli2, V. Gibson5, W.R. Gibson13, D.M. Gingrich30,a, D. Glenzinski9, J. Goldberg22, W. Gorn4, C. Grandi2, E. Gross26, J. Grunhaus23, M. Gruwé27, G.G. Hanson12, M. Hansroul8, M. Hapke13, C.K. Hargrove7, C. Hartmann3, M. Hauschild8, C.M. Hawkes5, R. Hawkings27, R.J. Hemingway6, M. Herndon17, G. Herten10, R.D. Heuer8, M.D. Hildreth8, J.C. Hill5, S.J. Hillier1, P.R. Hobson25, A. Hocker9, R.J. Homer1, A.K. Honma28,a, D. Horváth32,c, K.R. Hossain30, R. Howard29, P. Hüntemeyer27, P. Igo-Kemenes11, D.C. Imrie25, K. Ishii24, F.R. Jacob20, A. Jawahery17, H. Jeremie18, M. Jimack1, A. Joly18, C.R. Jones5, P. Jovanovic1, T.R. Junk8, D. Karlen6, V. Kartvelishvili16, K. Kawagoe24, T. Kawamoto24, P.I. Kayal30, R.K. Keeler28, R.G. Kellogg17, B.W. Kennedy20, A. Klier26, S. Kluth8, T. Kobayashi24, M. Kobel3,e, D.S. Koetke6, T.P. Kokott3, M. Kolrep10, S. Komamiya24, R.V. Kowalewski28, T. Kress11, P. Krieger6, J. von Krogh11, P. Kyberd13, G.D. Lafferty16, D. Lanske14, J. Lauber15, S.R. Lautenschlager31, I. Lawson28, J.G. Layter4, D. Lazic22, A.M. Lee31, E. Lefebvre18, D. Lellouch26, J. Letts12, L. Levinson26, R. Liebisch11, B. List8, C. Littlewood5, A.W. Lloyd1, S.L. Lloyd13, F.K. Loebinger16, G.D. Long28, M.J. Losty7, J. Ludwig10, D. Lui12, A. Macchiolo2, A. Macpherson30, M. Mannelli8, S. Marcellini2, C. Markopoulos13, A.J. Martin13, J.P. Martin18, G. Martinez17, T. Mashimo24, P. Mättig26, W.J. McDonald30, J. McKenna29, E.A. Mckigney15, T.J. McMahon1, R.A. McPherson28, F. Meijers8, S. Menke3, F.S. Merritt9, H. Mes7, J. Meyer27, A. Michelini2, S. Mihara24, G. Mikenberg26, D.J. Miller15, R. Mir26, W. Mohr10, A. Montanari2, T. Mori24, K. Nagai26, I. Nakamura24, H.A. Neal12, B. Nellen3, R. Nisius8, S.W. O’Neale1, F.G. Oakham7, F. Odorici2, H.O. Ogren12, M.J. Oreglia9, S. Orito24, J. Pálinkás33,d, G. Pásztor32, J.R. Pater16, G.N. Patrick20, J. Patt10, R. Perez-Ochoa8, S. Petzold27, P. Pfeifenschneider14, J.E. Pilcher9, J. Pinfold30, D.E. Plane8, P. Poffenberger28, B. Poli2, J. Polok8, M. Przybycień8, C. Rembser8, H. Rick8, S. Robertson28, S.A. Robins22, N. Rodning30, J.M. Roney28, K. Roscoe16, A.M. Rossi2, Y. Rozen22, K. Runge10, O. Runolfsson8, D.R. Rust12, K. Sachs10, T. Saeki24, O. Sahr34, W.M. Sang25, E.K.G. Sarkisyan23, C. Sbarra29, A.D. Schaile34, O. Schaile34, F. Scharf3, P. Scharff-Hansen8, J. Schieck11, B. Schmitt8, S. Schmitt11, A. Schöning8, T. Schorner34, M. Schröder8, M. Schumacher3, C. Schwick8, W.G. Scott20, R. Seuster14, T.G. Shears8, B.C. Shen4, C.H. Shepherd-Themistocleous8, P. Sherwood15, G.P. Siroli2, A. Sittler27, A. Skuja17, A.M. Smith8, G.A. Snow17, R. Sobie28, S. Söldner-Rembold10, M. Sproston20, A. Stahl3, K. Stephens16, J. Steuerer27, K. Stoll10, D. Strom19, R. Ströhmer34, R. Tafirout18, S.D. Talbot1, S. Tanaka24, P. Taras18, S. Tarem22, R. Teuscher8, M. Thiergen10, M.A. Thomson8, E. von Törne3, E. Torrence8, S. Towers6, I. Trigger18, Z. Trócsányi33, E. Tsur23, A.S. Turcot9, M.F. Turner-Watson8, R. Van Kooten12, P. Vannerem10, M. Verzocchi10, P. Vikas18, H. Voss3, F. Wäckerle10, A. Wagner27, C.P. Ward5, D.R. Ward5, P.M. Watkins1, A.T. Watson1, N.K. Watson1, P.S. Wells8, N. Wermes3, J.S. White28, G.W. Wilson14, J.A. Wilson1, T.R. Wyatt16, S. Yamashita24, G. Yekutieli26, V. Zacek18, D. Zer-Zion8
1School of Physics and Astronomy, University of Birmingham,
Birmingham B15 2TT, UK
2Dipartimento di Fisica dell’ Università di Bologna and INFN,
I-40126 Bologna, Italy
3Physikalisches Institut, Universität Bonn,
D-53115 Bonn, Germany
4Department of Physics, University of California,
Riverside CA 92521, USA
5Cavendish Laboratory, Cambridge CB3 0HE, UK
6Ottawa-Carleton Institute for Physics,
Department of Physics, Carleton University,
Ottawa, Ontario K1S 5B6, Canada
7Centre for Research in Particle Physics,
Carleton University, Ottawa, Ontario K1S 5B6, Canada
8CERN, European Organisation for Particle Physics,
CH-1211 Geneva 23, Switzerland
9Enrico Fermi Institute and Department of Physics,
University of Chicago, Chicago IL 60637, USA
10Fakultät für Physik, Albert Ludwigs Universität,
D-79104 Freiburg, Germany
11Physikalisches Institut, Universität
Heidelberg, D-69120 Heidelberg, Germany
12Indiana University, Department of Physics,
Swain Hall West 117, Bloomington IN 47405, USA
13Queen Mary and Westfield College, University of London,
London E1 4NS, UK
14Technische Hochschule Aachen, III Physikalisches Institut,
Sommerfeldstrasse 26-28, D-52056 Aachen, Germany
15University College London, London WC1E 6BT, UK
16Department of Physics, Schuster Laboratory, The University,
Manchester M13 9PL, UK
17Department of Physics, University of Maryland,
College Park, MD 20742, USA
18Laboratoire de Physique Nucléaire, Université de Montréal,
Montréal, Quebec H3C 3J7, Canada
19University of Oregon, Department of Physics, Eugene
OR 97403, USA
20Rutherford Appleton Laboratory, Chilton,
Didcot, Oxfordshire OX11 0QX, UK
22Department of Physics, Technion-Israel Institute of
Technology, Haifa 32000, Israel
23Department of Physics and Astronomy, Tel Aviv University,
Tel Aviv 69978, Israel
24International Centre for Elementary Particle Physics and
Department of Physics, University of Tokyo, Tokyo 113, and
Kobe University, Kobe 657, Japan
25Institute of Physical and Environmental Sciences,
Brunel University, Uxbridge, Middlesex UB8 3PH, UK
26Particle Physics Department, Weizmann Institute of Science,
Rehovot 76100, Israel
27Universität Hamburg/DESY, II Institut für Experimental
Physik, Notkestrasse 85, D-22607 Hamburg, Germany
28University of Victoria, Department of Physics, P O Box 3055,
Victoria BC V8W 3P6, Canada
29University of British Columbia, Department of Physics,
Vancouver BC V6T 1Z1, Canada
30University of Alberta, Department of Physics,
Edmonton AB T6G 2J1, Canada
31Duke University, Dept of Physics,
Durham, NC 27708-0305, USA
32Research Institute for Particle and Nuclear Physics,
H-1525 Budapest, P O Box 49, Hungary
33Institute of Nuclear Research,
H-4001 Debrecen, P O Box 51, Hungary
34Ludwigs-Maximilians-Universität München,
Sektion Physik, Am Coulombwall 1, D-85748 Garching, Germany
a and at TRIUMF, Vancouver, Canada V6T 2A3
b and Royal Society University Research Fellow
c and Institute of Nuclear Research, Debrecen, Hungary
d and Department of Experimental Physics, Lajos Kossuth
University, Debrecen, Hungary
e on leave of absence from the University of Freiburg
1 Introduction
Bose-Einstein Correlations (BEC) between pairs of identical bosons, mainly the system, have been extensively studied in a large variety of interactions and over a wide range of energies [1, 2]. These correlations, which are present when the bosons are near to one another in phase space, are used to estimate the size of the emitter of the particles and more recently in QCD-based models to describe fragmentation and hadronisation in high energy reactions [3, 4]. The two-pion BEC effect has lately also been discussed [5] in connection with the measurement of the W mass in the reaction at LEP2.
In systems of more than two identical bosons, BEC are also expected to be present. These higher-order correlations may affect the multi-hadron production and are also of interest in intermittency studies [6]. Detection of the “genuine” multi-boson BEC is complicated by the fact that they have to be isolated from the lower-order boson correlations and therefore require large data samples. In addition, systems of several identical charged bosons, placed nearby in phase space, are subject to a relatively large repulsive Coulomb interaction which may suppress the BEC effect. As a consequence, only relatively few higher order BEC studies of three and more charged pions have been reported [7, 8, 9, 10, 11, 12, 13]. In those studies, mainly due to lack of statistics, it was not possible to isolate and verify the genuine multi-boson BEC from the lower-order ones. Attempts have been made to infer from the measured BEC of the multi-boson systems the individual contribution of each of the higher order correlations by model dependent formulae. A significant genuine BEC signal of three identical charged pions, , has been reported in a hadron-proton interaction experiment [12] and more recently in a LEP experiment [13] where, however, the Coulomb effect was neglected.
Here we report on a BEC study of the system carried out with a large sample of approximately hadronic decays, recorded by the OPAL detector at the LEP collider during the years 1991 to 1995. In this analysis, which takes into account the Coulomb effect, we have isolated the genuine three-pion BEC and estimated the size of the emitter. In Section 2 we introduce the extension of the two-boson BEC to the system of three identical bosons. Section 3 is devoted to the procedure used for the Coulomb correction of the three-pion BEC and in Section 4 the experimental details are given. In Section 5 we describe our method for the extraction of the genuine BEC and present the results obtained from our analysis. The relations between the two-pion and the genuine three-pion BEC parameters are explored in Section 6. Finally, the summary and conclusions are presented in Section 7.
2 The three-boson correlation function
In describing the three-boson BEC we follow the approach which was also adopted, for example, in [2]. The BEC of pairs of identical bosons can be formally expressed in terms of the normalised function
| (1) |
where is the total boson production cross section, and are the single-boson density in momentum space and the inclusive cross section, respectively. Similarly and are respectively the density of the two-boson system and its inclusive cross section. The product of the independent one-particle densities is referred to as the reference density distribution, or reference sample, to which the measured correlations are compared. The inclusive two-boson density can be written as:
| (2) |
where represents the two-body correlations. In the simple case of two identical bosons the normalised density function , defined in Eq. 1, already describes the genuine two-body correlations and has been referred to in previous BEC studies of OPAL [14, 15] as the correlation function. Thus one has
| (3) |
where is the normalised two-body correlation term. Since Bose-Einstein correlation are present when the bosons are close to one another in phase space, one natural choice is to study them as a function of the variable defined by
which approaches zero as the identical bosons move closer in phase space. Here is the four-momentum vector of the th particle, is the boson mass and is the invariant mass squared of the two-boson system.
In the parametrisation proposed by Goldhaber et al. [16], has the form
| (4) |
where estimates the size of the two-boson emitter which is taken to be of Gaussian shape. The strength of the BEC effect, frequently referred to as the chaoticity parameter, is measured by which varies in the range .
The inclusive density of three bosons, , includes the three independent boson momentum spectra, the two-particle correlations and the genuine three-particle correlations , namely:
| (5) |
where the summation is taken over all the three possible permutations. The normalised inclusive three-body density, is then given by
| (6) |
Here
| (7) |
represents a mixed three-boson system in which only two of them are correlated, and
| (8) |
represents the three-boson correlation. In analogy with , one can define a correlation function , which measures the genuine three-boson correlation, by subtracting from the term which contains the two-boson correlations contribution. Thus
| (9) |
which depends only on the genuine three-boson correlations. For the study of the three-boson correlations we use the variable which is defined as
where the summation is taken over all the three different boson pairs and is the invariant mass squared of the three-boson system. From the definition of this three-boson variable it is clear that as approaches zero so do the three values which eventually reach the region where the two-boson BEC enhancement is observed.
The genuine three-pion correlation function can be parametrised by the expression [9]
| (10) |
where , which can vary within the limits , measures the strength of the three-boson BEC effect and estimates the size of the three-boson emitter. The factor two which multiplies arises from the presence of two possible diagrams with exchange of all the identical pions within a triplet. To extract from the data values for the strength and the emitter size , we modified Eq. 10 to read
| (11) |
where is a normalisation factor and the linear term accounts for the long range correlations arising from charge and energy conservation and phase space constraints. Higher-order terms for the long range correlations were found not to be needed in the present analysis.
3 The Coulomb correction
The observed BEC of identical charged bosons is suppressed by the Coulomb repulsive force. To account for this effect a correction to the measured BEC distribution is required. If is the two-boson correlation in the presence of the Coulomb effect then it is related to the true through the function , so that
| (12) |
In the case that the reference sample is a Monte Carlo generated data without the Coulomb effect, can be expressed by the Gamow factor [17]:
| (13) |
where . Here and are the charges, in positron units, of the two bosons having a mass of , and is the fine-structure constant. Recently alternative Coulomb corrections [18, 19] for the two-boson system have been proposed, which are based on non-Gaussian parametrisations. These could not be extended to the three-pion system and therefore were not used in our analysis.
For a given three charged bosons system, with boson pairs having values of , and , the Coulomb correction can be approximated, in terms of the function by [9]:
| (14) |
where the average is taken over all experimentally accessible values of which satisfy the condition .
4 Experimental setup and data selection
4.1 The OPAL detector
Details of the OPAL detector and its performance at the LEP collider are given elsewhere [21]. Here we will describe briefly only those detector components pertinent to the present analysis, namely the central tracking chambers.
Besides a silicon microvertex detector, the central tracking chambers consist of a precision vertex detector, a large jet chamber, and additional -chambers surrounding the jet chamber. The vertex detector is a long, two-layer cylindrical drift chamber that surrounds the beam pipe111A right-handed coordinate system is adopted by OPAL, where the -axis points to the centre of the LEP ring, and positive is along the electron beam direction. The angles and are the polar and azimuthal angles respectively.. The jet chamber has a length of and a diameter of . It is divided into 24 sectors in , each equipped with 159 sense wires parallel to the beam ensuring a large number of measured points even for particles emerging from a secondary vertex. The jet chamber also provides a measurement of the specific energy loss, , of charged particles [22]. A resolution of on has been obtained, allowing particle identification over a large momentum range. The -chambers, long, wide and thick, allow a precise measurement of the -coordinate of the charged tracks. They cover polar angles in the region and of the azimuthal angular range. All the chambers are contained in a solenoid providing an axial magnetic field of 0.435 T. The combination of these chambers leads to a momentum resolution of , where in is the transverse momentum with respect to the beam direction. The first term under the square root sign represents the contribution from multiple Coulomb scattering [23].
4.2 Data selection
The analysis was performed with the OPAL data collected at LEP with centre of mass energies on and around the peak with the requirement that the jet and -chambers were fully operational. The hadronic decays were selected according to the number of charged tracks and the visible energy of the event [24]. We applied the same track quality and cuts described in a former OPAL BEC study of two identical charged pions [14]. Furthermore, events with a thrust angle of with respect to the beam axis were rejected. Finally we accepted only events with a relative charge balance of , where and are respectively the observed numbers of positively and negatively charged tracks. Following these criteria a total of hadronic decay events were used in the analysis.
To avoid configurations with overlapping tracks, we rejected pion pairs if their invariant mass was less than and if the opening angle between them in the plane perpendicular to the beam axis was less than . In the present analysis all charged tracks are assumed to be pions. From Monte Carlo (MC) studies [24] we have estimated that the average pion purity of our charged track sample is with a systematic uncertainty of and a negligible statistical error. Thus the pion purity of the three charged track system is .
5 Analysis and results
The BEC analysis used the hadronic decay data of OPAL where in each event all possible combinations were taken as the data sample. For the reference distribution we used a Monte Carlo generated sample [25] of JETSET 7.4 events which have passed a full detector simulation [26] but do not include BEC and Coulomb effects. This JETSET Monte Carlo program, which includes most of the known resonances which decay into the and final states, was carefully tuned to the OPAL data [27]. Here one should note that the systems of the measured data contain one pair of identical pions and therefore cannot be used as a reference sample. Thus:
| (15) |
where is the number of the data combinations and is the corresponding number of Monte Carlo combinations at the same value. The Monte Carlo sample was normalised to the data in a region far away from any observable BEC enhancement. This was achieved by requiring that the integrated number of the Monte Carlo entries in the range was equal to that of the data. The measured distribution is shown in Fig. 1a in the range of . The data points below have relatively large errors, and a lower three-track separation efficiency of identical charged tracks. Therefore a lower limit of was imposed on the analysis. In the figure a clear enhancement is observed in the region below . This enhancement can be interpreted as coming from both the known two-pion and from the genuine three-pion BEC.


5.1 The extraction of the genuine three-pion BEC
To extract the genuine three-pion BEC one has to subtract from the contribution coming from the well known two-pion BEC. In our analysis this last contribution is evaluated from the mixed-charged combinations of the data. To this end, it is convenient to rewrite as follows:
| (16) |
The total excess above the Monte Carlo expectation has two contributions. The first from the two-pion BEC, , and the second from the genuine three-pion BEC, , so that:
| (17) |
From this it follows that what should be subtracted from to obtain the genuine three-pion BEC, is:
| (18) |
Because we utilise for the subtraction the same events used for the measurement, there exists in every event with given charged multiplicity and charge balance values a relation between and . Here is the number of combinations in the data and is the corresponding number of combinations for the MC generated sample properly normalised to the data in the range of .
If we define as the number of combinations in a given event, then it can be related to , the number of combinations. A straightforward combinatorial calculation yields that for an event with given and values, one has:
| (19) |
In our analysis we utilise, after the application of the appropriate cuts, all the hadronic decays lying within a wide range of multiplicity and charge balance. If we define as the ratio averaged over all multiplicity and charge balance values in our data, then:
| (20) |
The integrations are carried out over the region where and are different from zero. We further verified from MC studies that, to a good approximation, relation (20) holds also in its differential form, that is:
| (21) |

The average depends on the multiplicity and the charge balance distributions of the data sample. Using the MC hadronic decay sample we determined, by counting the number of combinations in the range of , that with a negligible statistical error. The same value is obtained when the MC sample is replaced by the data sample. This value shifts to when the range is enlarged to . We also studied the variation of this ratio on the pion purity. To this end we evaluated this ratio from the MC sample using only tracks which were generated as pions with the result that . The effect of the shift from 3.69 to 3.71 on the BEC parameters was found to be negligible in comparison to the statistical errors and to other systematic uncertainties (see Table 2).
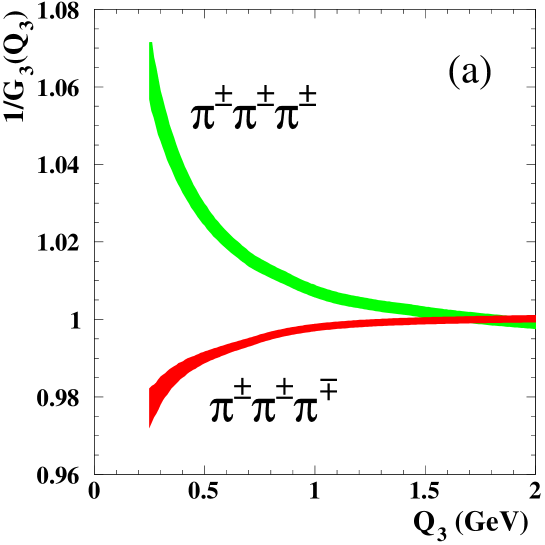
In Fig. 2 we show the and the distributions as a function of . As can be seen, the two distributions are similar in the higher region, namely between and . The slight difference between the two distributions can be attributed to the systematic uncertainties given in Table 2, in particular those listed as items (f) and (g). Thus in this range the excess of combinations is fully accounted for by the excess seen in the due to the two-pion BEC. In the lower region an excess of over is observed which can no longer be attributed to the two-pion BEC and is therefore identified as the genuine three-pion BEC contribution, . Thus:
| (22) |
In the present analysis we have used Eq. 22 to subtract the contributions due to the two-pion BEC.
The measured distribution is shown in Fig. 1a and the resulting distribution is shown in Fig. 1b, where a significant genuine three-pion BEC enhancement is clearly present. The solid line in Fig. 1b represents the fit result of Eq. 11 to the data. The fitted values of and and the correlation factor are given in Table 1 together with the value divided by the number of degrees of freedom (d.o.f.).
| Parameter | Without Coulomb Corr. | With Coulomb Corr. |
|---|---|---|
| [fm] | ||
| [GeV-1] | ||
5.2 Evaluation of the Coulomb effect
The Coulomb correction to the genuine BEC, defined as in Eq. 14, can be applied either to the data or to the MC reference sample. These two possibilities are not expected to yield identical results since, unlike the MC generated sample, the data are affected by both the BEC and the Coulomb interactions. In our BEC analysis we chose to apply the Coulomb correction to the data and utilised the results coming from the second possibility as a measure of the systematic errors.
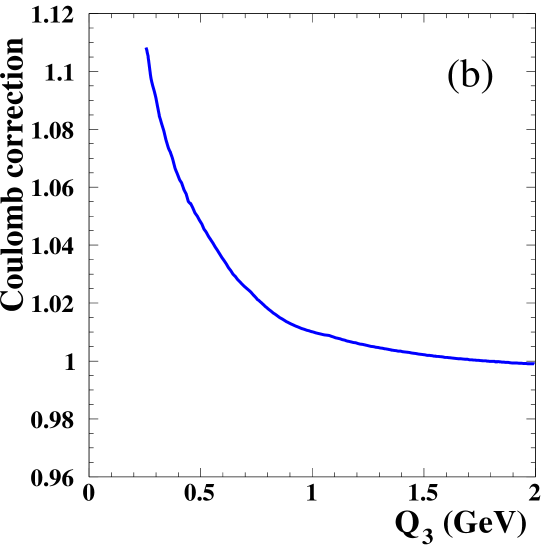
The Coulomb correction was accounted for by assigning to every three-pion combination of the data a weight equal to . This automatically assures that , defined in Eq. 14, is averaged only over all accessible experimental values of . Using this procedure, the Coulomb correction factor can be evaluated at every bin separately for the and the data samples. These correction factors are shown in Fig. 3a as a function of in the range from to . The resulting Coulomb correction applied to , due to the corrections to and , is shown in Fig. 3b where it is seen to rise as decreases, reaching the value of about at .
5.3 The corrected BEC distributions
The Coulomb corrected distributions , and of the three-pion BEC, are shown in Fig. 4. A clear genuine three-pion Bose-Einstein enhancement is present in the low region, from about reaching a value of at . The continuous line in the figure represents the fit result of in the range , as parametrised in Eq. 11. The quality of this fit, given by a , represents an improvement over the fit result obtained for the Coulomb uncorrected distribution. The values obtained from the fit are for the emitter radius and a strength of , with correlation factor of . These are listed in Table 1 together with the fit results for and . A comparison between the results presented in the table shows, as expected, that the value of increases when the Coulomb correction is applied. We found that increased by about whereas decreased by about .


5.4 Systematic errors
To estimate the systematic errors we have considered the effects on the and results arising from the choice of the data selection criteria and from the procedure adopted for the Coulomb correction. We also investigated the effect on the results from our choice of the fitting range and the MC reference sample. These are summarised in Table 2.
| Fit variation | ||||
| a. The reference fit | — | — | ||
| b. varying data selection cuts | ||||
| c. MC Coulomb correction | ||||
| d. fit range | ||||
| e. fit range | ||||
| f. addition of a long range term | ||||
| g. varying the MC reference sample | ||||
| Total systematic error | — | — |
In order to estimate the systematic effects related to track and event selection the analysis was repeated restricting the track selection criteria described in Section 4.2. To evaluate the possible contribution from our choice to account for the Coulomb effect on the BEC we also applied the Coulomb correction to the MC reference sample rather than to the data. Furthermore we considered for the fit two alternative ranges. We also investigated the influence of adding a quadratic term to the long range correlations. Finally, the systematic uncertainty coming from our choice of the JETSET 7.4 MC reference sample has been estimated by repeating the analysis with the HERWIG 5.8 [28] generated sample. This alternative MC uses a totally different model of fragmentation (cluster fragmentation) from that used by JETSET 7.4 (string formation and fragmentation). An estimate of the over-all systematic uncertainties was obtained by summing in quadrature the differences between each fit (b)–(g) and the reference fit (a).
The largest contributions to the over-all systematic error come from the choice of the selection criteria and from the choice of the lower fit range limit. As seen in Table 2, the results for and change by less than when the Coulomb correction is applied to the Monte Carlo generated sample. We observe that is rather sensitive to the choice of the lower limit used as compared to the change of . In addition to the list given in Table 2, we also investigated other possible sources of systematic effects, such as the choice of the bin size used in the fit, and verified that they indeed have negligible contributions. Finally, as noted above, the influence of the uncertainties of the ratio on the subtraction formula and the fit results is also negligible.
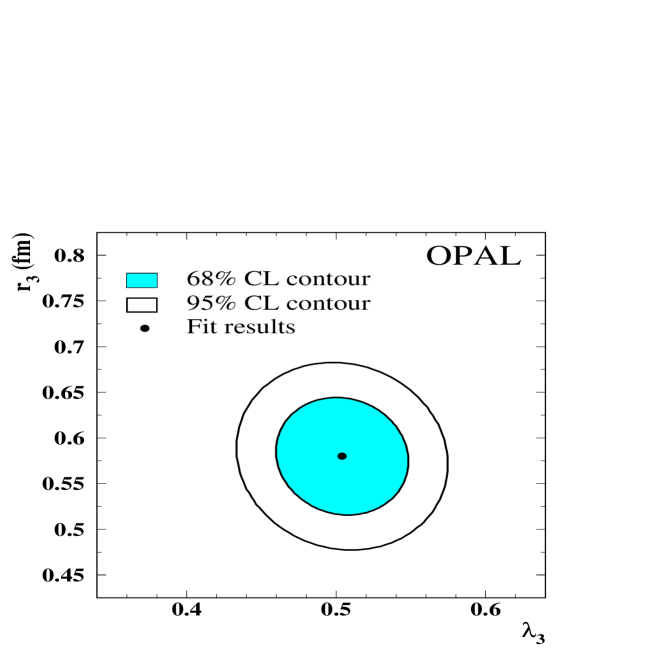
Thus the final values of the BEC parameters are: and , where the uncertainties of the measured parameters are strongly dominated by the systematic errors. In Fig. 5 the and confidence level correlation contours for the BEC parameters are shown. The shape of the contours is determined mostly from the systematic errors. Accounting for the three-pion purity of , the BEC strength amounts to for a pure system. The purity error of , due to the uncertainty of the MC generation rates, is incorporated in the systematic error of the value.
6 Relation to other experimental results
A relation between the two-pion and three-pion emitter radii is derived in Ref. [9] based on the Fourier transform of the source distribution which is assumed to be of a Gaussian shape. This relation confines the emitter range as determined from a fit to :
| (23) |
where is the two-boson BEC emitter size. Since in our analysis the emitter radius is determined from the genuine BEC distribution , the previous bounds reduce to the equality:
| (24) |
In a former OPAL analysis [15], of the two-pion BEC present in the hadronic decays, two options were adopted for the reference sample. The first utilised the correlations of the pairs of in the data and the second used the two-pion correlations of Monte Carlo generated sample. Since in our analysis the reference samples were taken from the Monte Carlo generated events, we have checked relation (24) with the previously measured OPAL value, obtained by the second method, of , where only the statistical error was given. From Eq. 24 it follows that this value corresponds to , which is in good agreement with our value obtained from a fit to the data of .
The BEC of the system has also been studied by the DELPHI collaboration [13] using the hadronic decays measured at LEP. In that analysis, which neglected the Coulomb correction, the following results were obtained: and . The relatively large statistical errors reflect the fact that a much smaller data sample was used than in the present measurement. Our result for , before Coulomb correction, of with a statistical error of , is smaller than the DELPHI result but is consistent with it within one standard deviation. The measured value depends on the pion track purity of the hadron sample analysed, so that caution has to be exercised when comparing the BEC strength values of different experiments. Keeping this in mind, we note that our mean value lies considerably above that reported by DELPHI but it is still consistent with it within two standard deviations when the systematic errors are included.
7 Summary and conclusions
The Bose-Einstein correlations of three identical charged pions, produced in hadronic decays, have been studied after correcting for the Coulomb interaction. A significant genuine three-pion Bose-Einstein correlation signal is observed near threshold in the distribution obtained after the subtraction of the two-pion correlation contribution. The radius of the three-pion emitter and the BEC strength are measured to be:
where the uncertainties are dominated by the systematic errors.
The Coulomb repulsive interaction opposes the Bose-Einstein enhancement in the low region and therefore it is reasonable that in our analysis the Coulomb correction increased the value. This increase amounts to about . On the other hand, the Coulomb correction has a smaller effect on the value which is lowered by about . Accounting for the three-pion purity the BEC strength amounts to for a pure system.
A relation between the two-pion and the three-pion emitter dimensions was discussed in reference [9]. We tested this relation by using the present result and that obtained in the latest OPAL two-pion BEC analysis [15] where approximately the same data sample was used. The proposed relation between and , expressed in Eq. 24, is in good agreement with our results.
Acknowledgements
We particularly wish to thank the SL Division for the efficient
operation of the LEP accelerator at all energies and for their
continuing close cooperation with our experimental group. We thank
our colleagues from CEA, DAPNIA/SPP, CE-Saclay for their efforts over
the years on the time-of-flight and trigger systems which we continue
to use. In addition to the support staff at our own
institutions we are pleased to acknowledge the
Department of Energy, USA,
National Science Foundation, USA,
Particle Physics and Astronomy Research Council, UK,
Natural Sciences and Engineering Research Council, Canada,
Israel Science Foundation, administered by the Israel
Academy of Science and Humanities,
Minerva Gesellschaft,
Benoziyo Center for High Energy Physics,
Japanese Ministry of Education, Science and Culture (the Monbusho) and
a grant under the Monbusho International
Science Research Program,
German Israeli Bi-national Science Foundation (GIF),
Bundesministerium für Bildung, Wissenschaft,
Forschung und Technologie, Germany,
National Research Council of Canada,
Research Corporation, USA,
Hungarian Foundation for Scientific Research, OTKA T-016660,
T023793 and OTKA F-023259.
References
-
[1]
W.A. Zajc in Hadronic Multiparticle Production,
(Ed. P. Carruthers), World Scientific, 1988, p. 235;
S. Haywood, Where are we going with Bose-Einstein – A mini review, RAL Report 94-074. - [2] E.A. De Wolf, Bose-Einstein Correlations, Proc. XXVII Int. Conf. on High Energy physics, Glasgow, 20-27 July 1994 (Eds. P.J. Bussey and I.G. Knowles), Inst. of Physics Publ., 1995, p. 1281.
- [3] J. Ellis and K. Geiger, Phys. Rev. D52 (1995) 1500; Phys. Rev. D54 (1996) 1967.
- [4] B. Andersson and M. Ringnér, Nucl. Phys. B513 (1998) 627.
- [5] L. Lönnblad and T. Sjöstrand, Phys. Lett. B351 (1995) 293.
- [6] See e.g. E.A. De Wolf et al., Phys. Reports 270 (1996) 1.
-
[7]
TASSO Collab., M. Althoff et al., Z. Phys. C30 (1986) 355;
AFS Collab., T. Åkesson et al., Z. Phys. C36 (1987) 517;
LEBC-EHS Collab., M. Aguilar-Benitez et al., Z. Phys. C54 (1992) 21. - [8] Y.M. Liu et al., Phys. Rev. C34 (1986) 1667.
- [9] I. Juricic et al., Phys. Rev. D39 (1989) 1.
- [10] NA23 Collab., J.L. Bailly et al., Z. Phys. C43 (1989) 341.
- [11] UA1 Minimum-Bias Collab., N. Neumeister et al., Phys. Lett. B275 (1992) 186.
- [12] NA22 Collab., N.M. Agababyan et al., Z. Phys. C68 (1995) 229.
- [13] DELPHI Collab., P. Abreu et al., Phys. Lett. B355 (1995) 415.
- [14] OPAL Collab., P.D. Acton et al., Phys. Lett. B267 (1991) 143.
- [15] OPAL Collab., G. Alexander et al., Z. Phys. C72 (1996) 389.
- [16] G. Goldhaber et al., Phys. Rev. Lett. 3 (1959) 181; Phys. Rev. Lett. 120 (1960) 300.
- [17] M. Gyulassy et al., Phys. Rev. C20 (1979) 2267.
- [18] M.G. Bowler, Phys. Lett. B270 (1991) 69.
- [19] M. Biyajima et al., Phys. Lett. B353 (1995) 340.
- [20] J.G. Cramer, Phys. Rev. C43 (1991) 2798.
-
[21]
OPAL Collab., K. Ahmet et al., Nucl. Instr. Meth. A305 (1991) 275;
P. P. Allport et al., Nucl. Instr. Meth. A324 (1993) 34;
P. P. Allport et al., Nucl. Instr. Meth. A346 (1994) 476. - [22] M. Hauschild et al., Nucl. Instr. and Meth. A314 (1992) 74.
- [23] O. Biebel et al., Nucl. Instr. and Meth. A323 (1992) 169.
- [24] OPAL Collab., G. Alexander et al., Z. Phys. C52 (1991) 175.
-
[25]
T. Sjöstrand, Comp. Phys. Comm. 39 (1986) 347;
T. Sjöstrand and M. Bengtsson, Comp. Phys. Comm. 43 (1987) 367;
T. Sjöstrand, Comp. Phys. Comm. 82 (1994) 74. - [26] J. Allison et al., Nucl. Instr. and Meth. A317 (1992) 47.
-
[27]
OPAL Collab., P. Acton et al., Z. Phys. C58 (1993) 387;
OPAL Collab., G. Alexander et al., Z. Phys. C69 (1996) 543. - [28] G. Marchesini et al., Comp. Phys. Comm. 67 (1992) 465.