Searches for New Physics in Diphoton Events in collisions at TeV
F. Abe,17 H. Akimoto,39 A. Akopian,31 M. G. Albrow,7 A. Amadon,5 S. R. Amendolia,27 D. Amidei,20 J. Antos,33 S. Aota,37 G. Apollinari,31 T. Arisawa,39 T. Asakawa,37 W. Ashmanskas,18 M. Atac,7 P. Azzi-Bacchetta,25 N. Bacchetta,25 S. Bagdasarov,31 M. W. Bailey,22 P. de Barbaro,30 A. Barbaro-Galtieri,18 V. E. Barnes,29 B. A. Barnett,15 M. Barone,9 G. Bauer,19 T. Baumann,11 F. Bedeschi,27 S. Behrends,3 S. Belforte,27 G. Bellettini,27 J. Bellinger,40 D. Benjamin,35 J. Bensinger,3 A. Beretvas,7 J. P. Berge,7 J. Berryhill,5 S. Bertolucci,9 S. Bettelli,27 B. Bevensee,26 A. Bhatti,31 K. Biery,7 C. Bigongiari,27 M. Binkley,7 D. Bisello,25 R. E. Blair,1 C. Blocker,3 S. Blusk,30 A. Bodek,30 W. Bokhari,26 G. Bolla,29 Y. Bonushkin,4 D. Bortoletto,29 J. Boudreau,28 L. Breccia,2 C. Bromberg,21 N. Bruner,22 R. Brunetti,2 E. Buckley-Geer,7 H. S. Budd,30 K. Burkett,20 G. Busetto,25 A. Byon-Wagner,7 K. L. Byrum,1 M. Campbell,20 A. Caner,27 W. Carithers,18 D. Carlsmith,40 J. Cassada,30 A. Castro,25 D. Cauz,36 A. Cerri,27 P. S. Chang,33 P. T. Chang,33 H. Y. Chao,33 J. Chapman,20 M. -T. Cheng,33 M. Chertok,34 G. Chiarelli,27 C. N. Chiou,33 F. Chlebana,7 L. Christofek,13 M. L. Chu,33 S. Cihangir,7 A. G. Clark,10 M. Cobal,27 E. Cocca,27 M. Contreras,5 J. Conway,32 J. Cooper,7 M. Cordelli,9 D. Costanzo,27 C. Couyoumtzelis,10 D. Cronin-Hennessy,6 R. Culbertson,5 D. Dagenhart,38 T. Daniels,19 F. DeJongh,7 S. Dell’Agnello,9 M. Dell’Orso,27 R. Demina,7 L. Demortier,31 M. Deninno,2 P. F. Derwent,7 T. Devlin,32 J. R. Dittmann,6 S. Donati,27 J. Done,34 T. Dorigo,25 N. Eddy,20 K. Einsweiler,18 J. E. Elias,7 R. Ely,18 E. Engels, Jr.,28 W. Erdmann,7 D. Errede,13 S. Errede,13 Q. Fan,30 R. G. Feild,41 Z. Feng,15 C. Ferretti,27 I. Fiori,2 B. Flaugher,7 G. W. Foster,7 M. Franklin,11 J. Freeman,7 J. Friedman,19 H. Frisch,5 Y. Fukui,17 S. Gadomski,14 S. Galeotti,27 M. Gallinaro,26 O. Ganel,35 M. Garcia-Sciveres,18 A. F. Garfinkel,29 C. Gay,41 S. Geer,7 D. W. Gerdes,15 P. Giannetti,27 N. Giokaris,31 P. Giromini,9 G. Giusti,27 M. Gold,22 A. Gordon,11 A. T. Goshaw,6 Y. Gotra,25 K. Goulianos,31 L. Groer,32 C. Grosso-Pilcher,5 G. Guillian,20 J. Guimaraes da Costa,15 R. S. Guo,33 C. Haber,18 E. Hafen,19 S. R. Hahn,7 R. Hamilton,11 T. Handa,12 R. Handler,40 F. Happacher,9 K. Hara,37 A. D. Hardman,29 R. M. Harris,7 F. Hartmann,16 J. Hauser,4 E. Hayashi,37 J. Heinrich,26 W. Hao,35 B. Hinrichsen,14 K. D. Hoffman,29 M. Hohlmann,5 C. Holck,26 R. Hollebeek,26 L. Holloway,13 Z. Huang,20 B. T. Huffman,28 R. Hughes,23 J. Huston,21 J. Huth,11 H. Ikeda,37 M. Incagli,27 J. Incandela,7 G. Introzzi,27 J. Iwai,39 Y. Iwata,12 E. James,20 H. Jensen,7 U. Joshi,7 E. Kajfasz,25 H. Kambara,10 T. Kamon,34 T. Kaneko,37 K. Karr,38 H. Kasha,41 Y. Kato,24 T. A. Keaffaber,29 K. Kelley,19 R. D. Kennedy,7 R. Kephart,7 D. Kestenbaum,11 D. Khazins,6 T. Kikuchi,37 B. J. Kim,27 H. S. Kim,14 S. H. Kim,37 Y. K. Kim,18 L. Kirsch,3 S. Klimenko,8 D. Knoblauch,16 P. Koehn,23 A. Köngeter,16 K. Kondo,37 J. Konigsberg,8 K. Kordas,14 A. Korytov,8 E. Kovacs,1 W. Kowald,6 J. Kroll,26 M. Kruse,30 S. E. Kuhlmann,1 E. Kuns,32 K. Kurino,12 T. Kuwabara,37 A. T. Laasanen,29 I. Nakano,12 S. Lami,27 S. Lammel,7 J. I. Lamoureux,3 M. Lancaster,18 M. Lanzoni,27 G. Latino,27 T. LeCompte,1 S. Leone,27 J. D. Lewis,7 P. Limon,7 M. Lindgren,4 T. M. Liss,13 J. B. Liu,30 Y. C. Liu,33 N. Lockyer,26 O. Long,26 C. Loomis,32 M. Loreti,25 D. Lucchesi,27 P. Lukens,7 S. Lusin,40 J. Lys,18 K. Maeshima,7 P. Maksimovic,19 M. Mangano,27 M. Mariotti,25 J. P. Marriner,7 A. Martin,41 J. A. J. Matthews,22 P. Mazzanti,2 P. McIntyre,34 P. Melese,31 M. Menguzzato,25 A. Menzione,27 E. Meschi,27 S. Metzler,26 C. Miao,20 T. Miao,7 G. Michail,11 R. Miller,21 H. Minato,37 S. Miscetti,9 M. Mishina,17 S. Miyashita,37 N. Moggi,27 E. Moore,22 Y. Morita,17 A. Mukherjee,7 T. Muller,16 P. Murat,27 S. Murgia,21 M. Musy,36 H. Nakada,37 I. Nakano,12 C. Nelson,7 D. Neuberger,16 C. Newman-Holmes,7 C.-Y. P. Ngan,19 L. Nodulman,1 A. Nomerotski,8 S. H. Oh,6 T. Ohmoto,12 T. Ohsugi,12 R. Oishi,37 M. Okabe,37 T. Okusawa,24 J. Olsen,40 C. Pagliarone,27 R. Paoletti,27 V. Papadimitriou,35 S. P. Pappas,41 N. Parashar,27 A. Parri,9 J. Patrick,7 G. Pauletta,36 M. Paulini,18 A. Perazzo,27 L. Pescara,25 M. D. Peters,18 T. J. Phillips,6 G. Piacentino,27 M. Pillai,30 K. T. Pitts,7 R. Plunkett,7 L. Pondrom,40 J. Proudfoot,1 F. Ptohos,11 G. Punzi,27 K. Ragan,14 D. Reher,18 M. Reischl,16 A. Ribon,25 F. Rimondi,2 L. Ristori,27 W. J. Robertson,6 T. Rodrigo,27 S. Rolli,38 L. Rosenson,19 R. Roser,13 T. Saab,14 W. K. Sakumoto,30 D. Saltzberg,4 A. Sansoni,9 L. Santi,36 H. Sato,37 P. Schlabach,7 E. E. Schmidt,7 M. P. Schmidt,41 A. Scott,4 A. Scribano,27 S. Segler,7 S. Seidel,22 Y. Seiya,37 F. Semeria,2 T. Shah,19 M. D. Shapiro,18 N. M. Shaw,29 P. F. Shepard,28 T. Shibayama,37 M. Shimojima,37 M. Shochet,5 J. Siegrist,18 A. Sill,35 P. Sinervo,14 P. Singh,13 K. Sliwa,38 C. Smith,15 F. D. Snider,15 J. Spalding,7 T. Speer,10 P. Sphicas,19 F. Spinella,27 M. Spiropulu,11 L. Spiegel,7 L. Stanco,25 J. Steele,40 A. Stefanini,27 R. Ströhmer,7a J. Strologas,13 F. Strumia, 10 D. Stuart,7 K. Sumorok,19 J. Suzuki,37 T. Suzuki,37 T. Takahashi,24 T. Takano,24 R. Takashima,12 K. Takikawa,37 M. Tanaka,37 B. Tannenbaum,22 F. Tartarelli,27 W. Taylor,14 M. Tecchio,20 P. K. Teng,33 Y. Teramoto,24 K. Terashi,37 S. Tether,19 D. Theriot,7 T. L. Thomas,22 R. Thurman-Keup,1 M. Timko,38 P. Tipton,30 A. Titov,31 S. Tkaczyk,7 D. Toback,5 K. Tollefson,19 A. Tollestrup,7 H. Toyoda,24 W. Trischuk,14 J. F. de Troconiz,11 S. Truitt,20 J. Tseng,19 N. Turini,27 T. Uchida,37 F. Ukegawa,26 J. Valls,32 S. C. van den Brink,28 S. Vejcik, III,20 G. Velev,27 R. Vidal,7 R. Vilar,7a D. Vucinic,19 R. G. Wagner,1 R. L. Wagner,7 J. Wahl,5 N. B. Wallace,27 A. M. Walsh,32 C. Wang,6 C. H. Wang,33 M. J. Wang,33 A. Warburton,14 T. Watanabe,37 T. Watts,32 R. Webb,34 C. Wei,6 H. Wenzel,16 W. C. Wester, III,7 A. B. Wicklund,1 E. Wicklund,7 R. Wilkinson,26 H. H. Williams,26 P. Wilson,5 B. L. Winer,23 D. Winn,20 D. Wolinski,20 J. Wolinski,21 S. Worm,22 X. Wu,10 J. Wyss,27 A. Yagil,7 W. Yao,18 K. Yasuoka,37 G. P. Yeh,7 P. Yeh,33 J. Yoh,7 C. Yosef,21 T. Yoshida,24 I. Yu,7 A. Zanetti,36 F. Zetti,27 and S. Zucchelli2
(CDF Collaboration)
1 Argonne National Laboratory, Argonne, Illinois 60439
2 Istituto Nazionale di Fisica Nucleare, University of Bologna, I-40127 Bologna, Italy
3 Brandeis University, Waltham, Massachusetts 02254
4 University of California at Los Angeles, Los Angeles, California 90024
5 University of Chicago, Chicago, Illinois 60637
6 Duke University, Durham, North Carolina 27708
7 Fermi National Accelerator Laboratory, Batavia, Illinois 60510
8 University of Florida, Gainesville, FL 32611
9 Laboratori Nazionali di Frascati, Istituto Nazionale di Fisica Nucleare, I-00044 Frascati, Italy
10 University of Geneva, CH-1211 Geneva 4, Switzerland
11 Harvard University, Cambridge, Massachusetts 02138
12 Hiroshima University, Higashi-Hiroshima 724, Japan
13 University of Illinois, Urbana, Illinois 61801
14 Institute of Particle Physics, McGill University, Montreal
H3A 2T8, and University of Toronto,
Toronto M5S 1A7, Canada
15 The Johns Hopkins University, Baltimore, Maryland 21218
16 Institut für Experimentelle Kernphysik, Universität Karlsruhe, 76128 Karlsruhe, Germany
17 National Laboratory for High Energy Physics (KEK), Tsukuba, Ibaraki 305, Japan
18 Ernest Orlando Lawrence Berkeley National Laboratory, Berkeley, California 94720
19 Massachusetts Institute of Technology, Cambridge, Massachusetts 02139
20 University of Michigan, Ann Arbor, Michigan 48109
21 Michigan State University, East Lansing, Michigan 48824
22 University of New Mexico, Albuquerque, New Mexico 87131
23 The Ohio State University, Columbus, OH 43210
24 Osaka City University, Osaka 588, Japan
25 Universita di Padova, Istituto Nazionale di Fisica Nucleare, Sezione di Padova, I-35131 Padova, Italy
26 University of Pennsylvania, Philadelphia, Pennsylvania 19104
27 Istituto Nazionale di Fisica Nucleare, University and Scuola Normale Superiore of Pisa, I-56100 Pisa, Italy
28 University of Pittsburgh, Pittsburgh, Pennsylvania 15260
29 Purdue University, West Lafayette, Indiana 47907
30 University of Rochester, Rochester, New York 14627
31 Rockefeller University, New York, New York 10021
32 Rutgers University, Piscataway, New Jersey 08855
33 Academia Sinica, Taipei, Taiwan 11530, Republic of China
34 Texas A&M University, College Station, Texas 77843
35 Texas Tech University, Lubbock, Texas 79409
36 Istituto Nazionale di Fisica Nucleare, University of Trieste/ Udine, Italy
37 University of Tsukuba, Tsukuba, Ibaraki 315, Japan
38 Tufts University, Medford, Massachusetts 02155
39 Waseda University, Tokyo 169, Japan
40 University of Wisconsin, Madison, Wisconsin 53706
41 Yale University, New Haven, Connecticut 06520
Abstract
We present a detailed description of a search for anomalous production of missing ET (), jets, leptons (), -quarks, or additional photons in events containing two isolated, central () photons with GeV. The results are consistent with standard model expectations, with the possible exception of one event that has in addition to the two photons a central electron, a high-ET electromagnetic cluster, and large . We set limits using two specific SUSY scenarios for production of diphoton events with .
PACS numbers 13.85Rm, 12.60.Jv, 13.85.Qk, 14.80.Ly
1 INTRODUCTION
In many models involving physics beyond the standard model (SM) [1], cascade decays of heavy new particles generate signatures involving missing transverse energy (), jets, leptons, gauge bosons (, , ), and possibly -quarks. Some examples are supersymmetry with a light gravitino [2], radiative decays to a higgsino-LSP [3] and models with large symmetry groups [4]. In the data taken during 1993-1995 by the CDF detector [5, 6] an ‘’ candidate event [7] was recorded. Supersymmetric models can explain the signature, for example, via the pair production and decay of selectrons via , (see Figure 2) or , (see Figure 2).


This paper describes a systematic search for other anomalous events by examining events with two isolated, central () photons with GeV which contain , jets, leptons (), -quarks, or additional photons [8]. The search is based on 85 pb-1 of data from collisions at TeV collected with the CDF detector.
The remainder of Section 1 is devoted to a description of the detector. Section 2 discusses the diphoton event selection, the efficiencies of the selection criteria, and the purity of the sample. Section 3 discusses a search for anomalous events in the sample. Section 4 discusses the candidate event. Section 5 discusses the possible standard model sources for the signature and estimates the number of events expected from each. Section 6 discusses the possible interpretations of this event and places limits on some of the models which have risen to explain it. Section 7 contains the conclusions.
1.1 Overview of the CDF detector
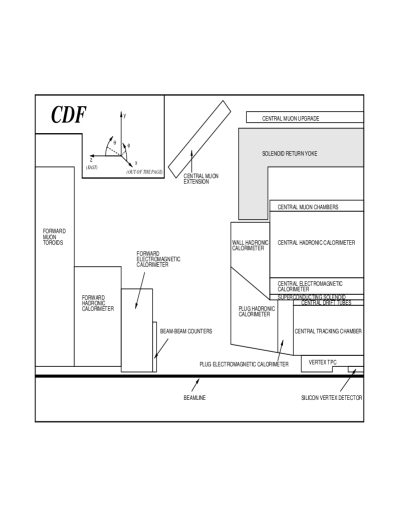
The CDF detector is an azimuthally and forward-backward symmetric magnetic detector designed to study collisions at the Fermilab Tevatron. A schematic drawing of the major detector components is shown in Figure 3. A more detailed description can be found in [5]; recent detector upgrades are described in [9]. The magnetic spectrometer consists of tracking devices inside a 3-m diameter, 5-m long superconducting solenoidal magnet which operates at 1.4 T. A four-layer silicon microstrip vertex detector (SVX) [9] makes measurements between the radii of 2.8 cm and 7.9 cm, and is used to identify hadron decays. A set of vertex time projection chambers (VTX) surrounding the SVX provides measurements in the - plane up to a radius of 22 cm, and is used to find the position of the interaction (). The 3.5-m long central tracking chamber (CTC), which provides up to 84 measurements between the radii of 31.0 cm and 132.5 cm, is used to measure the momentum of charged particles with momentum resolution ( in GeV/). The calorimeter, constructed of projective electromagnetic and hadronic towers, is divided into a central barrel which surrounds the solenoid coil (), ‘end-plugs’ (), and forward/backward modules (). Wire chambers with cathode strip readout give 2-dimensional profiles of electromagnetic showers in the central and plug regions (CES and PES systems, respectively). A system of drift chambers (CPR) outside the solenoid and in front of the electromagnetic calorimeters uses the 1-radiation-length thick magnet coil as a ‘preradiator’, allowing photon/ discrimination on a statistical basis by measuring the conversion probability [10]. Muons are identified with the central muon chambers, situated outside the calorimeters in the region .
To ensure that events are well measured, only events in which both photon candidates fall within the fiducial volume of the central electromagnetic calorimeter (CEM) are selected. The CEM is made of shower counters arranged in a projective tower geometry, with each tower composed of absorber sheets interspersed with scintillator. The towers are constructed in 48 wedges, each consisting of 10 towers in by one tower in . The position and transverse profile of a photon shower, within a tower, is measured using the CES which is embedded near shower maximum at approximately 6 radiation lengths. These chambers have wires in the view and cathode strips in the view. To be in the fiducial region, the shower position is required to lie within 21 cm of the tower center ( cm) in the view so that the shower is fully contained in the active region. The region , where the two halves of the detector meet, is excluded. The region 0.77 is uninstrumented because it is the penetration for the cryogenic connections to the solenoidal magnet. In addition, the region 1.0 is excluded because of the smaller depth of the electromagnetic calorimeter in the region. Within the angular region 0.05 and 0 the fiducial coverage is roughly 87% per photon. For low-ET photons ( 22 GeV) the fiducial region is reduced to cm to be consistent with the trigger requirements. The tight fiducial region coverage is approximately 73% for low-ET photons.
The CDF detector is a relatively well-understood measuring instrument and there exist standard identification selection criteria for electrons, muons, taus, -quarks, and jets that were developed for, among other things, the discovery of the top quark and studies of its properties. Descriptions for these criteria can be found in Refs. [11, 12, 13, 14, 15]. Photon identification [10] is described in more detail in Section 2. The calculation used in this search has been customized for this analysis and is described in Section 3.
2 Data Selection and Photon Identification
Events are selected based on the identification of two photon candidates in the central region of the CDF detector, . The final selection criteria are listed in Table 1 and are described below. The central region contains calorimeters and tracking chambers, and since the interaction of a high energy photon with the detector is similar to that of an electron, many of the same techniques for identifying electrons are used to identify isolated photons [10, 12]. The calorimeters are used to measure the 4-momentum of the photon as well as to distinguish between photons produced directly in the collision and those which are produced in the decay of hadrons, such as . The tracking chambers are used to provide additional rejection against jets of hadrons as well as electrons.
| Photon Identification and Isolation Cuts | |
|---|---|
| Central | |
| 1 3D tracks pointing at the cluster, PT 1 GeV | |
| 2.0 | |
| E ( GeV) | |
| E GeV) | |
| 12 GeV 22 GeV | 22 GeV |
| Low-Threshold Trigger | High-Threshold Trigger |
| Tight Fiducial | Loose Fiducial |
| E 4 GeV | HadEM 0.055 + 0.00045E. |
| 0.10 | |
| P in a cone of 0.4 5 GeV | |
| Global Event Cuts | |
| 60.0 cm | |
| ET out-of-time = 0 GeV | |
The initial data sample for the search consists of events with two photon candidates selected by the three-level trigger [16]. At Level 1, (L1), events are required to have two central electromagnetic calorimeter (CEM) trigger towers [17] which measure more than 4 GeV. At Level 2 (L2), two triggers, one optimized for good background rejection at low and the other for high efficiency at high , are ‘OR’d. The low-threshold diphoton trigger requires two electromagnetic clusters [11] with GeV and less than 4 GeV in a 3-by-3 array of trigger towers around the cluster (E); the high-threshold (16 GeV) trigger has no isolation requirement. Corresponding Level 3 (L3) triggers require cluster energies calculated with the offline photon algorithm [10] to be above the 10 and 16 GeV thresholds respectively. The low-threshold trigger also requires the clusters be in a restricted fiducial region of the calorimeter to ensure a good cluster measurement in the strip chambers.
2.1 Photon Identification
Photon candidates are identified as electromagnetic clusters of energy deposited in the central electromagnetic calorimeter and are required to be consistent with being produced from a single prompt photon shower [10]. To reject against backgrounds from electrons and hadronic jets, each candidate is required to pass the identification selection criteria of Table 1. Electrons, which have shower characteristics similar to those of photons, can be removed by identifying the associated track. Hadronic jets, which can contain photons from neutral meson decays, can be removed since they typically contain multiple particles that can be identified by the calorimeter and/or tracking chamber.
Electrons and charged hadrons can be rejected by the presence of their tracks pointing at a photon candidate. Each photon candidate is required to have no charged track pointing at it. However, to reduce the inefficiency due to unrelated particles, a single track is allowed to point at the cluster if the track has a measured P 1 GeV.
The ratio Had/EM of the energy in the hadronic towers of the photon cluster (Had) to the energy in the electromagnetic towers in the photon cluster (EM) is used to reject hadronic backgrounds [12]. Electromagnetic showers deposit most (typically ) of their energy in the electromagnetic calorimeters, while hadron showers in general deposit energy in both the hadronic and electromagnetic compartments. For events with both photons with 22 GeV, each photon is required to have HadEM 0.055 + 0.00045Eγ.
The shower shape measured in the CES is used to distinguish between single photon and the remaining hadronic backgrounds. A test is used to separately compare the energy deposited in the view and in the view to that expected from test beam data [10]. The average of the two measurements, , is required to be below 10. To reject cosmic rays, the measured shower shape for each candidate in the CES is fitted to that expected from the measured CEM energy and vertex position. The result of the comparison, , is required to be within 2 standard deviations from expectations.
2.2 Photon Isolation
Photons from the radiative decays of heavy new particles are, in general, expected to be “isolated,” that is, they are not expected to be produced in association with other nearby particles. A number of different isolation variables help reduce hadronic jet backgrounds (see Table 1).
The energy in a 3x3 trigger tower array [17] around the primary tower (in both the hadronic and electromagnetic calorimeters, but not including the primary electromagnetic tower) is summed and is referred to as E. A requirement of E4 GeV is imposed both at the trigger level and offline on each photon if either photon candidate has 22 GeV. For high energy photons, the leakage of the shower into the hadronic compartments makes this requirement inefficient, and it is removed if both photons have GeV.
The cluster isolation, , is similar to the trigger tower isolation, but is more efficient for higher energy photons since it scales with the photon energy. The variable is defined as
| (1) |
where is the sum of the electromagnetic and hadronic transverse energies in all of the towers (including those in the photon cluster) in a cone of centered around the photon cluster, and is the electromagnetic transverse energy in the photon cluster. For events with both photons with 22 GeV, each photon is required to have 0.1.
While there may be no track pointing directly at the cluster, tracks near the cluster may indicate that the cluster is due to a jet. The track isolation is defined as the scalar sum of the transverse momenta of all tracks in a cone of radius =0.4 in space centered on the photon. For events with both photons with 22 GeV, each photon is required to have the sum be less than 5.0 GeV.
To remove photons from production, photon candidates which have a second electromagnetic cluster, as measured by the strip chambers, are rejected. To maintain a constant efficiency for all photon energies separate requirements for low energy and high energy photon candidates are made [18]:
| (2) |
for , and
| (3) |
for .
2.3 Additional Event Requirements
In addition to the photon identification and isolation requirements, there are cuts on the primary vertex and on the time of the energy deposited in the calorimeter to ensure that events are well measured and are not due to cosmic ray sources.
To maintain the projective geometry of the detector, only events in which the primary vertex occur near the center of the detector are selected. The position, in , of the primary event vertex, , is measured by the vertex tracking chamber (VTX). The positions of the interactions are distributed around the nominal interaction in an approximately Gaussian distribution with cm. A requirement of 60 cm is used.
To reduce cosmic ray interaction backgrounds which might occur during an event, requirements are made on the time of arrival of energy in the hadronic calorimeter. The typical time-of-flight for relativistic particles to travel from the interaction point at the center of the detector to the calorimeter is approximately 7 nsec. Since every tower in the central hadronic calorimeter has timing information associated with the energy deposited [5], all energy deposited at time must occur within a 28 nsec window around the nominal collision time, , and corrected for the time of flight to be considered ‘in time’ with the collision. The window is defined by
| (4) |
The event is rejected if any tower has more than 1 GeV deposited outside the timing window.
2.4 Final Offline Selection
The final offline event selection criteria are listed in Table 1. The two different sets of selection criteria correspond to the two trigger paths and allow the efficiencies to be well measured. The low-threshold criteria require both photons to have GeV (where the 10 GeV trigger becomes 98% efficient) while the high-threshold criteria are used if both photons have 22 GeV (where the 16 GeV trigger becomes 98% efficient). The final data set consists of events.
2.5 Efficiency of the Selection Criteria
The efficiencies of the selection criteria listed in Table 1 are measured using electrons. Two samples of electrons from events are used: one from the data and one generated using the PYTHIA Monte Carlo generator [19] and a detector simulation. Each sample is composed of events with one electron candidate in the fiducial region which passes tight identification and isolation criteria, a second candidate in the fiducial region with GeV and a matching track with P GeV. As shown in Ref. [12], an additional requirement on the invariant pair mass, M, within 10 GeV of the mass produces a fairly pure and unbiased sample of electrons which can be used to measure the efficiency of the selection criteria. As a check, the efficiency for each requirement is also calculated using a second sample of events with M GeV. Differences between data and Monte Carlo are quantified as corrections, , to the data.
The efficiencies of the identification and isolation selection criteria are shown in Figures 5, 5 and 6 as a function of . Figure 6 shows that the ratio of efficiencies is fairly flat as a function of ET.


The distribution in the shower shape variable for rejecting cosmic rays, , is different for electrons and photons and is not well modeled in the detector simulation. The efficiency is estimated from the data and taken to be . The requirement is not used in Monte Carlo simulations, so no correction is made.
An additional systematic uncertainty is estimated as half the range of efficiencies as a function of (5%) and is added in quadrature with the statistical uncertainties. The total photon identification (ID) and isolation (Iso) efficiency is and is measured to be and . The correction to the efficiency for detecting both photons, , to be used in Section 6, is determined using:
| (5) |
The measured values are for the low-threshold and high-threshold selection criteria, respectively.

Additional corrections are made for data and Monte Carlo differences in the vertex and Energy-Out-of-Time (ETOUT) distributions. The efficiency of the vertex requirements are estimated to be , and which gives . Since the Energy-Out-of-Time (ETOUT) distribution is not simulated in the Monte Carlo, the efficiency and correction are taken to be .
The efficiencies of the diphoton triggers are measured using independent triggers. Figure 8a shows the efficiency of the L2 low-threshold trigger as a function of the isolation energy in a 3-by-3 array of trigger towers around the cluster, E. Figure 8b shows the trigger efficiency as a function of ; the efficiency is flat as a function of above 12 GeV. Above 12 GeV the trigger efficiency is taken to be %. The trigger efficiencies for the L2 trigger and the L2-L3 high-threshold trigger path are shown in Figure 8. The efficiency is flat as a function of above 22 GeV. Above 22 GeV the trigger efficiency is taken to be %.


2.6 Purity of the Diphoton Sample
Since the purity of the sample is of less importance than the efficiency for searches for anomalous events, the selection criteria have been chosen to have high efficiency. Even after requiring each photon to pass all of the selection criteria, there are still a substantial number of background events in the sample. The backgrounds are primarily due to hadronic jets which contain pions, kaons or etas, each of which can decay to multiple photons.
To estimate the photon backgrounds, each photon candidate is compared to the single photon hypothesis and the background hypothesis in a manner similar to that in Ref. [10]. For candidates with GeV, the strip chamber system can distinguish the difference between a single and . For higher energies, GeV, the two photons cannot be resolved in the CES. Instead, the central preradiator system (CPR) is used to measure the conversion probability in the magnet coil. In both cases, it is not possible to separate prompt photons and backgrounds on an event-by-event basis. However, standard techniques allow the extraction of purity information on a statistical basis in large samples. Using these techniques on both candidates the average purity of the photon sample is estimated to be ()% prompt diphoton events.
3 Searches for Deviations from Standard Model Predictions
Each of the events in the diphoton sample is searched for the presence of , jets, electrons, muons, taus, -quarks, or additional photons. Deviations from standard model predictions are searched for using two values of the photon thresholds: GeV and GeV. The =12 GeV threshold has better acceptance for low- decays to photons, but has more background. The GeV threshold accepts many fewer standard model events and so has better discrimination for high- decays.
3.1 Missing ET
The standard method for inferring the presence of particles that do not interact in the calorimeter, such as neutrinos, is measuring the missing transverse energy () in the event [11]. The is corrected for the measured detector response to jets and takes into account cracks between detector components and nonlinear calorimeter response [13, 20]. In addition, the is corrected for the presence of muons, which do not deposit their total energy in the calorimeter [13].

While the corrections improve the resolution on average, some events still have a substantially mismeasured . Many of these events can be removed by rejecting events which have a jet with GeV pointing within 10∘ in azimuth of the . Since this requirement introduces an unnecessary inefficiency and a possible bias when searching for leptons, bosons, or jets, it is only imposed when searching for the presence of and in making all plots. The requirement removes only 48 of the 2239 events in the sample.
The resolution is measured using a fairly pure sample of events. Events are selected if they have two electrons, each passing the standard requirements, and Mee within 10 GeV of the mass of the [21]. The resolution is plotted in Figure 9 as a function of where . In the region the distribution is well-parameterized by
| (6) |
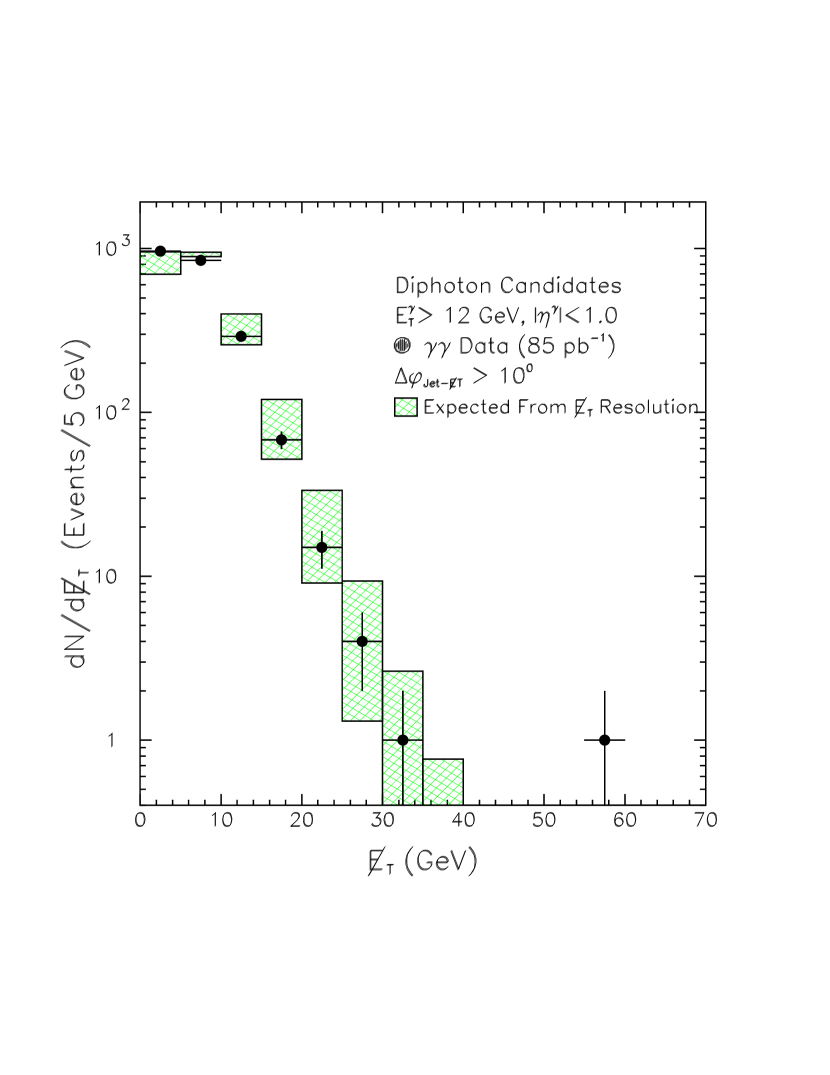
Standard model diphoton events have no intrinsic ; thus the expected distribution can be predicted from the resolution alone. This has the advantage that the estimate is determined from the data. The expected distribution is estimated by smearing the X and Y components of the true (assumed to be zero) by the resolution (estimated from on an event-by-event basis). The systematic uncertainty on the distribution is found by varying the resolution within its uncertainty.
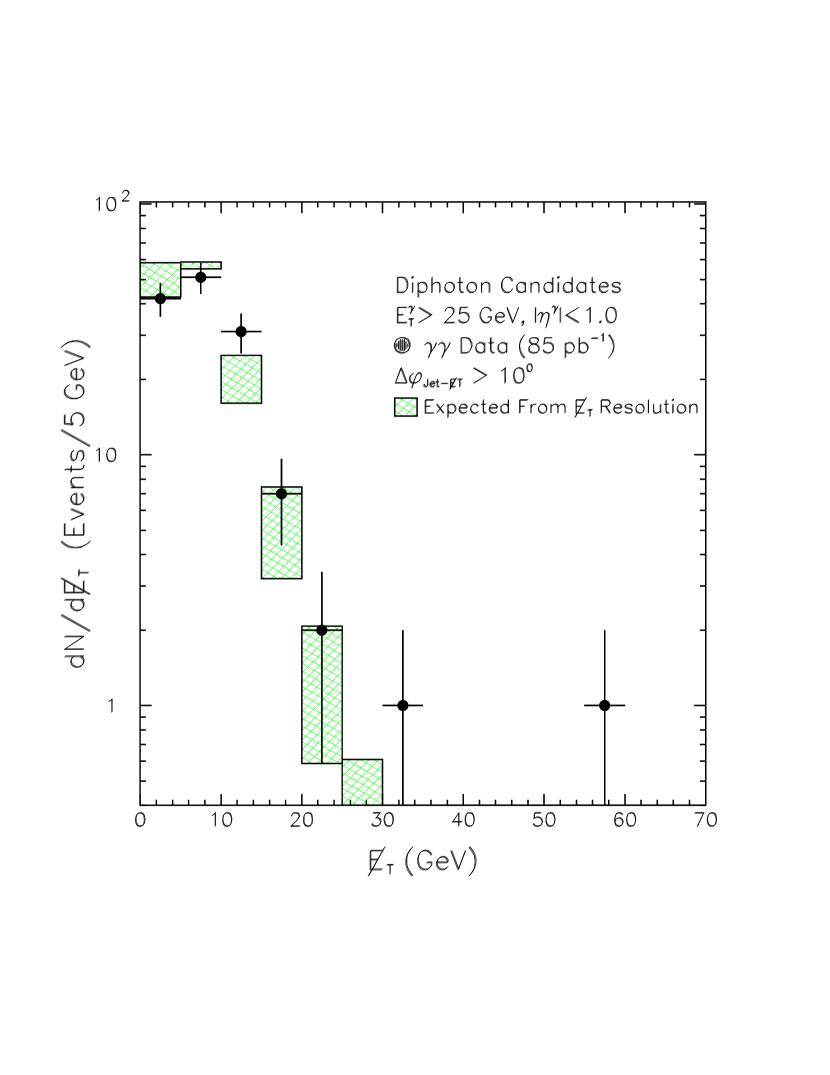
The data are shown along with the expectations from the resolution simulation in Figures 11 and 11. With the exception of one event on the tail on the distribution, the ‘’ candidate event [7] ( GeV), the data agree well with the expectations. For a photon ET threshold of 12 GeV one event with GeV is observed, with a expectation of events. For a photon threshold ET of 25 GeV, two events are observed with GeV, with events expected. The candidate event will be discussed in more detail in Section 4. The other event has both photons above 25 GeV and GeV. However, on close inspection, it appears to be due to two mis-measurements. The event contains an energetic jet ( = 44 GeV) which points directly at the region between the plug and forward calorimeters and near the in and is therefore likely to be significantly mismeasured. Moreover, one of the photons is at the edge of the fiducial region and may be undermeasured [22], causing the position of the to be just far enough away from the jet to pass the requirement. The 4-vectors of the event are given in Table 2.
| Run 67397, Event 47088 | |||||
|---|---|---|---|---|---|
| Px | Py | Pz | E | ET | |
| (GeV/c) | (GeV/c) | (GeV/c) | (GeV) | (GeV) | |
| -85.8 | 1.6 | 63.4 | 106.7 | 85.8 | |
| 30.8 | -15.9 | 6.4 | 35.3 | 34.7 | |
| 40.1 | 18.8 | 237 | 242 | 44.4 | |
| 33.6 | -5.5 | – | – | 34.1 | |
3.2 Jets
To search for anomalous production of quarks and gluons, the number of jets, NJet, is counted in a manner identical to that used in the top-quark discovery in the dilepton channel [13, 20]. Each jet is required to have uncorrected E GeV and . The distributions in the number of jets are shown in Figures 13 and 13 for photon ET thresholds of 12 GeV and 25 GeV respectively.


While there are cross section predictions for , jet and jet production [23], there is currently no theoretical prediction for higher jet multiplicities. However, it has been known for some time that the ratio between -jet and -jet cross sections for and production can be approximated by a constant [24],
| (7) |
where is either a or a . This has been confirmed within resolution in the CDF data [25] and is expected to hold for most processes since additional jets are typically due to initial-state and final-state radiation.
To look for anomalous NJet production in the data, an exponential fit for small values of NJet is used to extrapolate to the large NJet region. For diphoton events with GeV and N the parameterization predicts events with 4 or more jets; 2 events are observed. For diphoton events with GeV and N, the parameterization predicts events with 3 or more jets; events are observed.
3.3 Electrons and Muons
Electrons and muons produced in association with photon pairs are required to be isolated, have E GeV, and be in the central part of the detector (). They are identified with the same identification and isolation selection requirements used in the top-quark discovery [13]. A total of 3 events with a central electron or muon are found in the data. The first event has two muons and two photons. This event (see Table 3) is consistent with a double-radiative decay, , since the 4-body invariant mass is GeV/c2. The second event (see Table 4) has a single electron. This event is also likely to be due to the decay of a boson because GeV/c2 and there is some indication in the SVX that there is a charged particle traveling in the direction of . The third event is the ‘’ candidate event and will be discussed further in Section 4. Only the ‘’ candidate event passes the photon threshold of GeV.
| Run 69571, Event 769815 | |||||
|---|---|---|---|---|---|
| Px | Py | Pz | E | ET | |
| (GeV/c) | (GeV/c) | (GeV/c) | (GeV) | (GeV) | |
| 12.4 | 5.3 | -1.4 | 13.5 | 13.4 | |
| -16.0 | -5.3 | -3.2 | 17.1 | 16.8 | |
| 28.2 | 9.5 | -33.4 | 44.7 | 29.7 | |
| -26.5 | -4.9 | -14.9 | 30.8 | 27.0 | |
| 7.1 | -0.3 | – | – | 7.1 | |
| Run 63541, Event 304680 | |||||
|---|---|---|---|---|---|
| Px | Py | Pz | E | ET | |
| (GeV/c) | (GeV/c) | (GeV/c) | (GeV) | (GeV) | |
| -13.7 | -19.9 | -28.8 | 37.6 | 24.2 | |
| -9.8 | -13.1 | -10.1 | 19.2 | 16.3 | |
| 19.7 | 35.0 | 5.0 | 40.4 | 40.1 | |
| -4.3 | 0.4 | – | – | 4.4 | |
The dominant standard model sources of extra leptons in events is inclusive and production and decay. Diagrams include and . These processes, where is an electron, muon or tau, are simulated using the PYTHIA [19] Monte Carlo and a detector simulation and checked using the MADGRAPH [26, 27] Monte Carlo. The Monte Carlo estimates events in the data.
A source of events which is not correctly simulated with the Monte Carlo is where one of the electrons is identified as a photon. This can occur if the electron emits a photon via bremsstrahlung (the photon carries away most of the energy and the electron is lost in the detector) or the track of the electron is not found by the central tracking chamber. The rate at which electrons are misidentified as a photon is determined from a sample of events from the data and is estimated to be ()% per electron. The total number of events expected from this source is estimated from data to be .
Summing the above sources gives an expectation of events in the GeV data. Similarly, for the photon threshold of GeV these methods predict a total of 0.10.1 events, dominated by events in which electrons fake photons. The dominant mechanism for producing events is dominated by inclusive production and decay. The PYTHIA Monte Carlo predicts a total of events to be observed in the data.
3.4 Taus
Hadronic decays of a lepton produced in association with diphotons are identified using standard identification criteria [14] and are required to have E 25 GeV and . One candidate (see Table 5) is observed in the data with GeV; none with GeV. The dominant source of SM candidate events is from hadronic jets produced in association with diphoton pairs which fake the hadronic decay signature. This rate is estimated using the methods of Ref. [14]. Figure 15 shows the ET spectrum for leptons measured in the data as well as for backgrounds from fake ’s. A total of events where a jet fakes a are expected in the data for GeV, and 0.030.03 events for GeV; both are consistent with observation.
| Run 66392, Event 23895 | |||||
|---|---|---|---|---|---|
| Px | Py | Pz | E | ET | |
| (GeV/c) | (GeV/c) | (GeV/c) | (GeV) | (GeV) | |
| 3.6 | 23.3 | 3.9 | 23.9 | 23.6 | |
| -11.5 | 15.4 | 5.6 | 20.0 | 19.2 | |
| 14.6 | -20.7 | 26.3 | 36.6 | 25.4 | |
| -13.5 | -9.2 | 11.3 | 20.2 | 16.6 | |
| 19.1 | 6.4 | 33.5 | 39.4 | 20.3 | |
| -12.7 | -7.0 | – | – | 14.5 | |
3.5 -Quarks
Jets from -quarks are identified using the -tagging jet algorithm (SECVTX) developed for the top-quark discovery [13, 15]. Two candidate events are observed in the data with GeV; none with GeV. Quark and gluon jets produced in association with diphoton pairs are real and fake sources of -jets. The number of events from these sources is estimated using the same methods as developed for the top-quark discovery [13, 15, 28]. Figure 15 shows the ET spectrum of the -tagged jets and the expectations from the background prediction. A total of events are expected to be in the sample due to real and fake sources of for GeV; 0.10.1 events are expected for GeV. The 4-vectors of the objects in the two events are given in Tables 6 and 7.


| Run 63033, Event 337739 | |||||
|---|---|---|---|---|---|
| Px | Py | Pz | E | ET | |
| (GeV/c) | (GeV/c) | (GeV/c) | (GeV) | (GeV) | |
| -21.6 | -8.2 | -16.7 | 28.5 | 23.1 | |
| -14.3 | -22.1 | -12.8 | 29.3 | 26.4 | |
| -jet | 44.8 | 40.8 | 37.6 | 71.8 | 61.0 |
| 4.9 | 13.0 | 12.4 | 18.6 | 13.9 | |
| -4.0 | -4.5 | – | – | 6.1 | |
| Run 64811, Event 62109 | |||||
|---|---|---|---|---|---|
| Px | Py | Pz | E | ET | |
| (GeV/c) | (GeV/c) | (GeV/c) | (GeV) | (GeV) | |
| -7.1 | 20.2 | -11.1 | 24.1 | 21.4 | |
| -23.6 | 9.5 | -10.8 | 27.6 | 25.4 | |
| -jet | 37.6 | 48.6 | -4.1 | 62.2 | 62.0 |
| 4.1 | -67.5 | 17.5 | 70.4 | 68.1 | |
| -8.8 | -5.6 | -16.6 | 19.6 | 10.4 | |
| -0.9 | -12.8 | – | – | 12.9 | |
3.6 Additional Photons
To search for events with additional photons with E GeV, events are required to have three photons which pass the selection criteria in Table 1. One photon must have E GeV and pass the high-threshold requirements, any two other photon candidates in the event must both pass the same selection criteria (low-threshold or high-threshold) so as to trigger the event. No events are observed with more than two photons. The expected rate is dominated by jets which fake the photon signature and is estimated using a method similar to that in used in Ref. [14]. The average rate at which jets fake the photon signature is approximately /jet and is essentially flat as a function of ET for EGeV. A total of events are estimated to be in the sample due to + fake for GeV; 0.010.01 for GeV. The ET spectrum for photon background sources in which jets fake additional photons is shown in Figure 16.
3.7 Summary of the Searches
Table 8 summarizes the observed and expected numbers of events with , NJets, additional leptons, -tags or photons. With the one possible exception of the candidate, the data appear to be well predicted by the background expectations [29]. The candidate event is discussed in the next Section.

| GeV Threshold | |||
|---|---|---|---|
| Object | Obs. | Exp. | Ref. |
| GeV, | 1 | – | |
| N, GeV, | 2 | – | |
| Central or , GeV | 3 | [13] | |
| Central , GeV | 1 | [14] | |
| -tag, GeV | 2 | [13] | |
| Central , GeV | 0 | – | |
| GeV Threshold | |||
| Object | Obs. | Exp. | Ref. |
| GeV, | 2 | – | |
| N, GeV, | 0 | – | |
| Central or , GeV | 1 | 0.1 0.1 | [13] |
| Central , GeV | 0 | 0.03 0.03 | [14] |
| -tag, GeV | 0 | 0.1 0.1 | [13] |
| Central , GeV | 0 | 0.01 0.01 | – |
4 The Candidate event
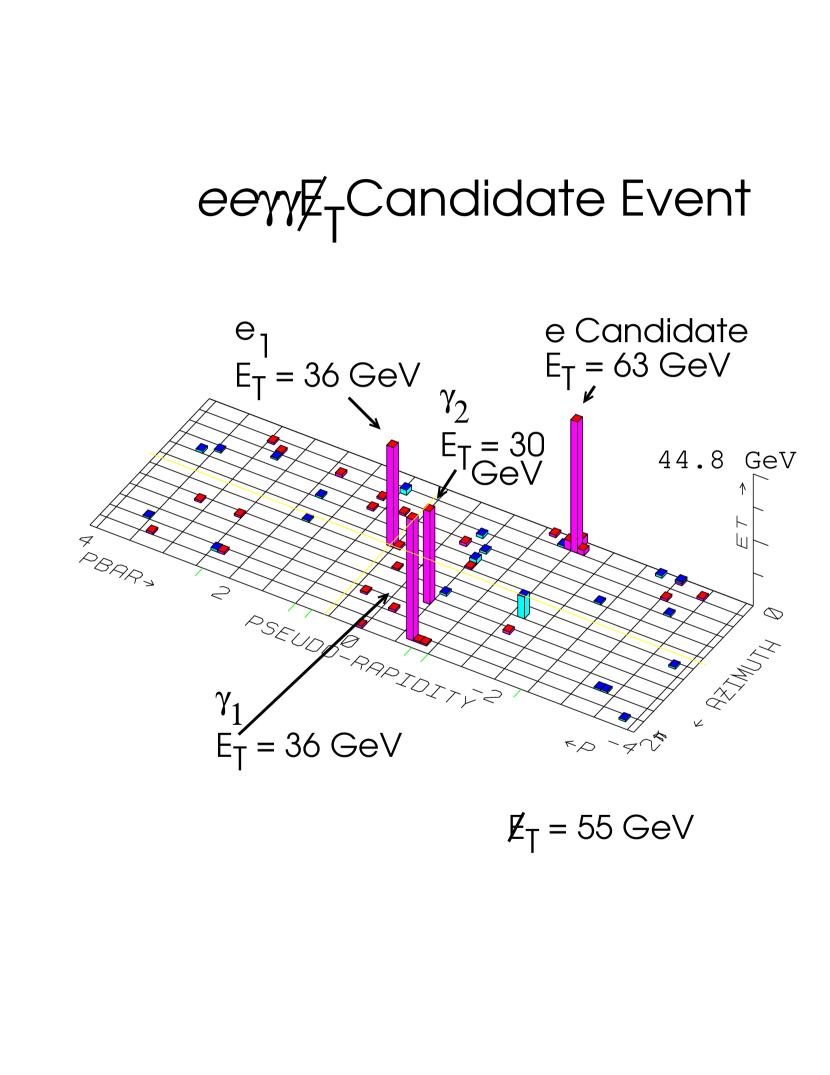
The ‘’ candidate event [7], shown in Figure 18, consists of two high- photons, a central electron, an electromagnetic cluster in the plug calorimeter with = 63 GeV which passes the electron selection criteria used for identification [12], and the largest ( GeV) in the diphoton sample. While the event is unexpected from the standard model, it could also be due to one or more detection pathologies [30]. In addition to a detailed study of the event, its properties are compared to a control sample of 1009 well-measured events.
4.1 The Interaction Vertex
The primary vertex, determined using the track from the central electron, is situated at cm. The scalar sum of the transverse momentum of the 14 tracks associated with the vertex is 40.6 GeV and includes 31.8 GeV due to the electron in the central calorimeter. Since there is no track associated with a photon and the calorimeter has no pointing capabilities, the position of the vertex for the photons cannot be determined. Similarly, since there is no CTC track for the cluster in the plug calorimeter [31], its vertex cannot be determined.
There are three other vertices in the event which are typical of soft collisions [32] and are described in Table 9. The instantaneous luminosity, , during this particular part of the run was measured to be ; at this luminosity there should be, on average, 2.5 primary vertices. There is no indication that the electron candidates, photon candidates or the missing transverse energy are due to anything other than the single collision which occurred at cm.
| of tracks | |
|---|---|
| associated with the vertex | |
| 20.4 cm | 40.6 GeV |
| -8.9 cm | 1.3 GeV |
| -38.9 cm | 5.0 GeV |
| -33.7 cm | 5.4 GeV |
4.2 Timing Information
As described in Section 2.3, every tower in the central hadronic calorimeter has timing information associated with any energy deposited. Any tower with energy deposited out of time with the collision might indicate the presence of a cosmic ray interaction in the event. No tower in the candidate event has more than 1 GeV of energy deposited outside the timing window. Timing information for clusters in the central electromagnetic calorimeter can be found if the shower also deposits energy in the hadronic calorimeters. The electron arrival time distribution of Figure 18 and has a resolution of nsec. In contrast, cosmic rays [33] have an arrival rate which is flat in time and extends to large times (see Figure 18b). In the candidate event only the central electron and one of the photons ( in Table 14) have associated timing information [34]. The arrival times of the clusters are measured to be 15 nsec and 18 nsec after the nominal collision time respectively, well within expectations, and consistent with each other. There is no indication that any of the energy deposited in the event is due to a cosmic ray interaction in the detector.

4.3 The Central Electron
The electron in the central calorimeter passes all the standard electron identification and isolation requirements used in top-quark studies [13]. The measured values of the identification variables as well as the selection criteria are given in Table 10.
| Requirement | Value |
|---|---|
| E 25 GeV | ET = 36.4 GeV |
| E/P 1.8 | E/P= 1.15 |
| Had/EM 0.05 | Had/EM = 0.026 |
| Lshr 0.2 | Lshr= -0.007 |
| 10.0 | = 2.13 |
| 1.5 cm | = 0.02 cm |
| 3.0 cm | = -0.50 cm |
| 5.0 cm | = 1.31 cm |
| 60.0 cm | = 20.4 cm |
| Fiducial | Yes |
| 0.1 | = 0.02 |
4.4 The Central Photons
Both photon candidates in the event pass all the selection requirements in Table 1. The values of the variables used in the selection, as well as the selection criteria, are shown in Table 11. While it is true that the purity of the sample is low (()%), it is not possible to determine if these photons are directly produced or are from a decay except on a statistical basis. The fact that the showers pass the selection criteria (in particular the and requirements) implies that the showers are consistent with coming from the interaction region.
| Photon 1 | |
|---|---|
| Requirements | Value |
| E 22 GeV | ET = 36 GeV |
| 1 3D tracks, PT 1 GeV | # 3D Tracks = 0 |
| 2.0 | = -0.29 |
| E | E = 1.4 GeV |
| = 2.92 GeV | |
| Fiducial | Yes |
| HadEM 0.055 + 0.00045E | Had/EM = 0.012 |
| = 0.079 | |
| = 0.050 | |
| 5.0 | = 0.39 |
| Photon 2 | |
| Requirements | Value |
| E 22 GeV | ET = 32 GeV |
| 1 3D tracks, PT 1 GeV | # 3D Tracks = 0 |
| 2.0 | = -1.6 |
| E | E = 1.2 GeV |
| = 2.76 GeV | |
| Fiducial | Yes |
| HadEM 0.055 + 0.00045E | Had/EM= 0.012 |
| = 0.072 | |
| = 0.015 | |
| 5.0 | = 1.7 |
4.5 The Missing Transverse Energy
The missing transverse energy in the candidate event is measured to be 55 GeV. The scalar sum of the transverse energy deposited in the calorimeters is measured to be = 268 GeV. The majority of the transverse energy () is deposited in the four clusters in the electromagnetic calorimeters where the energy resolution is good [35]; The rest of the energy in the calorimeter is unclustered. To use the resolution method of Section 3.1, the is corrected by subtracting off all the electromagnetic clusters giving 100 GeV. Using Equation 6 yields 7 GeV for a final result of = GeV. As a check, the total of the 4-cluster system (which is well measured) is GeV, opposite to the and in good agreement with the measured magnitude. This is a further indication that the imbalance is not caused by spurious energy elsewhere in the detector. There is no indication that the is the result of a measurement pathology or due to a cosmic ray interaction.
4.6 The Electron Candidate in the Plug Calorimeter
The cluster in the plug electromagnetic calorimeter passes all the standard electron identification and isolation selection criteria used for identification [12]. In addition it passes all the requirements used to identify electrons in the region of the plug calorimeter used in the top-quark discovery [13, 36]. Table 12 and Figure 20 show a comparison of the values of the measured variables for the cluster to those of electrons from the control sample. The fact that the shower passes the selection criteria (in particular the = 1.3 and = 0.43 requirements) implies that the shower is consistent with being from a single, isolated electron emanating from the interaction point. However, a closer inspection reveals a possible discrepancy with the electron hypothesis.
| Requirement | Value |
| 25 GeV | = 63 GeV |
| 3.0 | = 1.3 |
| Had/EM 0.05 | Had/EM= 0.03 |
| E 0.1 | E0.05 |
| VTX occupancy 50% | VTX occupancy = 1.0 |
| Fiducial | Yes |
| Additional Selection Criteria used in the top-quark Analysis | |
| 15.0 | = 0.43 |
| 3D Track through | # Tracks = 0 |
| 3 CTC axial superlayers | |
4.7 A Problem with the Electron Interpretation
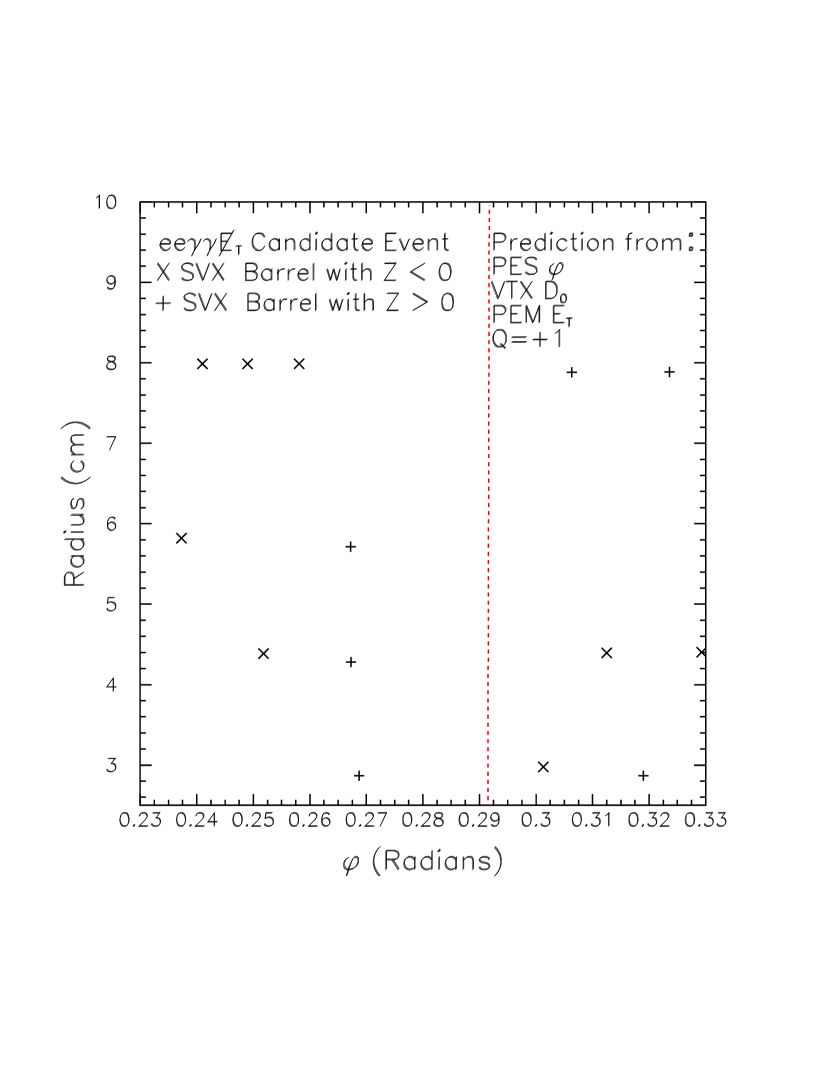
The tracking information along the trajectory between the primary vertex at cm and the cluster in the calorimeter indicates that the cluster is not due to an electron. Figure 20 shows the expected path of the particle as it passes through the SVX, VTX and CTC tracking chambers. The standard electron identification selection criteria only use the information from the CTC and VTX detectors. However, in this particular event there is no expectation of finding a track in the central tracking chamber because the trajectory only passes through the innermost layers [31].


4.7.1 VTX Tracking
The VTX is a system of eight octagonal time projection modules surrounding the beam pipe and mounted end-to-end along the beam direction. For every event tracking, with some resolution, provides a measurement of the vertex position as well as additional tracking information for individual charged particles. The standard electron identification requirements use a VTX occupancy measurement which is defined to be the ratio of the number of layers in the VTX in which the electron deposits charge divided by the number of layers in the VTX expected to be traversed by the electron, given the electron’s trajectory. The VTX does not provide a precision measurement of the trajectory and cannot distinguish between single and multiple particles. For more information on the VTX and electron identification see Refs. [5, 12].
The expected particle trajectory, from the vertex at cm to the cluster position at rad, , passes through the fiducial part of the VTX. A total of 7 hits are recorded with 7 hits expected for an occupancy of 100%. Figure 22 shows the VTX occupancy as a function of for rad, and as a function of for = -1.72. There appears to be at least one charged particle trajectory at the and of the cluster. The VTX information is completely consistent with the interpretation of the cluster as an electron.
4.7.2 SVX Tracking
The standard electron identification selection criteria do not use the SVX because the detector covers only the region cm. However, for interactions which occur within cm, the SVX can often be used to provide precision tracking for electrons [37]. For more details on the SVX as well as the ‘stub’-finding algorithms see Appendix A.
Figure 22 shows the between the measured position in the strip chambers (CES and PES respectively) and from SVX stubs found for electrons from the control sample. The two peaks correspond to the bending of positively and negatively charged electrons in the magnetic field.


In the candidate event, only the central electron and the electromagnetic cluster in the plug have stubs. For the electron in the central calorimeter, the measurement is consistent with the negative charge determination from the track in the central tracking chamber as shown in Figure 22. The stub for the cluster in the plug calorimeter is inconsistent with the interpretation of the cluster as an electron. The expected between the SVX stub and the measured position in the PES, due to bending in the magnetic field, is expected to be -2.6 mrad for a 63 GeV positron. The position, in , of the electromagnetic cluster as measured by the strip chambers in the plug calorimeter (PES) is rad, but there are no SVX clusters in the region 0.29 rad 0.30 rad in either SVX barrel as seen in Figure 24. However, the algorithm does pick up a three-cluster stub near the expected path which is in the barrel with (as would be expected for the trajectory). The stub appears to be well measured, but has rad ( mrad); again see Figure 22.
The non-observation of an SVX stub with the correct is unusual for an electron [38]. There is no indication of a mismeasurement in the calorimeter [39]. In the SVX there is a bad strip in the innermost layer (layer 0) at which may be along the trajectory. While this could cause the loss of a cluster, an electron typically deposits energy in multiple strips. The trajectory passes near a gap in layer 1 between silicon crystals at = 9.6 cm. These could possibly account for two of the three missing clusters. The SVX cluster-finding efficiency is due almost entirely to dead strips and gaps between crystals. With that efficiency, the average probability to miss all three clusters is ; however if the true trajectory passes through the two bad regions, the probability of losing the third cluster is only less than about 1% [40].
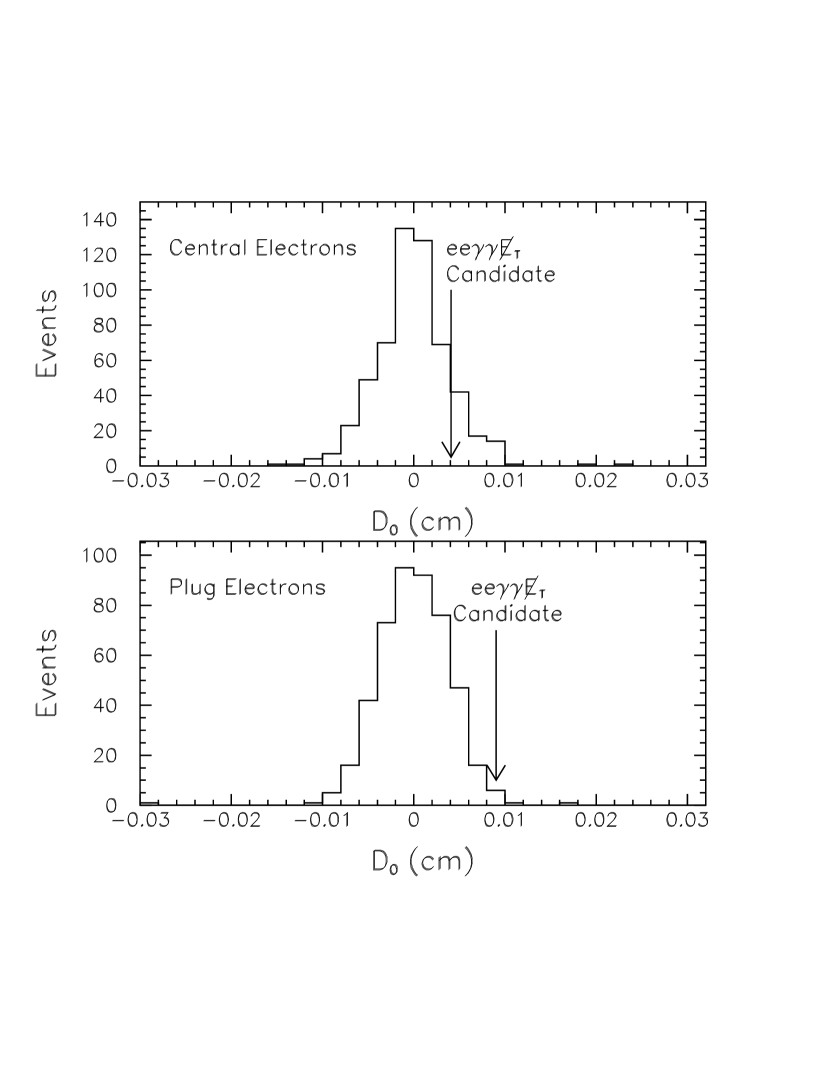
Prompt electrons should have an impact parameter, in the direction, with respect to the position of the collision consistent with zero. The distribution in the impact parameter of stubs associated with central and plug electrons from events is shown in Figure 24 along with the results for the electron candidates in the candidate event. While the stub associated with the central electron has a small impact parameter (46 m, the stub at rad has a large value, 9045 m, which is on the tail of the distribution but not inconsistent with the prompt hypothesis. However, the impact parameter measurement is dependent on the position and energy information from the calorimeter. If the stub is unrelated to the cluster, removing the constraints of calorimeter information from the tracking algorithm changes the impact parameter measurement to be m.
The tracking information is confusing and would be highly unusual for an electron (no others like it are found in the sample of 1009 well-measured plug electrons). Since there is no associated track in the central tracking chamber, it is not obvious that the stub has anything to do with the cluster in the calorimeter. Since there are no other large energy clusters in the region suggested by the stub, either this is an SVX or PES failure, or the stub is due to a low PT charged particle which is not distinguishable in the calorimeter. Based on the distribution of the events, the probability that this observation is due to an electron is estimated to be less than 0.3% at 95% C.L.
4.8 Interpreting the Electromagnetic Cluster
To summarize, the relevant experimental facts about the electromagnetic cluster in the plug calorimeter in the candidate event are:
-
1.
The cluster easily passes all the standard electron identification selection criteria.
-
2.
There are no SVX clusters in the region 0.29 rad 0.30 rad, with 3 expected. There is a bad SVX strip in layer 0 and a gap in the coverage in layer 1 which may lie along the trajectory and cause clusters to be lost. There is an SVX stub which is near the expected trajectory, but is not necessarily correlated with the plug cluster. The stub is well measured and appears to be due to a charged particle traveling at an consistent with the cluster. However, the probability for an electron to have rad between the stub and the cluster is estimated to be less than 0.3% at 95% C.L.
-
3.
Assuming the energy and position of the plug cluster are due to the particle which made this stub, the best-fit impact parameter of the SVX stub is 90m. While this is not inconsistent with the prompt electron hypothesis (a 2 deviation), the result is highly dependent on the calorimeter information. If the calorimeter information is removed from the SVX track finding algorithm, the best-fit impact parameter becomes m.
-
4.
The VTX occupancy indicates that there is at least one charged particle traveling in the direction of the PEM cluster (this could be the track associated with the SVX stub).
Possible sources of the cluster are discussed in the next Sections.
4.8.1 Two Interactions
One possibility is that the cluster or the SVX stub comes from a different interaction. As a check, the VTX and SVX results are investigated using the other vertices in the event; the results are summarized in Table 13. The trajectory from a vertex to the plug passes through the SVX fiducial region for only one other vertex; there are no stubs associated with it. The VTX occupancy along the trajectories from the other vertices do not indicate a better choice. There is no indication that the stub or cluster is from a different vertex.
| Vertex | SVX Clusters | VTX Occ | |
| (cm) | (Exp/Obs) | (m) | (Exp/Obs) |
| 20.4 | 3/3 | 9045 | 7/7 |
| -8.9 | 3/0 | - | 9/3 |
| -38.9 | 0/- | - | 10/7 |
| -33.7 | 0/- | - | 10/4 |
4.8.2 Anomalous Electron Detection
For example, an electron could emit an energetic photon, via bremsstrahlung, while traversing the detector, or the electron could have had an elastic scattering with a nucleus. If the photon emission or collision occurs after the electron leaves the SVX, then there should be at least two final state particles and the SVX stub should, by conservation of momentum, point to the energy-weighted mean of the energy deposition in the calorimeter (within the expected resolution and bending due to the magnetic field). No evidence for a second cluster is seen in the calorimeter. If the photon emission occurs before the electron reaches the SVX, then the initial direction of the electron must have been directly toward the center of the electromagnetic cluster (again by conservation of momentum). In this case the SVX stub is due to the electron going off with low momentum, and the electromagnetic cluster is due to the photon. However, the impact parameter would be roughly 5 times that observed. A final scenario is that the photon emission or collision occurs in the SVX. If this were the case, there should be a kink in the trajectory defined by the SVX hits and the primary vertex. No such deviation is seen.
4.8.3 Photonic Interpretation
The cluster could be a photon with a nearby, but unrelated, charged particle. Figure 22 shows that while the occupancy in the VTX has a local maximum at rad, it is above 0.5 for all values of . Thus, even if the SVX stub is due to an unrelated, low-momentum charged particle that causes the local maximum in the VTX, the cluster would, by a side band estimate, still not pass any reasonable photon VTX occupancy requirement. To estimate the probability that the SVX tracker might find a stub unrelated to the cluster in the plug, the SVX stub-finding algorithm is used. Instead of using the position of the cluster, the is varied between 0 and 2 in increments of 0.01 rad. A total of 8.4% of space has a good stub of which 1.8% is due to the stub at = 0.265 rad. It is thus not improbable to find an unrelated stub or high VTX occupancy in this event.
Another way to estimate the probability for a photon to have an SVX stub and high VTX occupancy is to use the central photon sample from Section 2 but with the additional requirement of E 20 GeV. There are 268 events in the sample for a total of 536 photons. Figure 26 shows the VTX and the distributions for the photons in the sample. A total of 277 photons pass through the fiducial region of the SVX, 16 have an SVX stub and 6 have 0.03 rad (). A total of 58 of the 536 photons have a VTX occupancy greater than 50% (). The bottom part of Figure 26 shows that most of the photons with a stub have low VTX occupancy. No event with 0.03 rad has a VTX occupancy greater than 0.5 indicating that there is no correlation (at low statistics) between large VTX occupancy and large [41]. While the cluster could be due to a photon with a soft track nearby, it is an unusual example as estimated by the diphoton sample, and the hypothesis cannot be proved or excluded.
4.8.4 Hadronic decay
The cluster could be due to the hadronic (1-prong) decay of a lepton. For example, the decay produces a which could generate the SVX stub and VTX occupancy, and a which decays via and could generate a calorimeter cluster that is largely electromagnetic energy and that passes the remaining electron identification selection criteria. However, most hadronic decays will not shower predominantly in the electromagnetic calorimeter. The cluster in the event deposits roughly 180 GeV in the electromagnetic calorimeter and only 5 GeV in the hadronic calorimeter. The probability that a might fake the electron signature, but not be from the decay chain, is estimated using a Monte Carlo to simulate a sample of ’s with a one-prong decay (excluding the electron and muon decays) interacting with the plug calorimeter [42]. Unfortunately, the detector simulation does not correctly model the VTX occupancy or the variables in the calorimeter or strip chambers in the plug, each of which provide rejection against the hadronic decays. To avoid an underestimate of the probability, the simulated cluster is not required to pass these requirements. The top part of Figure 26 shows the electromagnetic fraction of the energy of clusters produced by the . The rate at which events pass the Had/EM and calorimeter isolation selection criteria (corrected for the 50% one-prong branching fraction [43]) is plotted in the bottom of Figure 26 as a function of the ratio of reconstructed cluster energy to the original energy. For most of phase space the fake rate is flat, typically around 3%; however at the end points it rises to almost 10%.


While the cluster in the PEM could be due to the hadronic decay of a , and there is no evidence to the contrary, this would be an unusual example as estimated by the Monte Carlo. Furthermore, it would in general increase the since only 20%-100% of true energy is deposited in the calorimeter. Ignoring additional tracking information from the SVX and VTX, as well as potential rejection power from the calorimeter, the probability of a to pass the electron selection criteria is conservatively estimated to be less than a few percent.
4.8.5 Jet Interpretation
A jet associated with the event, either as part of the partonic process or from initial or final state radiation, could fluctuate to pass all the electron selection criteria. The rate at which a jet passes the electron selection criteria is estimated using a method similar to that in Ref. [14] The fake-rate per jet is consistent with being a constant for jets with E GeV with a probability of approximately /jet. Thus, although the cluster could be due to a jet which fluctuated to pass the electron selection criteria it would be an unusual example.
4.8.6 Conclusion
Although the cluster passes all of the standard electron selection criteria, the tracking information provides evidence that the cluster is not due to an electron. The cluster could be interpreted as a photon, the hadronic decay of a tau lepton, or simply as a jet. While all three scenarios are reasonable a priori, and are consistent with the facts, each is unlikely in that this would be an unusual example of any single one of them [44]. There simply is not enough information to establish the origin of the cluster.
4.9 A Study of the Kinematics of the Event
A study of the kinematics of the candidate event is potentially useful in helping understanding its origin. The energies and momenta are given in Table 14. There are no additional jets with E GeV. Figure 27 shows the of the system if the energy of the cluster in the plug calorimeter were mismeasured. For simplicity, the cluster is denoted as , and in the plot, Mee is plotted versus for different correction factors, , such that E. The cannot be reduced below 25 GeV for any value of . While the value of the is at a local minimum for , where GeV, it would mean that a particle (or particles) with 51 GeV ( GeV) of electromagnetic energy was mismeasured as having 183 GeV of energy.
Table 15 lists the masses and transverse momentum for various combinations of the clusters in the event. One of the most interesting combinations is the combination which has an invariant mass of 91.7 GeV/c2 and a of 4.1 GeV. While this could be a where one electron faked the photon signature (there is no track or SVX stub pointing at the photon) this would be unusual, as estimated in Section 3.3. Table 16 lists the calculated transverse masses for various combination of the clusters and the . While the combination is inconsistent with the decay of a via (it has M GeV/c2) the combination could be the radiative decay of a via (M GeV/c2).
4.10 Conclusions

The candidate event appears to originate from a single collision and consists of a high quality isolated electron, two isolated photons in the central calorimeter, significant , and an electromagnetic cluster in the plug calorimeter. While the cluster passes all of the standard electron selection criteria, further investigation reveals its interpretation is not obvious. The tracking chambers indicate that there is a charged particle (or particles) traveling in the direction of the cluster but not directly at it, indicating that the cluster might not due to an electron. The cluster could be interpreted as a photon, the hadronic decay of a tau lepton, or simply as a jet. While all of three scenarios are reasonable a priori, and are consistent with the facts, each is unlikely in that this would be an unusual example of any single one of them.
| Run 68739, Event 257646 | |||||
|---|---|---|---|---|---|
| Px | Py | Pz | E | ET | |
| (GeV/c) | (GeV/c) | (GeV/c) | (GeV) | (GeV) | |
| 32.1(9) | -16.8(5) | -35(1) | 50(1) | 36(1) | |
| -12.9(4) | -29.6(9) | -22.5(7) | 39(1) | 32.3(9) | |
| -34(1) | 11.5(3) | 21.7(6) | 42(1) | 36(1) | |
| Plug EM Cluster | 60(2) | 19.0(5) | -172(5) | 183(5) | 63(2) |
| -54(7) | 13(7) | — | — | 55(7) | |
| Objects | MSystem | P | HT | ||
|---|---|---|---|---|---|
| (Gev/c2) | (Gev) | (GeV) | (deg) | (Gev/c2) | |
| 232.4 | 48.1 | 52.8 | 167.2 | 221.2 | |
| 121.8 | 84.4 | 89.0 | 164.9 | 221.1 | |
| 121.4 | 38.2 | 32.0 | 73.8 | 137.0 | |
| 195.6 | 59.7 | 66.9 | 195.6 | 202.8 | |
| 200.4 | 13.1 | 20.0 | 194.9 | 152.0 | |
| 163.3 | 40.0 | 47.5 | 227.3 | 147.1 | |
| 47.3 | 50.4 | 49.3 | 121.2 | 118.1 | |
| 56.5 | 92.6 | 99.1 | 183.8 | 198.7 | |
| 97.0 | 48.7 | 54.1 | 173.3 | 149.8 | |
| 91.7 | 5.8 | 4.1 | 166.6 | 76.8 | |
| 64.1 | 50.7 | 43.4 | 18.6 | 112.1 |
| Objects | MT |
|---|---|
| (Gev/c2) | |
| 221.1 | |
| 182.0 | |
| 141.2 | |
| 187.0 | |
| 180.4 | |
| 144.2 | |
| 111.9 | |
| 146.2 | |
| 148.5 | |
| 113.2 | |
| 70.4 | |
| 111.6 | |
| 4.3 | |
| 86.9 | |
| 52.8 |
5 Estimating the Number of Events from Standard Model Sources
The a posteriori estimation of the probability of a single event has measure zero. One instead has to define an event topology and estimate the number of events which pass that set of selection requirements from standard model sources. In an attempt to make the requirements similar to the standard a priori criteria used in CDF and analyses, the event topology is defined by the following list of requirements;
-
•
One isolated electron in the central calorimeter with E GeV
-
•
A second isolated electromagnetic cluster, in the central or plug calorimeters, which passes the electron identification requirements with E GeV.
-
•
Two isolated central photons, E GeV
-
•
GeV
-
•
An electron-electron invariant mass above the mass of the : we use 110 GeV.
A subtlety in the topology requirement is that the cluster in the plug calorimeter is possibly not an electron. To take this into account, the possible standard model sources are divided into two classes- those in which the cluster in the plug is caused by an electron, and those in which it is not. In both cases, electron candidates are required to pass the standard identification and isolation requirements described in the previous Section [13, 45]. Both photons are required to pass the high-threshold requirements in Table 1. The primary sources are standard model and production, events in which jets fake electrons and/or photons, cosmic ray interactions, and overlapping events.
5.1 Standard Model and production
The standard model process that is most likely to produce the signature directly (assuming the cluster in the plug calorimeter is due to an electron) is the production and decay of where
| (8) |
with each leaving the detector and causing . To estimate the rate, the MADGRAPH Monte Carlo [46] is used to simulate the process in lowest order. The cross-section, , is estimated to be fb for two photons with E 10 GeV, and 4.0. Taking into account the uncertainty on the cross section, the luminosity (856.8 pb-1), and differences between detection efficiencies in the data and in the detector simulation, a total of events is taken as the best estimate for producing two electrons, two photons and in the observed topology.
Another source, in which both electrons are real, is standard model production and decay. The PYTHIA Monte Carlo is used to simulate production, decay, fragmentation and the underlying event. Both -quarks are forced to decay via , both ’s decay via , and the photons are produced from radiation from internal fermion lines or are from jets which fake the photon signature. Taking into account the uncertainty on the cross section, the luminosity, differences between detection efficiencies in the data and in the detector simulation, the extra photon rates and statistical uncertainties in the sample, the rate is estimated to be events.
5.2 Estimating the Number of Expected Fake Events
Other processes which contribute to the standard model production rate of events include events with jets that fake either photons or electrons, two standard model overlapping events, or additional objects from cosmic rays interacting or radiating in the detector. To estimate the number of events from these sources, the rate at which a part of the event occurs is multiplied by the probability that the rest of constituent parts of the event occur in a random event. For example, to estimate the rate at which production fakes the event signature, the rate at which events occur and pass the requirements is multiplied by the probability that two jets are produced in association with the and both fake the photon requirements.
The number of observed events in various channels that constitute a part of the signature are listed in Table 17. The rates at which jets fake the photon and electron selection criteria are essentially flat as a function of ET for EGeV are also given in Table 17. The datasets used to measure or estimate these numbers are selected using the standard electron, photon and identification requirements described in Sections 2 and 3. The second part of the estimate requires a determination of the probability of finding an extra object or objects, such as real or fake photons, in the event. The results for fake , real and fake photons, and fake electrons are summarized in Table 18.
| Type of Event | Observed Number of events |
|---|---|
| -Type Events | |
| 58000 | |
| 4 | |
| + Central Jet | 1383 Events, 1513 jets |
| + Plug Jet | 597 Events, 620 jets |
| 40000 | |
| 4 | |
| Photon-Type Events | |
| 49 | |
| 22 | |
| 1 | |
| 0 | |
| 218 | |
| Events | 3 |
| Cosmic-Type Events | |
| 3181 | |
| -Type Events(CC/CP) | |
| + | |
| + | |
| M GeV | |
| M GeV + | |
| M GeV + | |
| Other numbers | |
| Bunch Crossings | |
| Central electron fake rate | / jet |
| (95 C.L. Upper Limit) | |
| Central photon fake rate | / jet |
| Plug electron fake rate | / jet |
| Rate for finding addition objects | Rate/Event | ||
| Fake | |||
| An additional central photon | |||
| + | |||
| + | |||
| () | + | ||
| = | + | ||
| An additional plug electron candidate | |||
| () | |||
| An additional central electron (95 C.L.) | |||
| (95 C.L.) | |||
| () | |||
5.2.1 Events with a Fake Object or Objects
The number of expected events where part of the event is ‘real’ and part of the event is ‘faked’ is summarized in Table 19. Contributions from events with fake central electrons have not been included as the expected rate is negligible compared to the other sources. A total of events are expected in the data due to fake sources.
| Real | Fake | Fake | Fake | Events |
| Process | Process 1 | Process 2 | Process 3 | in 85 pb-1 |
| — | — | |||
| — | — | |||
| — | — | |||
| — | — | |||
| — | — | |||
| — | — | |||
| — | ||||
| 4 | — | |||
| — | ||||
| 4 | — | |||
| — | ||||
| — | ||||
| — | ||||
| — | ||||
| 49 | ||||
| 58000 | ||||
| 80 | ||||
| Sum | ||||
The ‘Real Process’ rates (Column 1) in Table 19 are derived from Table 17 as follows:
-
•
: The 4 events from the data with M GeV and GeV, multiplied by a factor of for a real additional central photon.
-
•
: The 80 events in the data with M GeV, multiplied by two factors of for real additional central photons.
-
•
: The 4 events, multiplied by a factor of for a real additional central photon.
-
•
: The 4 events from the data with M GeV and GeV.
-
•
: The 4 events.
-
•
: The 80 events in the data with M GeV, multiplied by a factor of for a real additional central photon.
-
•
: The 49 events, multiplied by a factor of for a real additional central photon.
-
•
: The 49 events.
5.2.2 Overlapping Events, Including Cosmic Rays
Events in which two collisions occur at the same time, each producing part of the event, can fake the signature. The rate of expected events from each source is estimated to be equal to the rate at which one part of the event occurs, multiplied by the probability of the rest of the signature occurring in a second overlapping event. The probability of getting a particular type of overlapping event is estimated to be equal to the number of events with that signature, divided by the total number of events studied by the detector during the course of the run (). The total rate sums over all processes and includes contributions from cosmic rays which leave a photon in the detector as well as real physics contributions which might occur in an overlapping event.
The results for the dominant sources of overlap events are summarized in Table 20. To take into account the fact that there are 4 interactions in the candidate event, the estimate is multiplied by 6 to reflect the 6 possible permutations of any two of the four interactions causing the signature. Summing all the sources, the total rate due to overlapping events is estimated to be events.
| Process 1 | Process 2 | Calculation | Exp. Events | |
| 4 | ||||
| 4 | ||||
| Cosmic | ||||
| Sum | ||||
| Sum 6 | ||||
The Process 1 rates (Column 1) in Table 20 are derived as follows:
-
•
: The 22 events in the data, multiplied by the fake+real additional photon rate of .
-
•
: The 80 events in the data with M GeV, multiplied by the fake+real additional photon rate of .
-
•
: The 49 events in the data, multiplied by the fake+real additional photon rate of .
-
•
: The 4 events in the data, multiplied by the fake+real additional photon rate of .
-
•
: The 4 events in the data, multiplied by the fake+real additional photon rate of .
-
•
: The 40000 events in the data. These events come from both and cosmic ray production.
5.3 Total Standard Model Rates
The possible standard model sources are divided into two classes- those in which the second electromagnetic cluster passing the electron selection criteria is caused by an electron, and those in which it is not. The standard model estimate for the number of events with the signature where the plug cluster is allowed to be due to an electron is dominated by real production with a total of events expected. standard model production contributes an additional events. The total fake rate, split roughly equally between + fake , + fake photon and + fake plug electron, contributes a total of events. Overlapping events, including cosmic rays are estimated to contribute a total of events. Including the uncertainties, the total rate is estimated to be:
| (9) |
With the addition of the SVX data and a thorough scrutiny of the plug cluster, there are good indications that the cluster may not be due to an electron. The total rate where the plug cluster is not due to an electron is reduced from that above because the dominant backgrounds ( and ), each of which produce two electrons, are removed. The total, dominated by + fake plug electron, is . Overlaps are again negligible. Including the uncertainties, the total rate is estimated to be:
| (10) |
6 Setting Limits with the Analysis
The low probability of a satisfactory standard model explanation for the ‘’ candidate event leaves open the possibility of new physics interpretations. A number of theories put forward to explain the event predict that other events from related decay modes should appear in the searches. Since there is no evidence of these events in the central diphoton sample, quantitative limits can be set on such scenarios.
6.1 Anomalous Production
It is improbable a priori that the candidate event is from standard model production, as shown in Section 5. However, the event could be an example of anomalous production [47]. This hypothesis can be tested quantitatively by assuming that the one event was produced at its mean cross section and using the standard model Monte Carlo to estimate the mean number of events in the decay channel using the following:
where the channel is defined as two photon which pass the high-ET diphoton selection criteria (E GeV) plus 3 or more jets as defined in Section 3 and the channel is defined as 2 or more leptons in any combination as defined in Section 3 and 25 GeV. Only 3 jets are required because the acceptance is almost cut in half by requiring a fourth jet. All leptonic decays ( or ) of the pair is used as a normalization rather than just the channel to be conservative.
The Monte Carlo estimates that production should produce events with 3 or more jets 30 times more often than events with two photons, two charged leptons and . With one candidate event and no events with 3 or more jets in the data (see Table 8 and Figure 13) anomalous is excluded as the source of this event at the 95% C.L.
6.2 Supersymmetric Models
Several theories have been proposed to explain the candidate event [2, 3, 4]. The trademark of many of the supersymmetric versions [48] is that in addition to the two photons produced, two or more of the lightest supersymmetric particles (LSP) are produced in every event, either by direct production or by cascade, and leave the detector causing an energy imbalance.
In light gravitino scenarios [2] the gravitino can have a mass on the order of 1 eV and for most of the parameter space the lightest neutralino, , has a branching ratio of 100% into . The lifetime of the depends on ; the decay occurs inside the detector for a gravitino mass less than approximately 1 KeV. The is very weakly interacting and escapes the detector leaving an energy imbalance. These models can produce the signature, for example, via:
For concreteness, limits on light gravitino scenarios are set using a gauge-mediated model in the MSSM, hereafter referred to as the minimal gauge-mediated model. The parameter space in these models is spanned by , and the sign of . To simulate these models we have used a custom interface [49] to the SPYTHIA Monte Carlo [50] which calculates the inputs to SPYTHIA using the full one-loop renormalization group effects calculated in [2]e. Full simulations are done for a total of 50 points in parameter space: = 75, 100, 125, 150 and 200 GeV, = 1.1, 2, 5, 10 and 25 and Sgn()= 1. For most of parameter space and the production cross section is dominated by and production which in turn decay to produce two photons and missing in every event. Figure 29 shows distributions in ET of the photons and (after simulation and the full diphoton and requirements of Section 3.1) for = 150 GeV, = 10 and Sgn()= 1.
The model of Kane et al. [3] predicts the to be pure photino, to be pure higgsino and the higgsino to be lighter than the photino. In this case, the is the LSP, the gravitino is too massive to play a role in the phenomenology and the dominant decay of the is through the one-loop radiative decay with Br() 100%. The signature can be produced, for example, via:
| (13) |
For concreteness, limits are set on a particular point in parameter space [51] with M GeV, M GeV and a total sparticle production cross section of 11.5 pb. To provide a normalization point for future model-builders to estimate the detector efficiency, production ( 2 fb) is used to set cross section limits. The distributions in ET of the photons and (after simulation and the full diphoton and requirements of Section 3.1) are shown in Figure 29.


6.3 Acceptances
The acceptance for a given model is determined using the following equation:
where the index, , is for the two different regions (12 GeV 22 GeV and 22 GeV) to take into account the different trigger requirements and photon selections, is the acceptance from the Monte Carlo using the full detector simulation for the different regions, is the correction for differences between photon identification and isolation variables in the data and in the detector simulation, is the correction for differences between the distributions of the interaction point, , in the data and that simulated in Monte Carlo, is the efficiency of the energy-out-of-time requirement and is the correction for the trigger efficiency. The corrections (taken from Chapter 2) are summarized in Table 21.
| Correction | Requirement | Requirement |
|---|---|---|
| 12 GeV 22 GeV | 22 GeV | |
| ID and Iso | ||
| 60 cm | ||
| ETOUT = 0 | ||
| Trigger | ||
| Total Correction |
6.4 Results for
A single set of requirements, GeV and GeV, is chosen as it is estimated to exclude the maximal amount of parameter space for the light gravitino model. The acceptances are typically between 1% and 10%. Figure 31 shows the acceptance and number of expected events versus the mass.
Only one event in the diphoton data sample passes the requirements (the candidate event). Figure 31 shows the contour plot of the excluded region in the versus plane. The shaded regions in Figures 33 and 33 show the limits as a function of the and masses, respectively as the parameters are varied. The lines show the experimental limit and the theoretically predicted cross section for the lowest value of the or mass which is excluded. The is excluded for M GeV at 95% C.L. (this occurs at , ). The is excluded for M GeV at 95% C.L. (this occurs at , ).
The same selection criteria are used for the model. The model is not excluded by the data as only 2.4 events from all sparticle production and decay are expected to pass the selection criteria. The acceptance for production is 5.4% with a 95% C.L. cross section upper limit of 1.1 pb. These results, along with the light gravitino results and the results of Section 3, are comparable to those of LEP [52, 53] and the D collaboration [54].

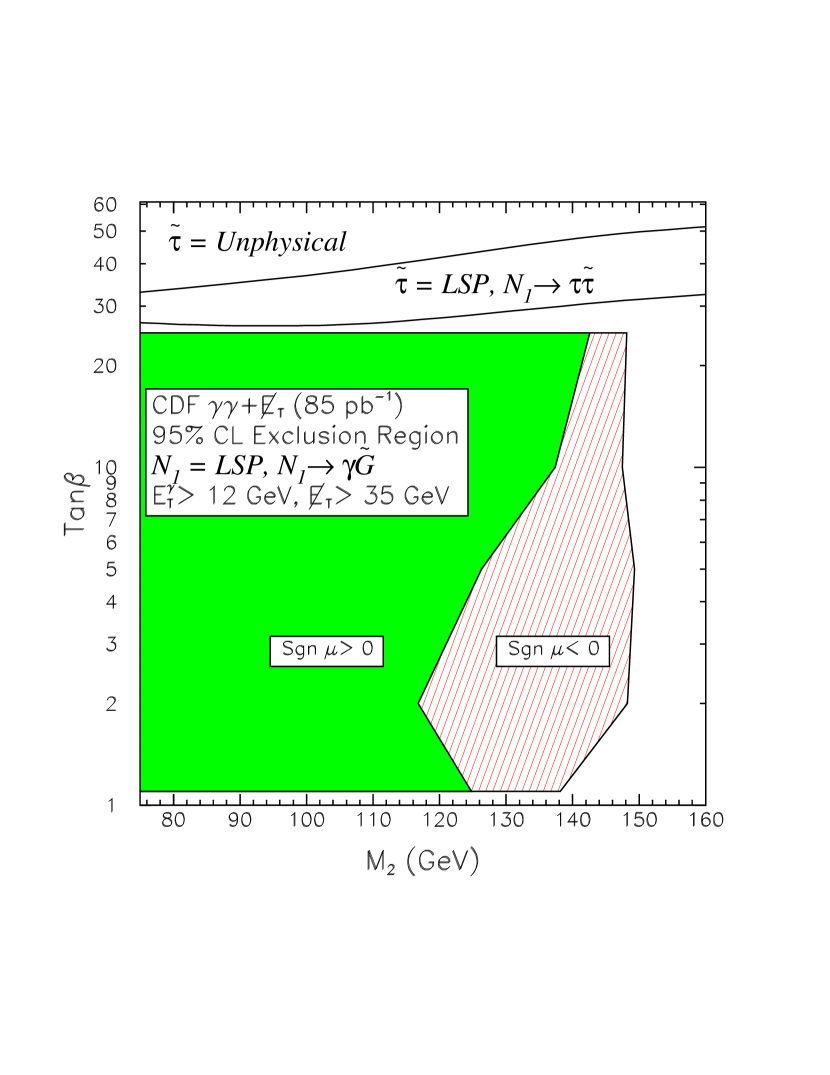
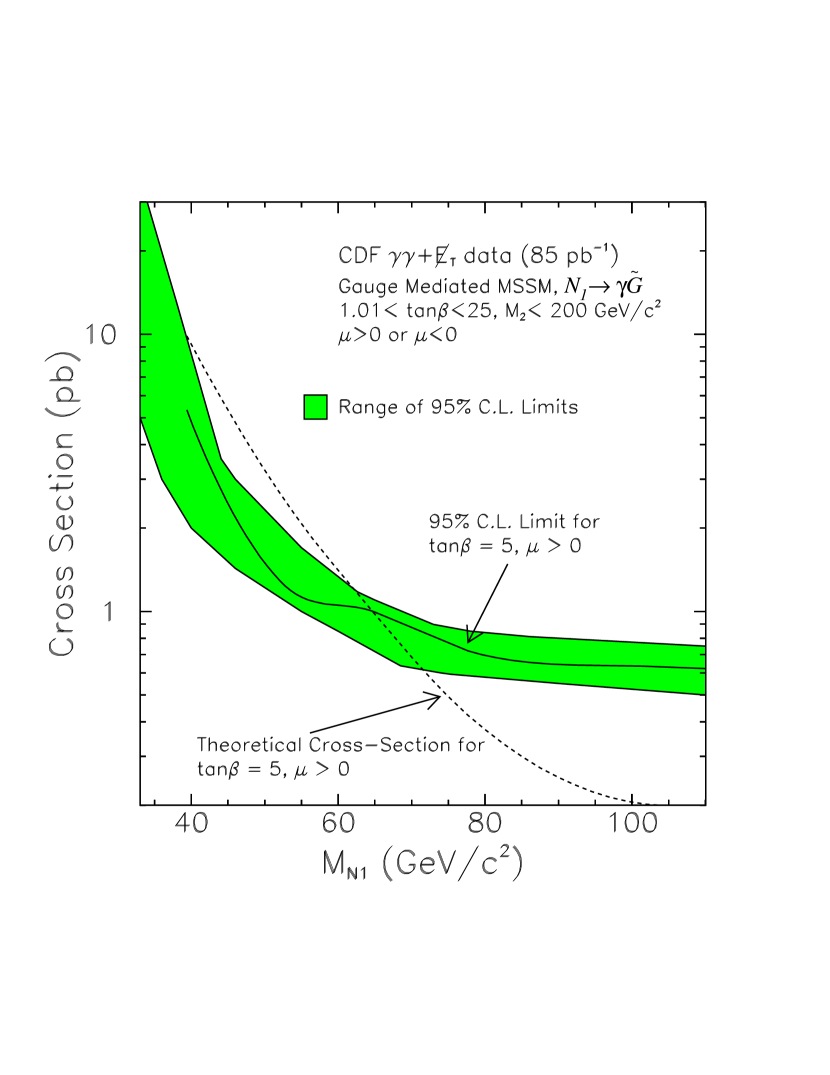
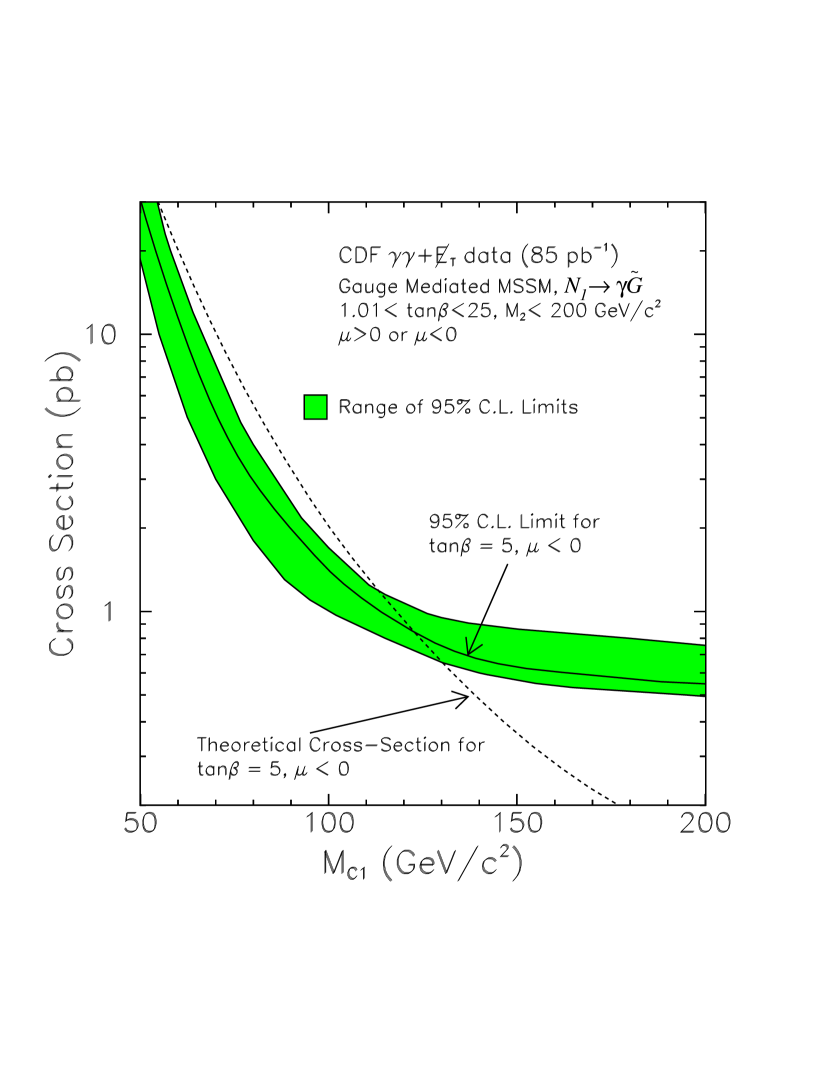
6.5 Conclusions
The diphoton data set is a good place to search for new physics. The fact that there are no jets in the data excludes a model of anomalous production as the source of the candidate at the 95% C.L. Similarly, the diphoton + data show no evidence for new physics with the possible exception of the candidate event. Although, we have some sensitivity to supersymmetric models with photonic final states, there is a large amount of parameter space which remains unexplored. More data are required.
7 Conclusion
We have searched a sample of 85 pb-1 of collisions for events with two central photons and anomalous production of missing transverse energy, jets, charged leptons (, and ), -quarks and photons. We find good agreement with standard model expectations, with the possible exception of one event that sits on the tail of the distribution as well as having a high- central electron and a high- electromagnetic cluster.
The candidate event has sparked interest in the physics community. The most probable explanation is that this a single collision which produced a high-, isolated electron, two high-, isolated photons, a high- isolated electromagnetic cluster which could be an electron, photon, tau or jet, and a significant amount of missing transverse energy. A conservative estimate predicts that there should be a total of events in the data with the signature. If sources which produce a second electron are excluded the rate drops to events.
The candidate event is tantalizing. Perhaps it is a hint of
physics beyond the standard model.
Then again it may just be one of the rare standard model
events that could show up in interactions.
Only more data will tell.
Acknowledgments
We thank the Fermilab staff and the technical staffs of the participating institutions for their contributions. G. Kane provided important theoretical guidance. S. Mrenna provided critical help with SPYTHIA and with the , and calculations. C. Kolda provided invaluable assistance in the SUSY modeling. We are also grateful to G. Farrar, J. Rosner, and F. Wilczek for helpful conversations. This work was supported by the U.S. Department of Energy and National Science Foundation, the Italian Istituto Nazionale di Fisica Nucleare, the Ministry of Science, Culture, and Education of Japan, the Natural Sciences and Engineering Research Council of Canada, the National Science Council of the Republic of China; and the A.P. Sloan Foundation.
Appendix A Details of the SVX Stub Finding Routines
This appendix discusses the Silicon vertex detector (SVX) and the algorithm for finding stubs for electrons in the plug calorimeter. The SVX is a single-sided silicon microstrip detector made from 300m thick silicon wafers. Three wafers are bonded together to form a 25.5 cm long ‘ladder’ with the strips running lengthwise to provide coordinate measurements. Four layers of ladders (numbered 0-3) are placed at radii of 2.86 cm, 4.26 cm, 5.69 cm, and 7.87 cm and arranged in a projective wedge that subtends in . Twelve wedges form a “barrel”; Two barrels are placed end-to-end along the beam direction to cover the region 1 cm 28 cm. The SVX tracking results are described using three different terms: hit, cluster and stub. When a charged particle traverses the SVX it typically deposits energy in 2 or 3 strips per layer. If enough energy is deposited in a strip it is referred to as a ‘hit.’ A ‘cluster’ finding algorithm joins the adjacent hits on the layer and determines a mean position with a typical resolution in of 5-15 mrad. Joining 3 or more clusters on different layers produces a ‘stub’ with a typical resolution of 1.5 mrad.
Typically, the SVX is used to find stubs associated with CTC tracks. We use a method similar to that in Ref. [37] which is based only on the calorimeter and the vertex position information as an input to the SVX stub finding algorithms. The SVX stub-finding algorithm searches for SVX clusters in the region of 100 mrad around the of the electron candidate and uses the ET and information in the fit. Any stub found is required to pass the requirements in Table 22 to ensure that it is well-measured.
| Cut Description | Requirement |
|---|---|
| SVX Fiducial | Trajectory must pass |
| through 3 layers of the SVX | |
| 1 cm 26 cm | |
| 3 layers with clusters | |
| Well Measured | |
| Correct | |
Using techniques, the for the stub can be inferred. The amount of charge (which is proportional to the energy deposited in the silicon) collected by the SVX strips, Q, helps determine the path length of the particle through the strip. For a given stub, the cluster with the smallest amount of charge deposited, normalized by the trajectory angle , is a good measure of the direction of the charged particle. We require and
In the candidate event, the hypothetical trajectory between the vertex at 20.4 cm and the location of the cluster, as measured in the calorimeter, passes through the inner three layers of the SVX, and passes between the two SVX barrels at the radius of the fourth layer, as shown in Figure 20. The 3-cluster stub which is found appears to be well measured, and . The is measured to be -29 mrad to be compared with an the -2.6 mrad expected for a 63 GeV positron. As a check, the charge deposition in the SVX clusters can be studied to infer a best guess for . Using the vertex at 20.4 cm, and that typically yields the prediction that 2.11. Independently, assuming the vertex at 20.4 cm, the cluster pattern (i.e, only the inner three layers were hit in a single barrel) implies the range or . Both estimates are consistent with the cluster at .
References
- [1] S. L. Glashow, Nucl. Phys 22, 579 (1961); S. Weinberg, Phys. Rev. Lett. 19, 1264 (1967); A. Salam, Elementary Particle Theory: Relativistic Groups and Analyticity (Nobel Symposium No. 8), edited by N. Svartholm (Almqvist and Wiksell, Stockholm, 1968), p. 367.
- [2] a) P. Fayet, Phys Rep 105 21 (1984); b) M. Dine, A. Nelson, Y. Nir and Y. Shirman, Phys. Rev. D 53, 2658 (1996); c) S. Dimopoulos, M. Dine, S. Raby and S. Thomas, Phys. Rev. Lett. 76, 3494 (1996); d) S. Dimopoulos, S. Thomas and J. Wells, Phys. Rev. D 54, 3283 (1996); e) K. Babu, C. Kolda and F. Wilczek, Phys. Rev. Lett. 77, 3070 (1996); f) J. Lopez and D. Nanopoulos, Mod. Phys. Lett. A10, 2473 (1996); g) S. Ambrosanio, G. Kane, G. Kribs, S. Martin and S. Mrenna, Phys. Rev. D 54, 5395 (1996). h) J. Bagger, K. Matchev,D. Pierce and R. Zhang, Phys. Rev. D 55, 3188 (1997), i) H. Baer, M. Brhlik, C. Chen, and X. Tata, Phys. Rev. D 55, 4463 (1997).
- [3] a) H. Haber, G. Kane and M. Quiros, Phys Letters B 160, 297 (1985); b) S. Ambrosanio, G. Kane, G. Kribs, S. Martin and S. Mrenna, Phys. Rev. Lett. 76, 3498 (1996); c) S. Ambrosanio, G. Kane, G. Kribs, S. Martin and S. Mrenna, Phys. Rev. D 55, 1372 (1997).
- [4] See for example a) G. Bhattacharyya and R. Mohapatra, Phys. Rev. D 54, 4204 (1996); b) J. Rosner, Phys. Rev. D 55, 3143 (1997); c) K. Lane, Phys Letters B 357, 624 (1995).
- [5] The Collider Detector at Fermilab (CDF), A compilation of articles reprinted from Nuclear Instruments and Methods in Physics Research – A, North-Holland (1988).
- [6] At CDF, the (longitudinal) axis is along the proton beam axis; is the transverse coordinate. Pseudorapidity () is ln(tan(/2)), where is the polar angle. Transverse energy is defined as . The negative of the vector sum of the transverse energy is known as missing transverse energy or .
- [7] S. Park, 10th Topical Workshop on Proton-Antiproton Collider Physics, R. Raja and J. Yoh, eds., AIP press, May 1995, p. 62. The electromagnetic cluster at large passes all the standard electron selection criteria. However, there is some indication that this cluster is not from an electron. This is discussed in Section 4.
- [8] D. Toback, Searches for New Physics in Diphoton Events in collisions at TeV, Ph.D. thesis, University of Chicago, 1997; F. Abe et al., hep-ex/9801019 to be published in Phys. Rev. Lett.
- [9] D. Amidei et al., Nucl. Instrum. Methods, A350, 73 (1994); P. Azzi et al., Nucl. Instrum. Methods A 360, 137 (1995).
- [10] For a more complete description of the photon identification and determination of backgrounds (which are expected to be mostly from ’s) in CDF see F. Abe et al., Phys. Rev. D 48, 2998 (1993) and F. Abe et al., Phys. Rev. Lett. 73, 2662 (1994).
- [11] F. Abe et al., Phys. Rev. D 52, 4784 (1995).
- [12] F. Abe et al., Phys. Rev. D 52, 2624 (1995). A much larger portion of the plug calorimeter is used to identify electrons than in the top-quark measurements of Ref. [13].
- [13] F. Abe et al., Phys. Rev. D 50, 2966 (1994) and F. Abe et al., Phys. Rev. Lett. 74, 2627 (1995). The -jet identification used here is the SECVTX algorithm only.
- [14] F. Abe et al., Phys. Rev. Lett. 79, 3585 (1997). For more detail see M. Hohlmann, Observation of Top Quark Pairs in the Dilepton Decay Channel using Electrons, Muons, and Taus dileptons with hadronically decaying tau leptons, Ph.D. thesis, University of Chicago (1997).
- [15] D. A. Glenzinski, Observation of the Top Quark in Proton-Antiproton Collisions at a Center of Mass Energy of 1.8 TeV, Ph.D. thesis, The Johns Hopkins University, (1995).
- [16] D. Amidei et al., Nucl. Instrum. Methods, A269, 51 (1988); T. Carroll et al., Nucl. Instrum. Methods, A263, 199 (1988); G. W. Foster et al., Nucl. Instrum. Methods, A269, 93 (1988).
- [17] Trigger towers subtend 0.2 in space.
- [18] D. Benjamin, 10th Topical Workshop on Proton-Antiproton Collider Physics, R. Raja and J. Yoh, eds., AIP press, May 1995, p. 370.
- [19] H. Bengtsson and T. Sjöstrand, Comput. Phys. Commun. 46, 43 (1987).
- [20] See F. Abe et al., Phys. Rev. Lett. 45, 1488 (1992) for a description of the jet-finding algorithm and the jet energy corrections. Jets are reconstructed here with a cone in space of radius 0.4 and are required to have uncorrected E GeV to be counted.
- [21] events with an invariant mass near that of the boson are selected because the dominant source is standard model production which has a similar topology to events and does not have any intrinsic . While other processes, such as , and can fake the fake this signature, their contamination rate is less than 1%.
- [22] The strip chamber measures, in the direction, a shower energy of 52 GeV, to be compared with a 37 GeV measurement from the full calorimeter.
- [23] B. Bailey, J. Owens and J. Ohnemus, Phys. Rev. D 46, 2018 (1992), J. Huston, and J. Owens, hep-ph/9508341, and M. Drees and T. Han, Phys. Rev. Lett. 77, 4142 (1996).
- [24] S. D. Ellis, R. Kleiss, and W. J. Stirling, Phys. Lett. B 154, 435 (1985).
- [25] S. A. Hauger, Measurement of the + N Jet Cross Sections in collisions at = 1.8 TeV, Ph.D. thesis, Duke University, 1995.
- [26] S. Mrenna, Private communication. This calculation was performed using MADGRAPH [27] and PYTHIA [19].
- [27] T. Stelzer and W. F. Long, Comput.Phys.Commun. 81, 357, (1994).
- [28] We are using the Method 1 SECVTX -tag estimate. See Ref. [13].
- [29] While there are three events ( GeV) in the data with a background expectation of 0.30.1, the candidate does not look like the background source. A more appropriate comparison is made by removing the candidate event. In that case, for both photons above 12 GeV there are 2 diboson candidates, consistent with an expectation of 0.30.1 events, and for both photons above 25 GeV there are no diboson candidates, consistent with an expectation of 0.10.1 events.
- [30] For example, the event could be due to two collisions occurring at the same time, each producing part of the event. Similarly, the event could be the overlap of a collision and a cosmic ray interaction. Another possibility is that parts of the event are due to jets which faked the electron and/or photon identification criteria.
- [31] The efficiency for finding a track in the CTC falls rapidly for . The for the cluster is = -1.63. In addition the inner layers of the CTC have high occupancy in the event making finding any evidence of a track impossible.
- [32] If the clusters in the event were to come from any of the other vertices in the event their ET would significantly change. For example, the ET of the cluster in the plug calorimeter is, using the vertex at 20.4 cm, 63 GeV. The ET becomes 72, 83, and 85 GeV for the vertices at -8.9, -33.7 and -38.9 cm, respectively, making each far less likely.
- [33] The sample of photons from cosmic rays are selected from a sample of single photon events in which the ratio of /.
- [34] Since most electrons and photons do not deposit energy in the hadronic calorimeters this method is not efficient for finding timing information. It is thus not unusual that one of the three central clusters in the event does not have timing information.
- [35] The energy resolution of the central and plug electromagnetic calorimeters are and , respectively.
- [36] This is not strictly true. The identification of electrons in the plug calorimeter in the top-quark dilepton analysis require the presence of a track in the CTC. However, since the cluster in the event is in a region of the detector where the track finding efficiency is approximately zero, this requirement is removed.
- [37] Q. Fan and A. Bodek, Page 553, Proceedings of VIth International Conference on Calorimetry in High Energy Physics, June 8-14, 1996, Frascati (Rome), Italy.
- [38] There is only one other electron in the sample which has , as shown in the central electron plot in Figure 22. The stub picked up by the algorithm is a good 4-cluster stub which is attached to a soft, nearby track. The stub associated with the high PT electron CTC track is a perfectly good 3-cluster stub with the appropriate . It is not selected because the algorithm selects 4-cluster stubs over 3-cluster stubs. There are no other such stubs found for the plug electromagnetic cluster.
- [39] The measurement of the shower in the electromagnetic calorimeter would also be unusual for an electron. However, a detailed study indicates that the problem is not significant and may be due to noise in the calorimeter.
- [40] The amount of energy deposited in each layer of the SVX is given by a Landau distribution. The probability of the amount of energy deposited to be below the requirement to create a cluster is less than 1%.
- [41] The photon sample was selected as ‘photons’ having no nearby tracks (see Table 1), the efficiency of these criteria is estimated to be 95.3%. Assuming all of the photons rejected from the sample have a VTX occupancy of greater than 50% and 0.03 rad, the true rate at which photons pass these cuts could be as large as 15% and 7% respectively.
- [42] S. Jadach et al., TAUOLA version 2.5 (June 1994); Also see Comput.Phys.Commun. 76 361, (1993) and references therein.
- [43] Particle Data Group, Phys. Rev. D 54, 1 (1996).
- [44] We have considered here only standard model interpretations. There are exotic possibilities such as a new particle that decays to that are consistent with all the data.
- [45] The list of electron requirements does not include the SVX cut since it is not part of the standard selection criteria. The CTC track requirement is removed since it restricts the range in which electrons can be found. Removing these requirements is conservative as it only increases the rate at which standard model processes could produce the event.
- [46] S. Mrenna, Private communication. This calculation was performed using MADGRAPH [27] and PYTHIA [19]. Also See Ref. [3]b. Based on experience with Diboson production there is about a 30 uncertainty on the cross section because of higher order corrections and structure function uncertainties.
- [47] SUSY scenarios could produce such a situation. For example .
- [48] For an excellent introduction to supersymmetry see S. Dawson, hep-ph/9612229 or M. Carena, R. Culbertson, S. Eno, H. Frisch and S. Mrenna, hep-ex/9712022.
- [49] C. Kolda, Private communication.
- [50] S. Mrenna, Comput.Phys.Commun. 101, 232, (1997).
- [51] We have used the model in Appendix B (Table 12) of Ref. [3]c which assumes that the candidate event is real and due to production, and the is not light.
- [52] ALEPH Collaboration, Phys. Lett. B 420 127 (1997) and CERN-EP/98-0 submitted to Phys. Lett. B, DELPHI Collaboration, Eur. Phys. J. C 1, 1 (1998), L3 Collaboration, Phys. Lett. B 415 299 (1997), OPAL Collaboration, Eur. Phys. J. C 2, 607 (1998).
- [53] Aleph Collaboration CERN-EP/98-077, submitted to Phys. Lett. B, OPAL Collaboration, Eur. Phys. J. C 1, 31 (1998).
- [54] S. Abachi et al., Phys. Rev. Lett. 78, 2070 (1997) and B. Abbott et al., Phys. Rev. Lett. 80, 442 (1998)