EUROPEAN ORGANIZATION FOR NUCLEAR RESEARCH
11 December, 1997
Measurements of Inclusive Production
with Large at the SS-Collider
A. Brandt1, S. Erhan, A. Kuzucu2, M. Medinnis3,
N. Ozdes2, P.E. Schlein, M.T. Zeyrek4b, J.G. Zweizig5
University of California∗, Los Angeles, California 90024, USA.
J.B. Chezea, J. Zsembery
Centre d’Etudes Nucleaires-Saclay, 91191 Gif-sur-Yvette, France.
(UA8 Collaboration)
We report results of inclusive measurements of s, produced in the forward direction at the SS with GeV, using the UA8 small angle Roman Pot spectrometers. These measurements cover the range in Feynman- and transverse momentum, and GeV, respectively. Within a systematic uncertainty of on the absolute cross section measurements, the results are indistinguishable from those made by some of us in two earlier experiments at the CERN Intersecting Storage Rings, with energies, GeV. In the -range, 0.6-0.9, the absolute cross sections are lower by a factor of 2 to 3 than the predictions of the Lund model as embodied in the PYTHIA 5.6 and JETSET 7.3 Monte Carlo programs, indicating inadequacies in knowledge of the baryon fragmentation function. For the largest -range, 0.9-1.0, the measurements agree with the Monte Carlo predictions. We have measured the average polarization for our events and find (), consistent with previous measurements at the ISR in the present region of -.
Submitted to Nuclear Physics B
∗ Supported by U.S. National Science Foundation
Grant PHY94-23142
a email: cheze@mail.cern.ch
b email: zeyrek@rorqual.cc.metu.edu.tr
1 Now at Fermi National Accelerator Laboratory, Batavia, Illinois,
U.S.A.
2 Visitor from Cukurova University, Adana, Turkey; also supported by
ICSC - World Lab.
3 Present address: DESY, Zeuthen, Germany
4 Visitor from Middle East Tech. Univ., Ankara, Turkey; supported by
TUBITAK.
5 Present address: DESY, Hamburg, Germany
1 Introduction
Forward and production has been extensively studied at the CERN Intersecting Storage Rings in and interactions with large aperture spectrometers[1-8]. Most of the previous work has used inclusively measured ’s in the reactions:
| (1) |
| (2) |
although results on ’s produced diffractively[5, 8] in interactions have also been reported.
’s measured inclusively in the fragmentation region (large ) of React. 1 are found to satisfy Feynman scaling throughout the ISR energy range. In addition, detailed measurements of the polarization in the fragmentation region of React. 1 yielded values as large as 40%, and as large as 60% for diffractively-produced ’s, where there is no dilution from and decay. A remarkable demonstration of the -independence of the polarization[6] in the fragmentation region of React. 1 is that it changes by between 31 and 62 GeV center-of-mass energy.
Tests of Feynman scaling were extended, for charged particles, from the ISR to an SS-Collider energy of 546 GeV by the UA5 Collaboration[9]. They find that, for charge particle production in the beam fragmentation region, Feynman scaling over this larger energy range is valid to .
In the work reported here, we have extended Feynman scaling tests over this energy range to ’s produced in the beam fragmentation region of React. 2 with 630 GeV center-of-mass energy. While Feynman-scaling is found to be valid over this large energy range – the invariant cross section is shown to be almost indistinguishable between ISR and SPS-collider energies – the cross sections are found to be a factor of 2-3 times smaller than predicted by the PYTHIA Monte-Carlo event generator. This observation will allow PYTHIA to be “tuned” to give more reliable estimates of baryon production in the beam fragmentation region. A measurement of polarization in React. 2 is consistent with zero, in agreement with earlier measurements in React. 1 in the same - region.
The decay products of the produced in React. 2 were both detected in one of the two UA8 Roman pot spectrometers[10], installed above and below the beam, respectively, in the direction of the outgoing antiprotons. Although the UA8 apparatus was not designed for this purpose, adequate acceptance was found for ’s which decay between 19 and 21 meters downstream of the interaction point. When the SS luminosity reached values over cm-2sec-1, the measurement of forward ’s in the -arm became feasible.
The two Roman pot spectrometers provide independent measurements of React. 2. Having two independent spectrometers (above and below the circulating beams) was particularly important in the early polarization measurements[2, 6], made with large forward multi-particle spectrometers operated in two experiments at the CERN Intersecting Storage Rings.
2 Apparatus and Trigger
A detailed description of our apparatus, its properties, triggering capabilities and interface to the UA2 experiment are given elsewhere[10]. Thus, we only provide here a brief summary of the spectrometer, in particular as regards the measurement[11] of React. 2. UA8 was installed in the same interaction region as the UA2 experiment[12] and was interfaced to the UA2 data acquisition system in such a way that UA8 could record data in parallel with UA2.
The Roman-pot spectrometers, which used the low- machine quadrupole magnets, consisted of four pot installations positioned in each arm of intersection LSS4 at the CERN SS-Collider. The four spectrometers are labeled according to which arm they are in (P for outgoing proton and M for outgoing antiproton), and whether they are above or below the beam pipe (“U” for “UP” and “D” for “DOWN”). As discussed below, the MU and MD spectrometers were instrumented to allow data from React. 2 to be recorded inclusively with the spectrometers running in a stand-alone mode (i.e. trigger provided only by the UA8 spectrometers and no UA2 detectors used in the analysis).
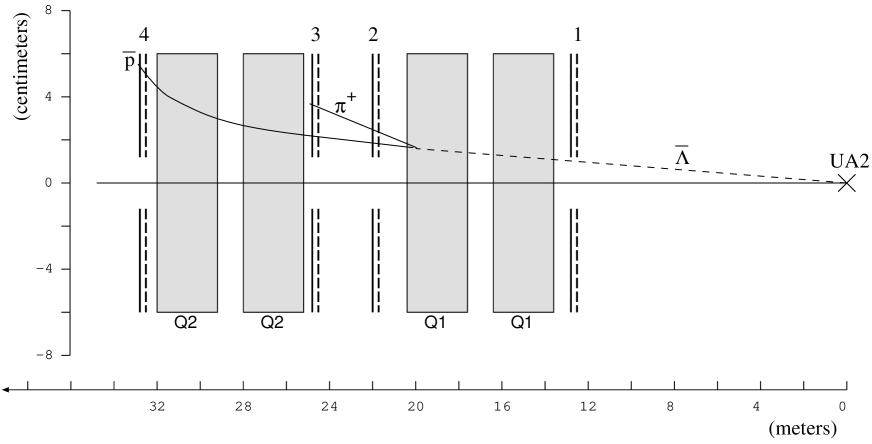
Figure 1 shows a side view of the two UA8 spectrometers used. Each spectrometer includes four Roman pots, each of which contain a chamber assembly and a plastic scintillator, Sc1-Sc4, used for trigger purposes. The two quadrupoles Q1 and Q2 are, respectively, vertically focusing and defocusing for a coming from the beam-crossing region.
A system of wire chambers was constructed with high bandwidth readout electronics. As discussed in Ref. [10], each chamber contained 6 multi-wire-proportional wire planes, and , with 28 wires each, spaced by 2 mm. and have horizontal wires, and are stereo views tilted by , respectively, with respect to the horizontal. The primed planes are shifted by half a wire spacing with respect to the unprimed planes, to solve the left-right ambiguity. Thus, the -resolution (vertical or bending plane) is much better than the -resolution (horizontal). With a 4-bit time-to-digital converter (5 ns least count) on each wire, a chamber provides resolutions of m and m in the and -views, respectively. The readout electronics also provided 8-bit logic signals, with each bit corresponding to an “OR” of four contiguous wires from a 32-channel TDC[10].
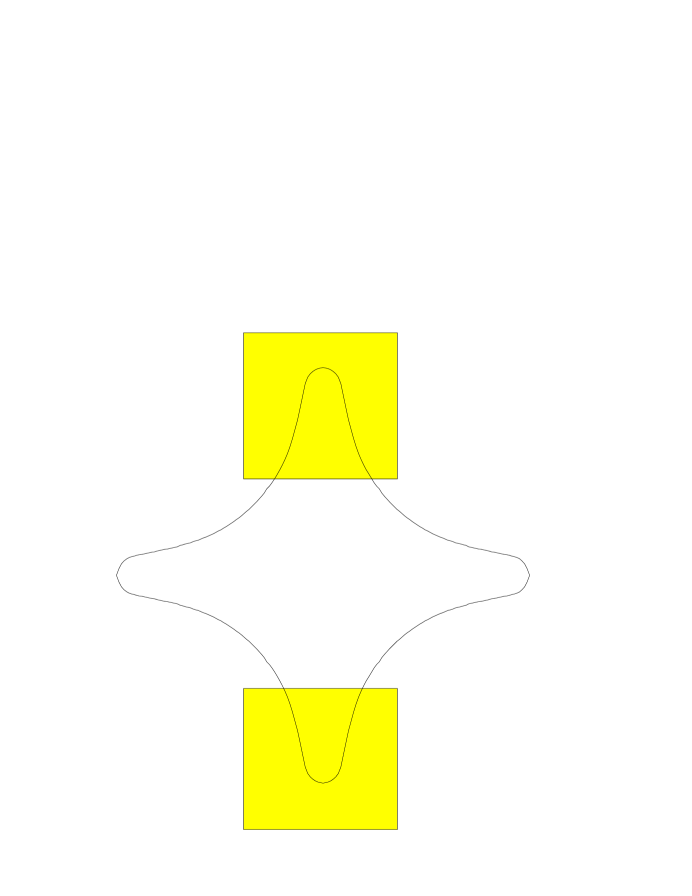
Figure 2 shows a “beams-eye” view of the UA8 chamber aperture which is closest to the center of the interaction region. The 4-lobed curve in the figure illustrates the contour of the beam pipe which follows that of the quadrupole-magnet pole pieces. The overlap between the beam pipe and rectangular chambers above and below the beam illustrate the limited azimuthal range through which a particle may pass. A discussion of the acceptance is given below in Sect. 3.2. Data were recorded with the bottom edge of each pot set at either 12 or 14 beam widths from the beam axis, referred to below as the “12 and 14” data.
If a track is in the DOWN spectrometer, we define the “adjacent” spectrometer to mean the UP spectrometer of the same arm. Similarly, we define “opposite” spectrometer to be the one diagonally opposite the one containing a trigger particle.
As shown in Fig. 1, a typical decays close to the end of the quadrupole Q1 in a 2 meter long region which starts 19 m from the interaction region. The and are detected in chambers 2 and 3 which are in a magnetic-field-free region between the two quadrupoles. The travels through quadrupole Q2 and is detected in chamber 4 at the end of the spectrometer. The low momentum is strongly deflected by quadrupole Q2 and does not reach the last chamber.
Trigger
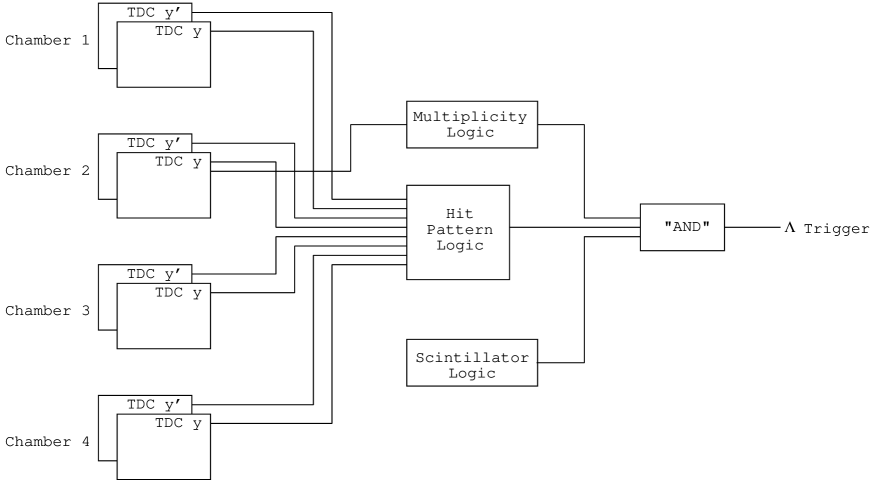
The decay products of an which decays near the end of the first quadrupole, Q1, leave recognizable signatures in chambers 2, 3 and 4. Figure 3 shows a block diagram for the trigger for one of the spectrometers. As shown in this figure, the trigger had three components: (1) hit pattern logic based on latched “hit groups”111A “hit group” is a group of 4 contiguous wires, at least one of which has a hit signal on it. in the and planes of all chambers in a spectrometer, (2) logic on the latched signals from the four scintillators in a spectrometer and (3) a multiplicity signal which was generated on the TDC card for the plane of chamber 2. A more detailed description is given in the following sections.
Hit pattern logic
For accepted events, the traverses chambers 2, 3 and 4, while the only traverses chambers 2 and 3. They are separated by at most 16 mm in chamber 2 and by at least 16 mm in chamber 3. An efficient trigger was devised which required the following hit patterns. For this purpose, a “hit” is defined as a latched anode signal from at least one wire in a group of four successive wires and a “gap” is defined when there are no latched anode signals in any of a group of four successive wires. The groups are numbered starting from the group closest to the beam.
-
•
No hits in chamber 1,
-
•
chamber 2 not required to resolve the two tracks. Specifically, chamber 2 must have 1 hit, 2 or 3 adjacent hits, or 2 hits separated by one gap in the lowest three 4-wire groups and no hits elsewhere,
-
•
chamber 3 must resolve the two tracks. That is, we require 2 non-adjacent hits, or 2 adjacent hits and 1 non-adjacent hit,
-
•
chamber 4 can have only one track. Therefore we require, 1 hit in groups 3 through 7 and no hits in groups 1 and 2.
The logic for this scheme was implemented using a total of 5 CMOS PALs for each spectrometer. The hit pattern decision took about 50 nsec.
Scintillator logic
The scintillator logic was made in two steps: (1) signals from the scintillators in pots 2, 3, and 4 were required in the UP (or DOWN) trigger spectrometer, together with the scintillator in pot 1 in veto; (2) scintillators 2, 3 and 4 in the adjacent DOWN (or UP) spectrometer were put in veto. For example for the UP spectrometer, the final scintillator logic was the coincidence, .
This logic suppressed the background events which were mainly due to secondary interactions in the quadrupoles originating from beam halo particles. This condition is compatible with an inclusive trigger because the particles emitted in the same arm as the fast are necessarily low momentum particles which could not reach the scintillator Sc2 through quadrupole Q1.
Multiplicity logic
As a further refinement of the trigger, we required that there be two or three hit wires in chamber 2. Three hits arise quite frequently because there exists a probability for a particle going through a wire plane to generate two adjacent hits. This additional multiplicity logic was necessary because the Hit Pattern Logic was based on four-wire groups and therefore could allow events with up to twelve hit wires, if the hits were distributed among the twelve wires closest to the beam.
This condition was implemented by adding a simple circuit to the TDC card of the plane for chamber 2 (for both the spectrometers above and below the beam in the side) which counted the wire hits as they were being read into the Hit Buffers via the readout modules.
The trigger decisions of Hit Pattern Logic, Scintillator Logic and Multiplicity Logic were combined in the NIM Trigger Logic to give an overall decision for each of the -spectrometers. The total time for this trigger decision was about .
Rates and Suppression
The total rates for four trigger stages are given in Table 1 for a luminosity of cm-2s-1 and for the sum of UP and DOWN spectrometers. The raw trigger rate is the counting rate of the scintillator coincidence . Since we were required by the UA2 data acquisition system to run with a total UA8 rate of 0.2 Hz, the trigger usually used about one fourth of the total UA8 trigger rate. Roughly 10% of this trigger rate are true events.
The data sample collected during two months of the 1989 collider run corresponds to an integrated luminosity of pb-1. During these runs, pots 2 and 3 were positioned 12 beam widths () from the beam. Pots 1 and 4 were set at . These positions represented a good compromise between the expected event rate and the additional background rate generated in the UA2 experiment by the presence of the pots.
3 Event Reconstruction
3.1 Fitting Procedure
A fit is used to select good ’s from the sample of candidates. The stays closest to the beam and crosses chambers 2,3,4. It has its momentum, direction and position measured. The crosses chambers 2,3 and has only its direction and position measured. To test the hypothesis that the and come from a particle of mass which decays inside the quadrupole, Q1, a minimization is performed using the program MINUIT[13]. There are 7 free parameters: , the momentum and its track slopes , , the coordinate of its decay vertex and the decay angles and . is the angle of the decay , measured with respect to the normal to the production plane, / in the rest frame and is its azimuthal angle with respect to the direction. and are the beam antiproton and laboratory momenta, respectively. These seven parameters are determined for each event by minimizing the quantity:
| (3) |
The are the measured hit positions in all chamber planes and the are the calculated coordinates in the corresponding planes for the and . The are calculated from the above set of seven parameters, using first order matrix transport equations to propagate the particles inside the quadrupoles. The index i runs from 1 to 30 (5 chamber points times 6 planes per chamber) if there are no missing hits. is the spatial resolution on a single wire plane position measurement[10], typically equal to 160 .
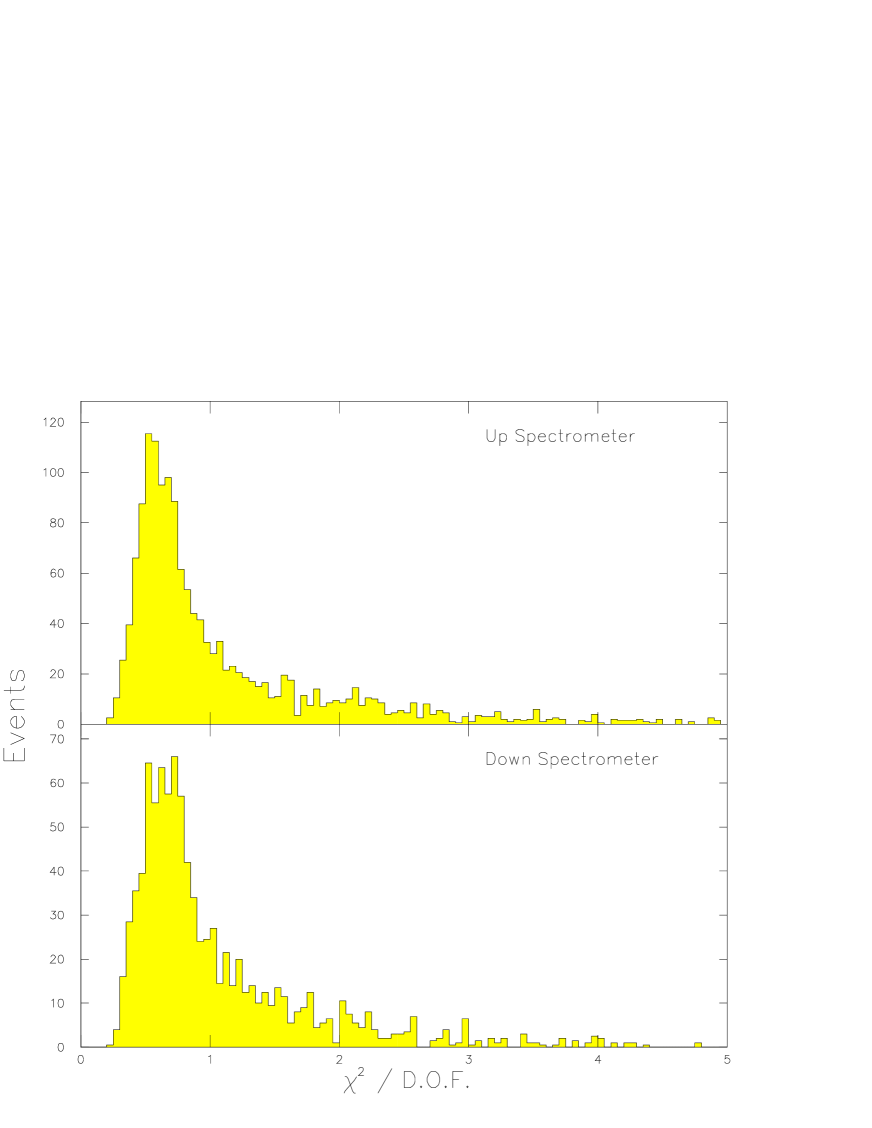
The resulting distribution, shown in Fig. 4, looks reasonable, although there is a tail which extends to quite large values. The percentage of background events in the distribution is discussed below.
There exists one unique solution for about half the events. The other half have two solutions with equally good . This arises for the following reason; when the and its decay plane are in the vertical plane (see Fig. 1), the two decay particles always stay in that plane, because there is no field component along the direction inside the quadrupoles. The occurence of a 2-solution event depends on the resolution of the -coordinate measurement of each point in a chamber and on the systematic error on the chamber positioning along . Due to the orientation of the stereo views in the chambers, the -resolution is much worse than the -resolution: 670 and 65 . The systematic shift along the direction is about 1 mm. For both spectrometers, the percentage of 2-solution events is well reproduced by Monte Carlo calculations.
The fits for the 2-solution events are only effective in the plane. In that case, one solution has the going down and the other solution has the going up at the decay vertex point in the vertical plane . All variables are stable for the two solutions, except and . The values for the two solutions are related by , and z by 70 cm. For these events, both solutions are used and each is weighted by 0.5 in the final , , and analysis. The resolutions on these variables, estimated by Monte-Carlo calculations, are , GeV and .
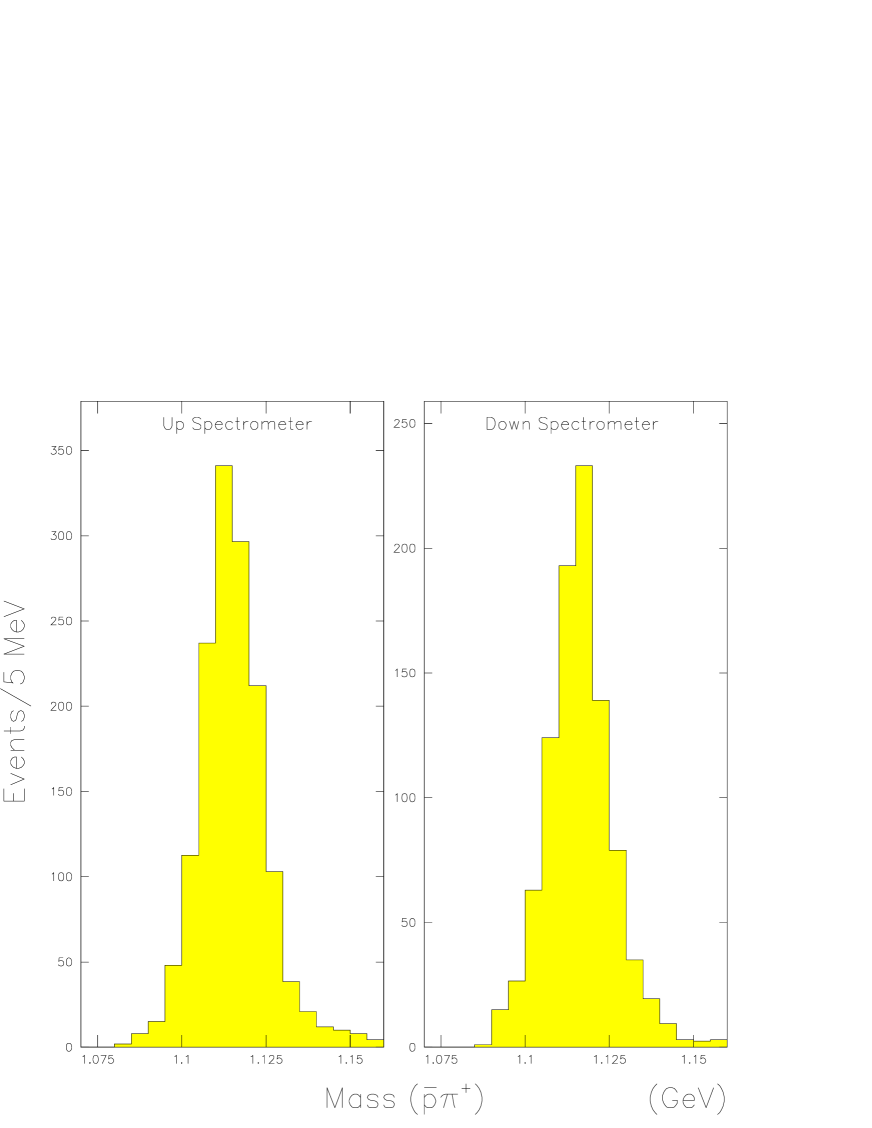
Figure 5 shows the invariant mass distribution of the system. It has a well-shaped peak, centered at the mass value. A Monte-Carlo calculation shows that the acceptance in the mass range between the mass and 1.6 GeV is larger than the acceptance at the mass with the same trigger conditions. Therefore, the mass peak can not be due to an acceptance effect of our very small aperture spectrometers.
Table 2 gives a summary of the event samples at each step of the analysis. “Chamber points found” means events with no point in chamber 1, two points each in chamber 2 and 3, and one point in chamber 4. Reconstructed events are events which are successfully fit with the decay hypothesis. There is a final fiducial cut made in the chambers.
Figure 6 shows the -coordinate distributions of the and in chambers 2,3 and 4 for the UP and DOWN spectrometers, respectively. The Monte Carlo predictions, discussed is Sect. 3.2, are seen to be in excellent agreement with the data.
Figure 7 shows the and distributions of the final sample of events. They display the ranges covered in these two variables and illustrate the extreme -values of the data sample. Again, there is excellent agreement between the Monte Carlo predictions and the data. Since the events reported here are in a rather limited region of phase space, for all predictions shown in Figs. 6 and 7, the Monte Carlo events are generated according to the parametrization of the measured cross sections of the R608[6] experiment.
Not surprisingly, there is a strong correlation between and due to the small aperture of the Roman pot spectrometers. This is shown in Fig. 8, which are scatter plots of the two variables in the UP and DOWN spectrometers, respectively.
3.2 Geometric Acceptance
The geometrical acceptance for ’s is calculated using a Monte-Carlo simulation of the UA8 spectrometer, for coming from the crossing region and decaying near the end of the first quadrupole Q1.
The simulation takes into account the parameters which define the two incident beams: the bunch length, the angular divergences ( mrad in the horizontal and vertical planes) and the momentum spread (0.1%). The decay particle trajectories inside the quadrupoles are calculated using first order matrix transport equations. Multiple scattering is simulated in the pot windows, chambers and scintillators. The digitization of the chamber information takes into account double hit production, non-linear drift speed and non-uniform TDC bin sizes. The efficiency of each chamber was measured independently and introduced in the calculation. A fiducial region is defined in each chamber where the efficiency is close to . The shape of the pipe boundary inside the quadrupole Q2 limits the acceptance of the proton and is carefully simulated (see Fig. 2).
Monte Carlo events which satisfy the trigger logic conditions are processed with the same analysis package used to process the real data. The multiple scattering calculation has been checked using an elastic data sample. The momentum resolution of elastic ’s measured with chambers 2,3,4 is well reproduced by the Monte-Carlo. More generally, the momentum resolution of ’s measured by chambers 2,3,4 is well described between 150 and 315 GeV by the relation , where cm2GeV-2 and cm2. is the mean coordinate of the particle trajectory inside quadrupole Q2 – the momentum resolution depends on the -coordinate, due to the quadrupole field shape. For elastic events, and values are equal to cm and GeV, respectively.
The measured is approximately given by , where is the coordinate of the in chamber 2 and is the distance of this chamber from the crossing region. Due to the very small aperture of the spectrometer which accepts decay protons in a interval of only 0.4 cm, the acceptance is restricted to the very small range. For each value of , the acceptance peaks at a value of which depends linearly on . The acceptance grows with increasing , up to a value about .
The angular spread of the beams and the beam momentum resolution smear out measured values of and , with and GeV. Therefore, the acceptance in 0.1 bins of is nearly independent of the beam parameters.
3.3 Corrections
In order to arrive at the absolute cross sections for React. 2, we calculate additional corrections, whose effects are not included in the Monte-Carlo simulations described above. All these corrections with their estimated errors are listed in Table 3.
The hit patterns in the chambers have been carefully simulated in the Monte-Carlo calculations, taking into account double hit production, the multiplicity trigger logic requirement and efficiencies. However, the Monte Carlo does not take into account any extra hits in the chambers. Since candidates which contain at least one extra point in a chamber are rejected during the analysis, this effect was corrected for statistically. The fraction of events lost was estimated using a sample of events taken without these requirements.
A sample of such rejected data events which contain three points in chamber 2, two points in chamber 3 and one point in chamber 4 were studied in order to get an upper estimate () of events lost. Other rejected patterns with an extra point in chambers 3 or 4 are much less frequent and the corresponding corrections can be neglected.
The relative positions of chambers 3 and 4 with respect to chamber 2 are determined to within , using the momentum distribution of the elastic antiproton and also the mass distribution. Assuming a mm shift in the nominal value of the position of chamber 2 in the Monte Carlo, we found a systematic variation in the number of accepted events by . The systematic error introduced on the acceptance calculation due to misalignment of the chambers relative to nominal beam axis is estimated to be
Monte-Carlo calculations were done with a nominal vacuum pipe. If the dimension of the pipe is reduced by mm, the acceptance value changes by . That change corresponds to the maximum possible deviation from the nominal value tolerated during the design and installation inside the quadrupoles.
As noted above, the distribution (see Fig. 4) has a small tail at large values. The distribution can be understood if systematic uncertainties in the transverse () chamber positions are taken into account. A correction factor of 0.94 is included in Table 3 to take into account the presence of background events in the final sample.
The loss of events due to particle interactions in the windows of the pots, scintillators and chambers have also been estimated. Other corrections are for the decay probability of the and the unseen decay mode of the . We also multiply the resulting cross section by a factor of 2 to compensate for the unseen particles produced in the opposite hemisphere, thus permitting a direct comparison with previous measurements of -production in pp interactions. The uncertainty in the luminosity measurement is obtained by comparing two different monitors.
Multiplication of all these correction factors gives us an overall correction of 4.04 which is applied to the data. The systematical uncertainty on the absolute cross sections is estimated to be .
4 Physics Analysis
4.1 Cross Section
Table 4 shows the invariant cross sections in four bins of , for the UP and DOWN spectrometers separately. In each case, the first error is statistical and the second error is the systematic uncertainty. Together with the results of this experiment, Fig. 9 shows the previous measurements made at the CERN-ISR by the R603[1] and R608[6] experiments. Although, there are systematic differences seen between the R603 and R608 data sets for , our present results are compatable with the (second generation) R608 points over the entire -range shown. No significant increase of the invariant cross section is seen in the center-of-mass energy range, 52–630 GeV.
4.2 Lund Monte-Carlo calculations
The invariant cross sections for React. 2 are compared in Fig. 9 with Lund Monte-Carlo calculations for interactions at 630 GeV. The default values of the programs (PYTHIA 5.6 and JETSET 7.3)[14] were used throughout these calculations. The comparison shows that the Lund Monte Carlo values of the invariant cross section are 2-3 times larger than the measured ones. This discrepancy is most likely due to our limited knowledge of the baryon fragmentation function[15] used in PYTHIA.
4.3 Polarization
The polarization, , has been obtained from the distribution, where is the angle of the emitted in the rest frame, with respect to the final (precessed) polarization vector. Because the precession angle is small (a mean value of ) does not differ very much from , the measured defined in Sect. 3.1. The raw distribution is modified to take into account the acceptance correction factor and is fitted according to the formula where is the decay parameter and is in the range, -0.8 to 0.8. Outside this range, is not reliably calculated due to the unavoidable uncertainty in the chamber positioning along . The measured values are and , in the UP and DOWN spectrometers, respectively. These results are consistent with previous measurements done at the ISR[2, 6] in the same and ranges, as shown in Fig. 10.
5 Conclusions
We have reported a measurement of the inclusive invariant cross section in the range, 0.6-1.0. The observed ’s are emitted forward at a very small angle with respect to the outgoing beam ( mrad) and decay inside a quadrupole in a 2m length region which starts 19m from the interaction region. They are clearly identified using a minimization procedure.
The cross sections are found to be indistinguishable from previous measurements in the fragmentation region made at the ISR in the c.m. energy range, 52-62 GeV. The polarization of the ’s is found to be consistent with zero, as it was for ’s in the same and region, produced in interactions at the lower ISR energies.
Finally, we have shown that PYTHIA Monte Carlo predictions for production at large are a factor of 2 to 3 larger than our measurements. Our results can be used to “tune” PYTHIA to give more reliable baryon predictions in the fragmentation region.
Acknowledgements
We are grateful to the CERN administration for their continued support. We also thank the UA2 collaboration for allowing us to use their data acquisition system for the measurements reported here. M.T.Z. thanks the Scientific & Technical Research Council of Turkey (TUBITAK) for support as a Ph.D. Fellow during his stay at CERN. A.K. and N.O. wish to thank Cukurova University, TUBITAK and ICSC-World Lab for their support.
References
-
[1]
S. Erhan et al. [R603 Collaboration], Phys. Letters B85 (1979) 447;
S. Erhan, Ph.D. Thesis (Univ. of California, Los Angeles - 1979). - [2] S. Erhan et al. [R603 Collaboration], Phys. Letters B82 (1979) 301.
- [3] P. Chauvat et al. [R608 Collaboration], Phys. Letters B127 (1983) 384.
- [4] P. Chauvat et al. [R608 Collaboration], Phys. Letters B163 (1985) 273.
- [5] A. Smith et al. [R608 Collaboration], Phys. Letters B163 (1985) 277.
- [6] P. Sherwood, Ph.D. Thesis (Univ. of California, Los Angeles - 1987).
- [7] A. Smith et al. [R608 Collaboration], Phys. Letters B185 (1987) 209.
- [8] T. Henkes et al. [R608 Collaboration], Phys. Letters B283 (1992) 155.
- [9] G.J. Alner et al. [UA5 Collaboration], Phys. Rep. 154 (1987) 247.
- [10] A. Brandt et al. [UA8 Collaboration], Nucl. Instrum. & Methods A327 (1993) 412.
- [11] M.T. Zeyrek, Ph.D. Thesis (Middle East Technical University - Ankara, Turkey - 1991)
- [12] C.N. Booth [UA2 Collaboration], Proceedings of the 6th Topical Workshop on Proton-Antiproton Collider Physics (Aachen 1986), p. 381.
- [13] MINUIT CERN D506 program (1989), Long Writeup.
- [14] T. Sjostrand, CERN-TH.6488/92.
- [15] T. Sjostrand, private communication.
| Trigger Requirement | Rate (Hz) |
|---|---|
| Scintillators (Raw) | 400. |
| Hit pattern Logic | 1. |
| Scintillator Logic | 0.1 |
| Multiplicity Logic | 0.05 |
| UP | DOWN | |
|---|---|---|
| Event Category | Spectrometer | Spectrometer |
| Raw Triggers | 40072 | 35890 |
| Chamber points found | 10319 | 7481 |
| Reconstructed | 5614 | 2348 |
| After fiducial Cut | 1548 | 995 |
| Correction | Factor |
|---|---|
| Background in dist. | 0.9400.010 |
| Chamber 1 Veto | 1.1900.054 |
| Extra point in chamber 2 | 1.0340.005 |
| Pipe | 1.0750.075 |
| Nuclear Interactions | 1.0410.007 |
| Decay of | 1.002 |
| Unseen decay mode | 1.558 |
| Unseen Hemisphere | 2.000 |
| -coordinate | 1.0000.035 |
| -coordinate | 1.0000.150 |
| Luminosity measurement error | 1.0000.081 |
| FINAL CORRECTION | 4.0420.812 |
| Events | E | |||
| bin | (GeV2) | (mb GeV-2) | ||
| UP Spectrometer | ||||
| 0.6-0.7 | 0.67 | 0.18 | 73 | 0.5520.1070.107 |
| 0.7-0.8 | 0.76 | 0.19 | 396 | 0.5990.0550.116 |
| 0.8-0.9 | 0.85 | 0.30 | 653 | 0.3440.0230.066 |
| 0.9-1.0 | 0.935 | 0.36 | 423 | 0.1280.0790.025 |
| DOWN Spectrometer | ||||
| 0.6-0.7 | 0.67 | 0.20 | 43 | 0.5100.1050.099 |
| 0.7-0.8 | 0.76 | 0.26 | 240 | 0.4640.0410.090 |
| 0.8-0.9 | 0.85 | 0.33 | 443 | 0.2950.0190.057 |
| 0.9-1.0 | 0.94 | 0.40 | 269 | 0.1000.0680.019 |