SLAC–PUB–7715
December 1997
Dirc, a New Type of Particle Identification System for BaBar***Work supported by Department of Energy contract DE–AC03–76SF00515.
Jochen Schwiening
Stanford Linear Accelerator Center
Stanford University, Stanford, CA 94309
Representing
The BaBar-Dirc Collaboration
Abstract
The Dirc, a new type of Cherenkov imaging device, has been selected as the primary particle identification system for the BaBar detector at the asymmetric B-factory, Pep-II. It is based on total internal reflection and uses long, rectangular bars made from synthetic fused silica as Cherenkov radiators and light guides. In this paper, the principles of the Dirc ring imaging Cherenkov technique are explained and results from the prototype program are presented. The studies of the optical properties and radiation hardness of the quartz radiators are described, followed by a discussion of the detector design.
Invited talk presented at the
5th International Workshop on B–Physics at Hadron Machines (Beauty’97)
Santa Monica, California, USA
October 13–17, 1997
1 Introduction
Pep-II is an asymmetric collider, with beam energies of 9 GeV electrons upon 3.1 GeV positrons [1]. At the design luminosity of cm-2s-1, the production of with a boost of will result in about 10 pairs per second. BaBar is the detector dedicated to studying the collisions at Pep-II, with a primary physics goal of observing violation in the system [2]. The experiment is expected to begin taking data in the spring of 1999.
In the study of violation, precise particle identification (PID) of charged pions and kaons over the full kinematic range is of particular importance, both to reconstruct one of the two B mesons in an exclusive decay mode, and to “tag” the beauty content of the recoiling B meson (identify it as either a or a when it decayed). The BaBar drift chamber can perform / separation with at least 3 significance up to 700 MeV/c by measuring the specific energy loss. Since the B-decays are boosted at Pep-II in the forward (electron) direction, the maximum momentum particle possible in a two-body B-decay is about 1.5 GeV in the backward direction and about 4 GeV in the forward direction. A dedicated PID system should cover the range from 0.7 up to 4 GeV and take the asymmetry of the boosted events into account. Since the PID system is surrounded by a CsI crystal calorimeter, it should also be thin in both radial dimension (to minimize the amount of CsI material needed) and radiation length (to avoid the deterioration of the excellent energy resolution of the calorimeter). Finally, to operate successfully in the high-luminosity environment of Pep-II, the detector should be fast and tolerant of background.
2 The Dirc Concept
The Dirc is a new type of Cherenkov ring imaging detector which utilizes totally internally reflecting Cherenkov photons in the visible and near UV range [3]. The acronym Dirc stands for Detection of Internally Reflected Čerenkov light.

The geometry of the Dirc is shown schematically in Figure 1. It uses long, thin, flat quartz radiator bars (effective mean refractive index = 1.474) with a rectangular cross section. The quartz bar is surrounded by a material with a small refractive index (nitrogen in this case). As it traverses the quartz bar, a particle of velocity will radiate Cherenkov photons in a cone of half opening angle around the particle trajectory. Since the refractive index of the radiator bar is large, some of the Cherenkov photons will be totally internally reflected, regardless of the incidence angle of the tracks, and propagate along the length of the bar. To avoid having to instrument both bar ends with photon detectors, a mirror is placed at one end, perpendicular to the bar axis. This mirror returns most of the incident photons to the other (instrumented) bar end. Since the bar has a rectangular cross section and is made to optical precision, the direction of the photons remains unchanged and the Cherenkov angle conserved during the transport, except for left-right/up-down ambiguities due to the reflection at the radiator bar surfaces. The photons are then proximity focused by expanding through a standoff region filled with purified water (index ) onto an array of densely packed photomultiplier tubes placed at a distance of about 1.2 m from the bar end, where the Cherenkov angle is measured from the radius of the Cherenkov ring, determining the particle velocity. Combined with the momentum information from the drift chamber, the mass of the particle is identified.
3 The Dirc Prototype Program
The topics described here were selected to highlight the performance of the Dirc prototypes. Details of the setup, data analysis, and results can be found in Ref. [4] for Prototype I and in Ref. [5] for Prototype II.
3.1 Prototype I
Prototype I was a conceptual prototype that operated from 1993–1994 in a hardened cosmic muons setup at SLAC [4]. It provided a proof-of-principle and the basis for the detector simulation and performance estimates for the Dirc in BaBar. Its main goal besides proving the feasibility of the Dirc concept was to measure the photon yield and single Cherenkov photon angle resolution.
The setup contained 120 cm and 240 cm long quartz bars (manufactured by Zygo Corp. [6] from Vitreosil F/055 fused quartz material [7]), 4.73 cm wide and 1.70 cm thick. The 240 cm long bar was made from two 120 cm long bars glued together with an epoxy (epo-tek 301-2 [8]) which has good transmission at wavelengths to which the PMTs are sensitive. The quartz bars were placed in a light-tight box and supported by nylon screws. The box was mounted on rotating rails to allow angle and position variation. The cosmic muon trigger was provided by scintillation counters, and a 1 GeV threshold was provided by an iron stack underneath the bar. An array of straw chambers was used to measure the track direction for the single Cherenkov photon angle resolution measurement.
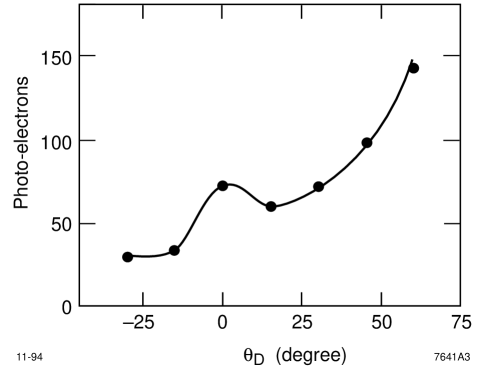
To measure the photoelectron yield, a single 2′′ diameter PMT (Burle-8850 [9]) was glued directly to the end of the 120 cm long bar. Figure 2 shows the observed average number of photoelectrons as a function of track dip angle. The number of photoelectrons can be written using the “Cherenkov quality factor” as
| (1) |
where is the photon collection efficiency, is the Cherenkov angle, is the thickness of the radiator bar, and is the dip angle of the track. The collection efficiency is a function of dip angle, track position, and photon energy. The is given by
| (2) |
where is the quantum efficiency of the PMT and is the photon energy. From the quantum efficiency curve claimed by the manufacturer, we find 150 cm-1. The solid line is a Monte Carlo simulation of the test setup. It simulates the propagation of the photons through the bar, taking into account the wavelength dependencies of both the photon absorption in the quartz bar and the quantum efficiency of the PMT. The Monte Carlo simulation reproduces both the dip angle dependence and absolute yield well. The number of photoelectrons increases in the forward direction, mainly as a result of the larger amount of quartz traversed by the particles. The bump at is due to the fact that all of the photons are internally reflected at this angle.
To measure the angular resolution, a closely packed array of 47 1′′ diameter PMTs (EMI-9124A [10]) was used. The standoff region (Standoff Box) material was air to allow easy movement of the array. The single Cherenkov photon angle resolution was meaured with the PMT array at various standoff distances , dip angles , and track positions . The results of the measurements are summarized in Table 1. The quoted values for the resolution are from a fit of a Gaussian plus polynomial to the Cherenkov photon angle distribution. The measured single photon resolution is found to be consistent with the estimate based on the Monte Carlo simulations and no significant dependence on the track position is seen.
resolution [mr] [cm] [cm] measurement estimate 30∘ 60 60 10.1 40∘ 60 60 12.0 50∘ 60 60 12.8 60∘ 60 60 12.5 60∘ 90 30 10.2 30∘ 90 30 7.8 30∘ 90 110 7.8 30∘ 90 205 7.8
In other tests, the Cherenkov photon attenuation rate along the bar was found to be 10%/m for the track dip angle and no significant light loss or resolution loss at the glue joint in the 240 cm long bar was seen.
In conclusion, all measurements were consistent with each other and with the Monte Carlo simulation and estimates. They demonstrated the particle identification capability of the Dirc, and showed that the main features of the device were well-understood and that the performance could be safely extrapolated to a full scale device.
3.2 Prototype II
After the completion of Prototype I, many issues remained to be resolved before a Dirc detector for BaBar could be designed. The full scale Prototype II [5] was constructed to address these concerns. The main goals were:
-
•
to refine the early performance estimates;
-
•
to explore the engineering issues associated with constructing a large Dirc detector;
-
•
to gain experience in the long-term operation of a large Dirc detector;
-
•
to provide a test-bench for new ideas as the design of the BaBar Dirc proceeded.
The construction of the prototype was completed in April 1995, and it was tested briefly in a hardened cosmic muon beam at LBNL. Shortly thereafter, the detector was shipped to CERN where it was installed in the T9 zone of the CERN PS East Hall. It was tested for a period of over 12 months in the T9 beam.

3.2.1 Setup
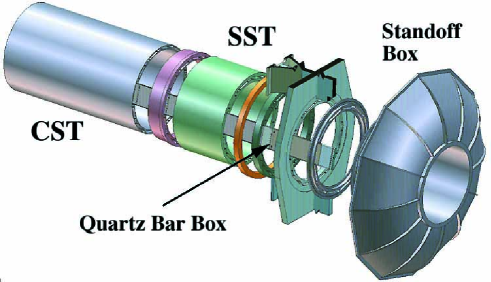
The Prototype II consisted of three major mechanical assemblies (see Figure 3), installed on a carriage which could translate and rotate Prototype II in several dimensions:
-
•
Two 120 cm long quartz bars (manufactured by Zygo Corp. [6] from Vitreosil F/055 fused quartz material [7]), inside a protective box. The bars were placed in the box either side-by-side or glued together as one 240 cm long bar. The bars were coupled to the Standoff Box through a small quartz entrance window.
-
•
A standoff box filled with pure water, with its mechanical support. This assembly included a small quartz window interface where Cherenkov light from the bar entered the Standoff Box, and nine large quartz windows in a array, which allowed the light to pass through to the PMTs after image expansion. The bottom of the Standoff Box held a plane glass mirror with front-surface aluminum and dielectric coatings [11]. This mirror is used to reflect the lower Cherenkov ring image onto the upper one, reducing the number of PMTs needed by 50%.
-
•
An array of PMTs (Hamamatsu model R268 [12]). These were optically and mechanically coupled to the Standoff Box exit windows through a thin UV-clear silicone rubber sheet. For economic reasons, instead of instrumenting the full image plane, only a limited number of PMTs were installed that covered the Cherenkov ring associated with a single particle incident angle.
The T9 beam line provided unseparated secondary particles in a narrow momentum range tunable between 0.8 and . It was operated with positive particles (mainly protons, pions, and positrons) at low intensity, delivering around particles to the test area per spill. For particle identification, the beam line was equipped with two gas threshold Cherenkov counters and a time-of-flight system. To measure the angle and position of particles incident on the quartz bar, three multi-wire proportional chambers were installed on the beam line. The trigger was generated as the coincidence of signals from several plastic scintillation counters. A beam halo veto counter made of scintillation counters was installed on the beam line close to the beam extraction. A large scintillation counter was also fixed on the Standoff Box to flag particles crossing the water tank. Another set of counters was arranged along the quartz bar outside the region populated by trigger particles. These counters were used offline to tag events with associated beam halo particles.

3.2.2 Results
The single photon resolution of Prototype II is demonstrated in Figure 4. This shows the distribution of corrected average hit rate versus reconstructed for a subset of PMTs for pions at , , and . The data fit well to a Gaussian for the Cherenkov signal plus a flat distribution for the background. The resolution was defined as the Gaussian parameter of this fit. The single photon resolution for pions was found to be , in agreement with Monte Carlo simulations and consistent with the expectation based on the value obtained for an air standoff region in Prototype I. Similar analysis of protons and electrons gave consistent results. No significant variation in this resolution with either (photon transmission distance down the bar) or (photon position within the Cherenkov ring) was observed, within the calculated errors of the data.
The particle identification power of Prototype II was studied by measuring the average Cherenkov angle per track for pions and protons at . At that momentum, the separation between pion and proton Cherenkov rings has the same value as between pions and kaons at . The momentum corresponds roughly to that of decay products from a two-body B0 decay in BaBar hitting the Dirc bar at the same value of . In this decay mode, pion/kaon separation is essential for the physics goal of the BaBar experiment. Thus, even though the BaBar Dirc detector differs in detail from the Prototype II detector, the pion/proton separation at tests the performance of Prototype II in a situation relevant for the BaBar Dirc.

The particle separation power was defined as the difference in the peak position values, divided by the root mean squared of the pion track distribution. This is shown in Figure 5. The pion track root mean squared was measured for data at , and found to be . The peak separation was measured in the same data to be , consistent with expectations. These together give a pion/proton PID power for Prototype II of 3.6 standard deviations.
The track Cherenkov angle resolution was observed to scale approximately as the square root of the number of photons, with a small residual term of about coming from correlated factors such as track multiple scattering in the bar, and residual alignment uncertainties.

The photoelectron yield of Prototype II was measured with a coarse scan of the 240 cm long bar with steps of over the full range (20 cm to 460 cm) at constant momentum (5.4 GeV) and particle incident angle (). This analysis also allows the determination of the attenuation rate for Cherenkov photons as they traveled down the bar. The Cherenkov quality factor is defined by the relation the number of photoelectrons detected per centimeter of radiator over the acceptance of Prototype II. This definition of differs slightly from the one conventionally used with threshold Cherenkov detectors [13] in that the geometric acceptance , which accounts for the truncation of the Cherenkov cone and for the partial coverage of the image plane by PMTs, has been explicitly extracted. In this definition, is proportional to the product of the photodetection efficiency and the collection efficiency , which accounts for the light losses during photon transmission and reflection. For the Dirc, is a function of .
Figure 6 shows the measurements of () versus . The data are fit to an exponential with a discontinuity at , to account for reflection loss at the bar-end mirror. The fit gives a of 24 for 18 degrees of freedom, and the fitted values for the three parameters are
| = | cm-1 | |||
|---|---|---|---|---|
| attenuation per meter | = | % | ||
| loss at the mirror | = | % |
The errors quoted above are those returned from the fit, and so include the full statistical and systematic error on the photon rates, but not any systematic error due to the fit model itself. In this fit the potential loss of light at the glue joint at (and ) is ignored. Fits with this loss as a free parameter were also performed. The glue joint light loss could not be measured precisely and was found to be consistent with zero within two standard deviations. Lab measurements and other tests also indicate a negligible light loss at the glue joint. Neglecting the glue joint loss leads to a conservative (larger) estimate of the attenuation, and has no effect on the estimate of (0). To facilitate comparing this measurement with other measurements, the effects peculiar to the Prototype II test setup implicit in must be removed. There is no way to measure directly from the data. However, a realistic estimate of at can be calculated by combining expected light-loss effects from the different parts of Prototype II, resulting in the estimate at , which leads to:
The first error comes from the fit error, the second from an estimated 30% uncertainty in the light loss estimates. This value is in agreement with the value of that was used for performance estimates of the BaBar Dirc in the BaBar TDR [2] and the Prototype I result of .
This measurement of the attenuation value agrees well with a full Monte Carlo simulation, which includes the spectral response of the PMTs, the spectral transmission of bulk fused quartz, and benchtop measurements [14, 15]. It is considerably lower than the value of 10% observed in Prototype I. The difference can be understood as the result of surface contamination. Careful cleaning of the bar surfaces was shown to reduce the attenuation from 10% to about 4%.
Other results included:
-
•
Scans across the gap region between bars in the side-by-side operation of two 120 cm long bars showed that there is no measurable cross talk between bars mounted in close proximity side-by-side.
-
•
The effective index of refraction of the quartz radiator was measured to be from a direct fit to the momentum dependent Cherenkov angle.
-
•
One of the large quartz windows that coupled the SOB to the PMT array was replaced with a jig which held the PMTs directly in the water. The operation of the photomultiplier tubes in water was completely satisfactory.
-
•
The BaBar Dirc proposal to equip each PMT with light concentrators was tested by equipping one of the PMT bundles temporarily with a set of reflective cones. Each cone was tall with an outer diameter of equal to the PMT spacing, and an inner diameter of equal to the photocathode diameter. To facilitate their mounting, ten cones were manufactured together in a single plaque of molded plastic. The cone plaques were polished and coated with a Al layer followed by of SiO2. The light collection improvement using the concentrators measured in the Prototype II test was consistent with lab measurements.
-
•
Finally, the relationship between timing and photon position at the detector was shown to be very useful for background rejection. The single photon timing resolution was measured to be and was dominated, as expected, by the transit time spread of the PMTs used in the test. The BaBar Dirc will use PMTs with a transit time spread (ETL model 9125 [10]).
In conclusion, the operation of Prototype II was stable and robust over a periode of 12 months in the T9 beam. The tests were very successful and no significant, unanticipated variance in performance as a function of the position or angle of the track in the Dirc bar was observed.
4 The Fused Silica Radiators
The optical properties and radiation hardness of several quartz radiator material candidates were studied in a program of research and development that aimed at determining whether bars that meet the stringent requirements of the Dirc can be obtained from commercial sources.
The radiation hardness was tested by comparing the transmission of several samples of “natural” fused quartz (made from crushing and melting natural crystals or sand) and synthetic fused silica (made by flame hydrolysis of Silicon-bearing compounds, such as ) before and after exposure to doses of up to 500 krad from a source (1.17/1.33 MeV photons). All natural quartz materials, inculding the Vitreosil F/055 used in the prototypes, were found to show unacceptable transmission losses after only a few krad exposure. The synthetic types, on the other hand, showed little or no transmission loss, even after exposure to several hundred krad [14, 16]. A detailed comparison of different types of synthetic materials revealed that a periodicity in the refractive index of the quartz bulk material, a by-product of the proprietary production process, causes interference effects in some synthetic quartz materials [17]. This interference would severly decrease the angular resolution of the Dirc. A candidate material that does not show the periodicity was identified (Spectrosil [7]) and will be used in the Dirc.
In order to preserve the photon angles during surface reflections, the faces and sides have to be nominally parallel while the orthogonal surfaces are kept nominally perpendicular. Typically, the bar’s surfaces have to be flat and parallel to about 25 m, while the orthogonal surfaces are perpendicular to a tolerance of 0.3 mrad. The most difficult requirements are associated with maintaining the photon transmission during reflections at the surfaces of the bar (a Cherenkov photon may be internally reflected a few hundred times before exiting the bar). This leads to rather severe requirements on edge sharpness and surface finish. After polishing, the Dirc radiator bars have an average edge radius less than 5 m, and a nominal surface polish of better than 0.5 nm (RMS). Benchtop measurements, using a polarized HeCd laser beam at 442 nm, demonstrated that the coefficient of total internal reflection of bars polished to this high quality finish exceeds 0.9995 [15]. The bars will be manufactured by Boeing [18].
5 The Dirc for BaBar
Prototype I and Prototype II have shown that the Dirc is well-matched to the asymmetric B Factory and motivate the choice of the Dirc as the primary PID system for BaBar. Simulations based on the prototype performance predict an excellent separation of the BaBar Dirc. This is demonstrated in Figure 7 where the predicted PID performance is shown as a function of the particle momentum and the polar angle . The separation is nearly four standard deviations or better over the entire acceptance region.

The Dirc for BaBar will be a barrel detector, located in radius between the drift chamber and the CsI calorimeter. The main components are shown schematically in Figure 8.

The mechanical support of the Dirc is cantilevered from the iron endcap region, supported by a thick steel tube (SST) which also helps to minimize the magnetic flux gap caused by the Dirc extending through the instrumented flux return. The quartz radiator bars will be supported in the active region by a thin extension of this tube. This central support tube (CST) is designed similar to an aircraft wing, made of thin aluminum inner and outer shells covering an aluminum frame. The frame will be made of thin-wall bulkhead rings spaced every along the tube axis. The space between the bulkheads will be filled by construction foam. There will be no Dirc mechanical supports in the forward end of BaBar, minimizing its impact on the other detector systems located there. The standoff box will be made of stainless steel and hold about 6 000 liters of pure water. The BaBar Dirc will use almost 11 000 diameter PMTs (ETL model 9125 [10]). These tubes have high gain and good quantum efficiency (around 25%) in the Cherenkov wavelengths transmitted by both quartz and water, and are available at modest price. They will be arranged in a nearly close-packed hexagonal pattern on the detection surface. Hexagonal light concentrators on the front of the PMTs will result in an effective active surface area fraction of approximately 90%. The PMTs will lie on a surface that is approximately toroidal. The distance traversed in the water by the photons emerging from the bar end will be . This distance, together with the size of the bars and PMTs, gives a geometric contribution to the single photon Cherenkov angle resolution of . This geometric contribution is approximately equal to the resolution contribution coming from the production and transmission dispersions.
The total thickness of the Dirc, including support structures, will be about 8 cm or 19% of a radiation length for a particle at normal incidence. The Dirc bars will be arranged as a 12-sided polygonal barrel. Each side of the polygon will consist of 12 bars placed very close together ( gap) side by side, in 12 quartz bar boxes, shown in Figure 9, for a total of 144 bars. The radiator bars will cover 94% of the azimuthal angle and 87% of the center-of-mass polar angle. The bars will be made from synthetic fused silica and will have transverse dimensions of thick by 3.5 cm wide, and are about long. The length is achieved by gluing end-to-end four bars, that size being the longest high quality quartz bar currently available from industry.
The mirror in the Standoff Box described in the section on the Prototype II setup, has been replaced in the BaBar Dirc design by a quartz “wedge” which is glued to the readout end of each bar. The wedge is a long block of synthetic fused silica with the same width as the bars (), and a trapezoidal profile ( high at the bar end and high at the quartz window, which provides the interface to the water). Total internal reflection on all sides of the quartz wedge provides nearly lossless reflection, thereby increasing the number of detectable photons relative to the Prototype II mirror design. The wedge design also slightly improves the angular resolution, allows a stronger and more robust water seal, and eliminates the need for operating the fragile mirrors in the standoff box water and their post-installation alignment.
6 Conclusions
The Dirc is a new type of ring imaging Cherenkov detector that is well-matched to the requirements for a particle identification device in the BaBar detector at the Pep-II B Factory. It is thin, fast, and tolerant of background. The prototype program has demonstrated that the principles of operation are well-understood, and that the final system is expected to yield excellent separation of nearly four standard deviations or better over the full kinematic region for all of the products from B decays. The construction of the Dirc is well underway. The detector will be installed in BaBar by September 1998. This will be followed by a cosmic ray checkout and data taking is scheduled to begin in April 1999.
7 Acknowledgments
This research is supported by the Department of Energy under contracts DE-AC03-76SF00515 (SLAC), DE-AC03-76SF00098 (LBNL), DE-AM03-76SF0010 (UCSB), and DE-FG03-93ER40788 (CSU); the National Science Foundation grants PHY-95-10439 (Rutgers) and PHY-95-11999 (Cincinnati). The speaker would like to thank the Alexander-von-Humboldt Stiftung for their financial support.
References
- [1] “An Asymmetric B Factory Based on PEP: Conceptual Design Report,” LBL-PUB-5303/SLAC-REP-372 (1991).
- [2] The BaBar Collaboration, “BaBar Technical Design Report,” SLAC-REP-950457, 1995.
-
[3]
B.N. Ratcliff,
“The B Factory Detector for Pep-II: a Status Report,”
SLAC-PUB-5946 (1992) and Dallas HEP (1992) 1889;
B.N. Ratcliff, “The Dirc Counter: a New Type of Particle Identification Device for B Factories,” SLAC-PUB-6047 (1993);
P. Coyle et.al., “The Dirc Counter: A New Type of Particle Identification Device for B Factories,” Nucl. Instr. Methods A 343 1994 pp. 292. -
[4]
D. Aston et.al.,
“Test of a Conceptual Prototype of the Total Internal
Reflection Cherenkov Imaging Detector (Dirc) with Cosmic Muons,”
IEEE Trans. Nucl. Sci. 42 (1995) 534. -
[5]
H. Staengle et.al.,
“Test of a Large Scale Prototype of the Dirc, a
Cherenkov Imaging Detector based on Total Internal Reflection for
BaBar at Pep-II,”
Nucl. Instr. Methods A 397 (1997) 261. - [6] Zygo Corporation, Laurel Brook Road, Middlefield, Connecticut 06455.
- [7] Quartz Products Co., 1600 W. Lee St., Louisville, Kentucky 40201.
- [8] Epoxy Technology, Inc., 14 Fortune Dr., Billerica, Massachusettes 01821.
- [9] Burle Industries, Inc., 1000 New Holland Ave., Lancaster, Pennsylvania 17601.
- [10] Electron Tubes Limited (formerly: Thorn EMI Electron Tubes), Bury Street, Ruislip, Middlesex HA47TA, U.K.
- [11] Optical Coating Laboratory Inc. (OCLI) 2789 Northpoint Pkwy, Santa Rosa, California 95407.
- [12] Hamamatsu Co., 250 Wood Ave, Middlesex, New Jersey 08846.
- [13] Particle Data Group, “Review of Particle Physics,” Physical Review D 54, Part 1 (1996).
- [14] H. Krueger, M. Schneider, R. Reif, J. Va’vra, “Initial Measurements of Quartz Transmission, Internal Reflection Coefficient and the Radiation Damage,” Internal Dirc Note #18, January 1996.
-
[15]
H. Krueger, R. Reif, X. Sarazin, J. Schwiening, J. Va’vra,
“Measuring the Optical Quality of Quartz Bars and the Coupling of RTV
to the Window,”
Internal Dirc Note #40, May 1996;
H. Krueger, R. Reif, X. Sarazin, J. Schwiening and J. Va’vra, “The Optical Scanning System for the Quartz Bar Quality Control,” Internal Dirc Note #54, October 1996. - [16] X. Sarazin, M. Schneider, J. Schwiening, R. Reif and J. Va’vra, “Radiation Damage of Synthetic Quartz and Optical Glues,” Internal Dirc Note #39, May 1996.
- [17] M. Convery, B. Ratcliff, J. Schwiening and J. Va’vra, “Measurements of Periodic Structure in Synthetic Quartz,” Internal Dirc Note #87, September 1997.
- [18] Boeing, 2511 C Broadbent Parkway NE, Albuquerque, New Mexico 87107.