To appear in the Proceedings of the XVIIth International Conference on
Physics in Collision, 1997, Ed. H. Heath, World Scientific, Singapore.
L3 Note 2197
PROPERTIES OF THE W BOSON
The properties of the W boson are reviewed. Particular emphasis is placed on recent measurements from the LEP2 and Tevatron experiments.
1 Introduction
The W boson was discovered?,? by the UA1 and UA2 experiments at the CERN SS collider in 1983. Since then, its properties have been measured by UA1 and UA2, by the CDF? and D? experiments at the FNAL Tevatron, and more recently by ALEPH?, DELPHI?, L3?, and OPAL? at the LEP collider at CERN. In this paper we describe the production and decays of W’s (Sec. 2); the determination of the W width (Sec. 3); constraints on anomalous couplings of the W (Sec. 4); and measurements of the W mass (Sec. 5).
2 W Production and Decay
2.1 W Production and Decay at LEP
W-pairs are produced at LEP II through s-channel and neutrino t-channel processes? (the so-called CC03 processes), as shown in Fig. 1(upper).


Other diagrams, such as those shown in Fig. 1(lower) lead to the same final states and interfere with the CC03 processes. The identification of W-pairs at LEP II is more difficult than that of Z’s at LEP I due to the considerable amount of Standard Model background. At GeV ( pb-1/experiment) the backgrounds are approximately two orders of magnitude more than the signals. At GeV ( pb-1/experiment) the situation is about five times better due to the increasing W-pair cross-section.
The main background to the channel comes from the process which has a cross-section of approximately 150 pb. Signal events are selected by requiring the events to have high multiplicities and low missing energy. Radiative Z return events are rejected. The samples are selected by requiring the event to have two high energy jets and an isolated charged lepton. The neutrino momentum is inferred from the missing energy. The main backgrounds come from mis-identified events and from the four-fermion process in which one of the leptons is undetected. The samples are obtained by requiring the presence of two charged leptons and by excluding high multiplicity (hadronic) events. The dominant backgrounds are from the radiative-return , Bhabha, and two-photon processes.
Tab. 1 shows typical values for W-pair selection efficiencies at LEP and the resulting event sample sizes at GeV and GeV.
| WW event | Selection efficiency (%) | Events/experiment | ||
|---|---|---|---|---|
| sample | GeV | GeV | GeV | GeV |
| 60 | 75 – 85 | 9 – 15 | 55 – 65 | |
| 60 – 80 | 60 – 90 | 11 – 16 | 40 – 50 | |
| 40 – 70 | 45 – 80 | 2 – 6 | 5 – 10 | |
| Total | 22 – 36 | 95 – 120 | ||
After correcting for the measured luminosity, the detector acceptances, reconstruction efficiencies, and backgrounds the experiments have fitted their data to extract the LEP average results?,?,?,?,?,?: %, %, %, where the errors are dominated by the statistical uncertainties. Assuming lepton universality yields?,?,?,?,?,? % and %, in agreement with the Standard Model predictions of % and %. Assuming , the cross-sections (for CC03 processes) are determined to be pb and pb. The W mass-dependence of the cross-section close to threshold is used to determine the W mass, as described in section 5.1.
2.2 W Production and Decay at the Tevatron
The production of W’s in collisions at the Tevatron, which occurs predominantly through quark-antiquark annihilation, is described elsewhere in these proceedings?. For both CDF and D, candidate W events are triggered by a single lepton trigger and are then required to contain a charged lepton with transverse momentum of typically GeV and missing energy of typically GeV. Efficiencies for selecting leptonic W decays, including the effects of the trigger, geometric acceptance, and selection and kinematic cuts, are 25–30% for electrons and 5–10% for muons?. Typical yields for CDF(D) are therefore 700(800) decays/ and 150(350) decays/. The corresponding backgrounds are typically 10–20%. These numbers correspond to the pre-selected samples and can change appreciably in the various analyses as more stringent selection criteria are applied.
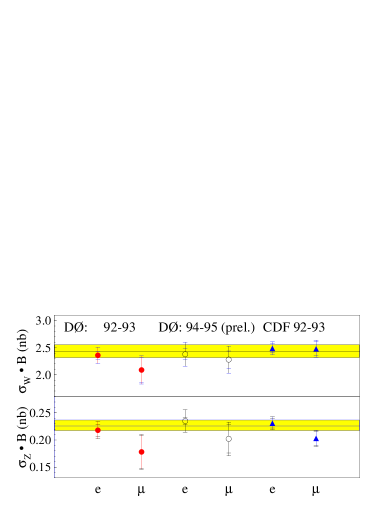
CDF and D have measured the products of the cross-section and leptonic branching ratio, and , using the background-subtracted number of observed events in each channel, corrected for acceptance, efficiency, and luminosity. Such measurements are a good test of our understanding of QCD and the Parton Distribution Functions (PDF’s), for which NLO corrections are 20% and NNLO corrections are about 3%?,?. These calculations predict nb and nb, for the CTEQ2M PDF. Using the theoretical expectation of %? and the LEP measurement of %?, yields expectations of nb and nb, where the errors are dominated by the uncertainties in the PDF. Fig. 2 summarises these measurements and demonstrates the good agreement with the theoretical predictions, shown by the shaded band. In future, experiments may ultimately use measurements of to measure their luminosity.
These measurements may alternatively be used to determine . Experimentally, it is appropriate to measure the ratio , defined as since a number systematics uncertainties cancel, including that from the luminosity determination and some of those from the acceptance and efficiency estimations. Fig. 3(left) summarises the measurements of from the Tevatron and the experiments?.
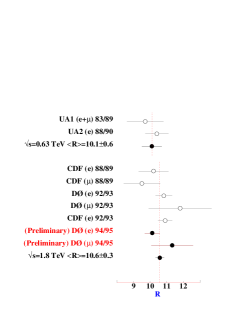
The W leptonic branching ratio is given by The ratio of cross-sections is taken from the theory?,? to be at TeV and at TeV, again with the advantage that some of the systematic uncertainties cancel. The LEP measurement of %? is used. The results from CDF, %?, and from D, %?, are in good agreement with the preliminary measurements from LEP, the average of which is %?.
3 W Width
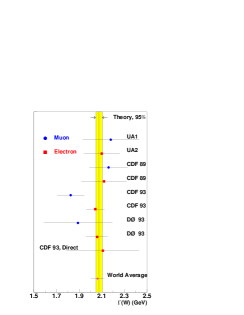
Precise measurements of the W width, like those of the Z width, may yield evidence for non-standard decays involving, for example, supersymmetric particles?,? or heavy quarks?. The ratio measured by the Tevatron and experiments may be used to determine the W width, . Taking MeV from theory?, from theory?,? as above, and the LEP? measurement of yields the results for shown in Fig. 3(right). This figure also shows the less-precise but direct measurement by CDF of from an analysis of the W transverse mass distribution, described in section 5.2.
The world average W width of GeV?, which allows for correlations from the uncertainty in the PDF’s, agrees well with the Standard Model prediction of GeV?. The allowed partial width for non-Standard Model decays is less than 109 MeV at the 95% confidence level.
4 Anomalous Couplings of the W
Triple Gauge Couplings (TGC’s) are central to the Standard Model, for example to preserve unitarity for such sets of diagrams such as those shown in Fig 1(upper). These delicate cancellations are sensitive to physics beyond the Standard Model. The generalised Lorentz-invariant / vertices have 14 couplings. The experiments adopt a pragmatic approach and consider only , , and , which are theoretically favoured?. At tree-level, these may be interpreted in terms of the CP conserving quantities: electric charge, ; magnetic dipole moment: ; and electric quadrupole moment: . There are similar relations, involving also the Weak mixing angle , for , , and . The Standard Model predicts: (i.e. ), (i.e. ), and .
4.1 Anomalous Couplings of the W at LEP
Anomalous couplings at LEP2 are probed by analysing the differential cross-sections for W-pair production in terms of the polar angle of the , and the polar and azimuthal angles of the decay products in the rest frames. Despite the low statistics of the samples, the first TGC results are impressive. For example, an L3 analysis has excluded at 95% C.L.
Using a complementary method, L3 has measured the cross-section at GeV for the single W production? process, , which is sensitive to and . The measured cross-section, pb is consistent with the Standard Model and therefore the following 95% C.L. limits are set: and .
The first LEP TGC results are now being finalised for the (later) summer conferences. In particular they will use a common base set of anomalous couplings parameters and include LEP averages allowing for correlations.
4.2 Anomalous Couplings of the W at the Tevatron
The Tevatron analyses necessarily allow for a form-factor dependence of the anomalous couplings: ; and ; where is the effective centre of mass energy of the process and is the energy scale which is probed for new physics.
The W pair production cross-section is used to constrain the anomalous couplings. For example, CDF has studied the process using . Di-lepton events (ee/e/) with are selected with high efficiency and low backgrounds. The background is reduced by limiting the hadronic (b jet) activity in the event. CDF observes 5 events, with an expected background of events, which corresponds to a cross section of pb. Since this is in agreement with the Standard Model expectation of pb, they obtain the following constraints, for TeV: (for ) and (for ) assuming and .
The processes jet jet and jet jet have also been analysed, with the advantage that they have higher statistics than the analyses. The leptonic W decays are tagged by a high charged lepton and , the hadronic decays by two jets with an invariant mass consistent with , and the Z decays by two charged leptons with an invariant mass consistent with . The large background from W/Z + jets is reduced by requiring the W to have high . The sensitivity to SM WW/WZ production is thereby sacrificed but not the sensitivity to anomalous processes which tend to populate the high region. For TeV, CDF obtains: (for ) and (for ) assuming and . In this analysis, D enhances the sensitivity by fitting the lepton spectrum but, since only the Run 1a data is used, less stringent constraints are obtained.
The radiation of photons from W’s is also sensitive to anomalous couplings. For example, D uses their standard W sample and requires in addition a high transverse energy photon ( GeV). The large background from initial/final state radiation from fermions is suppressed by requiring the photon to be well isolated. From a fit to the spectrum D obtains, for TeV: (for ) and (for ) assuming and .
5 W Mass
At LEP there are two complementary methods for determining the W mass: from measurements of the W-pair production cross-section close to threshold and from the direct reconstruction of the decay products of the W’s. The Tevatron experiments use their high statistics W samples to perform W mass measurements by direct reconstruction.
5.1 W Mass from LEP
Fig. 4(left) shows the variation of the W-pair production cross-section (CC03 processes) in collisions in the threshold region for various values of the W mass as predicted in the context of the Standard Model by the GENTLE? program. For the threshold method the optimum sensitivity to is at , hence the choice of GeV for the initial phase of LEP running in 1996.
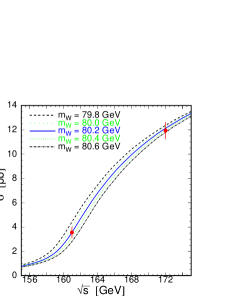
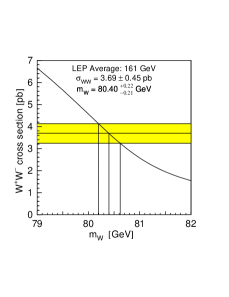
Fig. 4(right) shows the predicted cross-section as a function of , for GeV. Using the measurement, pb the LEP average for is determined to be? GeV. Allowance is made for common systematic errors (0.07 GeV) which include only a small contribution (0.03 GeV) from the uncertainty in the LEP centre-of-mass energy.
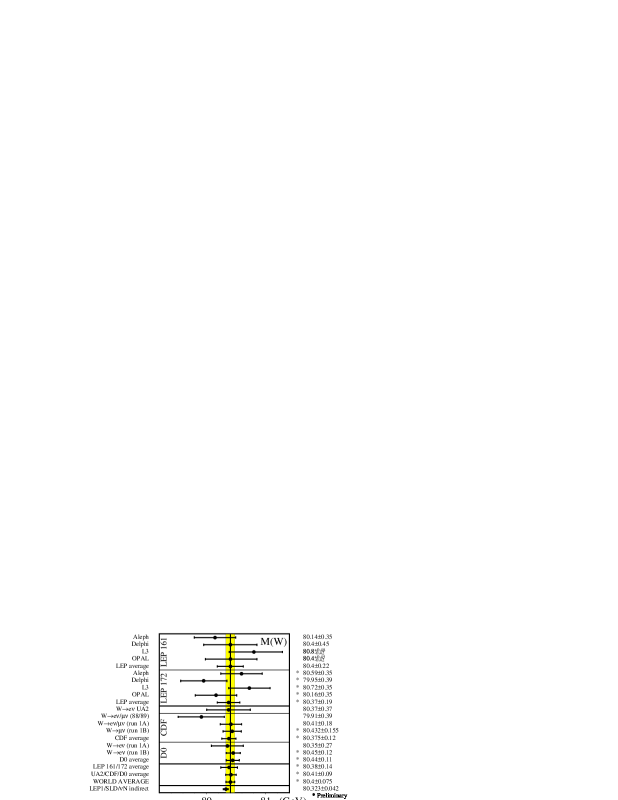
The individual LEP measurements are shown in Fig. 5.
At GeV the W mass is determined by reconstruction of the W decay products using the channels and ?. For the channel, selected events are forced to contain four jets. The two correct pairs of jets yield two measurements of the W mass for each event. There are a number of ways of kinematically reconstructing the W mass for a given event: using the “raw” reconstructed jet pairs; scaling the jet energies such that each pair of jets has the beam energy; performing a 4-C fit by enforcing energy and momentum conservation on the whole event; performing a 5-C fit where the two measured W masses are forced to be equal. Typically, the scaling of the jet energies gives a large improvement while the additional gains of the 4-C and 5-C fits are more modest. There are three possible pairings of jets, only one of which corresponds to the two W decays. Typically the pair with the highest kinematic fit probability is retained although some analyses also use the second pairing if it has a sufficiently high probability. Fig. 6 shows the results of the OPAL W mass analysis
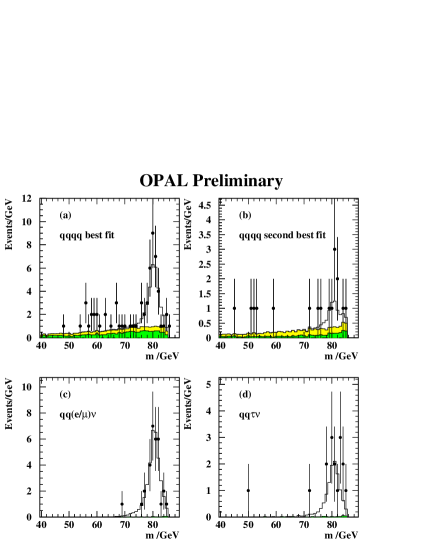
of the channel for (a) the best fit pairing (60 events expected and 67 observed), and (b) the second best fit pairing (17 events expected and 17 observed).
The analyses force the selected events to contain two jets. The charged lepton is reconstructed with high precision and efficiency using standard techniques developed at LEP 1, while the neutrino kinematics are inferred from the missing energy in the event. This channel has no combinatorics and less background than the four-jet channel. However, since reconstruction of the neutrino “uses up” three degrees of freedom, only 1-C or 2-C fits may be used for the extraction of the W mass. Fig. 6 shows the results of the OPAL W mass analysis for (c) (31 events seen for 33 expected) and (d) (16 events seen for 12 expected).
The W mass is obtained from the data assuming that the invariant mass distribution is described by a relativistic Breit-Wigner convoluted with an experimental resolution function and a phase-space function to account for the fit constraints. Biases from the following sources are also taken into account: initial state radiation, the event selection efficiencies, the mass reconstruction, and the fitting method. These are generally determined from Monte Carlo studies of the differences in the true and fitted W masses and applied to the value of obtained from the data. In the L3 analysis, such effects are implicitly included through the use of many Monte Carlo samples (with differing input W masses) which are used to construct the likelihood distribution for the data as a function of .
Fig. 5 summarises the W mass measurements?,? from ALEPH, DELPHI, L3, and OPAL using the data at GeV. The systematic errors on , using OPAL as an example?, include: detector effects (64 MeV); hadronisation (44 MeV); fit procedure (43 MeV); initial state radiation (27 MeV); colour recombination and Bose-Einstein correlations (50 MeV); LEP beam energy uncertainty (30 MeV). The latter two are completely correlated between experiments and are taken into account when deriving the average LEP 172 value ? of GeV. Many of these systematic errors will be reduced as more data are collected and analysed although future reductions in the uncertainty from the colour recombination and Bose-Einstein correlations will require theoretical as well as experimental input.
The average of all the LEP threshold and the direct reconstruction measurements is GeV, where allowance has been made for common systematic errors?.
5.2 W Mass from the Tevatron
The CDF W mass measurements are based on 24 pb-1of data from 1988/89?,? and Run 1a?,? and, more significantly, on pb-1of data from Run 1b?,?. D W mass measurements are based on data from Run 1a? (15 pb-1) and Run 1b?,? (80 pb-1).
W mass measurements from the Tevatron (see review of M. Demarteau? for more details) are based on fits to distributions of transverse mass, , where: and denote the transverse momenta of the charged lepton (e or ) and the neutrino respectively, and denotes the angle between the charged lepton and the neutrino in the transverse plane. The value of is inferred from the measured missing energy, allowing for the luminosity-dependent transverse energy flow of the underlying minimum-bias interactions. The transverse mass is preferred to the transverse momentum of the charged lepton because to first order it is independent of the modelling of the transverse momentum of the W. On the other hand, it relies on the precise and accurate determination of which is a challenging experimental task.
For the W mass measurement it is crucial to understand the energy scale and resolution of the charge lepton measurements. CDF determines the muon momentum scale using measurements of the invariant mass. The extrapolation from the to the higher average momenta of decays, allowing for possible non-linearities, is cross-checked using measurements of the and Z invariant masses. The uncertainty on the muon momentum scale results in a 40 MeV uncertainty on the W mass measurement. D has performed a similar study to determine the electron energy scale, using the measured invariant mass spectra for , , and decays. Possible non-linear effects are constrained using test-beam data. The charged lepton energy resolutions are verified using the samples.
The W mass is determined from the measured distributions by comparison with Monte Carlo distributions with differing input W masses. The Monte Carlo programs generate the W’s as a relativistic Breit-Wigner resonance with a longitudinal momentum distribution according to various PDF models (MRSA′, MRSD′, CTEQ2M, and CTEQ3M). The modelling of the W transverse momentum, the underlying event, and multiple interactions is determined and/or checked using W, Z, and minimum-bias data samples. Background contributions, which are at the few percent level, include decays in which one of the leptons is lost, decays, and mis-identified QCD di-jet events. Fig. 7(upper left) shows the distributions for the background contributions to the CDF Run 1b analysis.


Fig. 7(lower left) shows the data of CDF together with the result of the fit. The uncertainties on the CDF W mass from this analysis?, which are typical of the Tevatron analyses, include the following sources: statistics (100 MeV); momentum scale (40 MeV); momentum resolution (25 MeV); PDF’s (25 MeV); QED (20 MeV); QCD (20 MeV); input of the W’s (40 MeV); recoil model (90 MeV); trigger bias (15 MeV); selection bias (10 MeV); background (25 MeV); and fitting systematics (10 MeV). As a cross-check, both CDF and D also fit the charged lepton and neutrino distributions to extract the W mass. They obtain results which are consistent with the fit results, as shown in Fig. 7(right) for CDF.
The average CDF W mass, allowing for a common error of 60 MeV for all their measurements, is GeV?. After inclusion of the electron channel, CDF anticipates that the final W mass error from the Run 1 data will be 100 MeV?. The average D W mass is GeV?. D anticipates that their final Run 1 W mass analysis, including the end cap region , will yield a W mass error of 100 MeV?. Fig. 5 summarises the W mass measurements from CDF and D. The UA2 result also shown is determined from their measurement of the ratio ?, which is scaled to the LEP value of GeV?. The hadron collider average is GeV, where a common error of 65 MeV has been assumed?.
5.3 Interpretation of W Mass Measurements
Fig. 5 summarises the W mass measurements from ALEPH, DELPHI, L3, OPAL, UA2, CDF, and D. The average of these direct measurements is GeV. This is in good agreement with the indirect prediction from a fit to electroweak measurements? (, , , etc.) of the LEP1, SLC, and N scattering? experiments, which yields GeV?. The fit also results in predictions for the top and Higgs masses, as shown in table 2.
| (GeV) | (GeV) | (GeV) | |
|---|---|---|---|
| LEP1/SLC/N (indirect) | |||
| LEP2/Tevatron (direct) | (unofficial) | ||
| Combined fit |
The indirect determination of is in agreement with the direct measurement of CDF/D of GeV?.
Loop corrections give rise to a quadratic dependence of on and a logarithmic dependence of on , as shown schematically in Fig. 8(left).

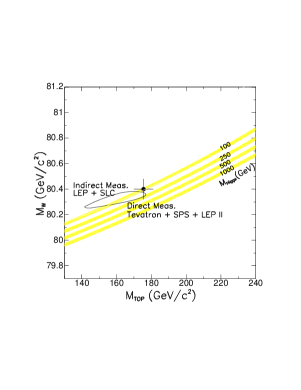
Fig. 8(right) illustrates the variation of with for various values of , shown as bands. The data point denotes the direct measurements of from LEP and the Tevatron and of from the Tevatron. The LEP/SLC/ contour for the indirect determination is consistent with the direct measurements.
A combined fit, in the context of the Standard Model, to the indirect electroweak measurements and the direct measurements of and yields GeV, GeV and GeV. The apparently high significance of the low value of should be interpreted with caution; the likelihood is approximately parabolic in , therefore the upper bound is less constrained than it would appear to be from the quoted error. The upper limit on the Higgs mass at the 95% confidence level is GeV, indicating that the data weakly favour a low mass Higgs.
Acknowledgements
I would like to thank all the people who, sometimes unknowingly, greatly facilitated the preparation of this review, in particular: A. Blondel, S. Christen, R. Clare, M. Demarteau, D. Errede, P. Fisher, M. Grünewald, A. Gurtu, J. Mnich, K. Mönig, T. Paul, C. Paus, D. Stickland, N. Watson, and D. Wood. It is a pleasure to acknowledge the hard work of the organisers who made the conference such a success.
References
- [1] UA1 Collab., G. Arnison et al.. Phys. Lett., B122:103, 1983.
- [2] UA2 Collab., M. Banner et al.. Phys. Lett., B122:476, 1983.
- [3] CDF Collab., F. Abe, et al. Nucl. Instrum. & Methods., A271:387, 1988.
-
[4]
D0 Collab., S.Abachi et al., Nucl. Instr. & Meth. A338 (1994)
185;
D0 Collab., H.Aihara et al., Nucl. Instr. & Meth. A325 (1993) 393;
D0 Collab., S.Abachi et al., Nucl. Instr. & Meth. A324 (1993) 53. -
[5]
ALEPH Collab., D.Decamp et al., Nucl. Instr. & Meth. A294
(1990) 121;
ALEPH Collab., D.Buskulic et al., Nucl. Instr. & Meth. A360 (1995) 481. -
[6]
DELPHI Collab., P.Aarnio et al., Nucl. Instr. & Meth. A303
(1991) 233;
DELPHI Collab., P.Abreu et al., Nucl. Instr. & Meth. A378 (1996) 57. -
[7]
L3 Collab., B. Adeva et al., Nucl. Instr. & Meth. A 289 (1990)
35;
M. Acciarri et al., Nucl. Instr. & Meth. A 351 (1994) 300;
M. Chemarin et al., Nucl. Instr. & Meth. A 349 (1994) 345;
A. Adam et al., Preprint CERN-PPE/96–097 to be published in Nucl. Instr. & Meth. ;
I.C. Brock et al., Nucl. Instr. & Meth. A 381 (1996) 236. -
[8]
OPAL Collab., K.Ahmet et al., Nucl. Instr. & Meth. A305 (1991)
275;
OPAL Collab., P.Allport, et al., Nucl. Instr. & Meth. A324 (1993) 34;
OPAL Collab., P.Allport, et al., Nucl. Instr. & Meth. A346 (1994) 476. - [9] G. Altarelli, T. Sjöstrand and F. Zwirner (eds.). Physics at LEP2. CERN Yellow Report, 96-01:1, 1996.
- [10] ALEPH Collab., R. Barate et al.. Measurement of the W Mass in Collisions at Production Threshold. CERN-PPE, 97-025, 1997. Submitted to Phys. Lett. B.
- [11] DELPHI Collab., P. Abreu et al.. Phys. Lett., B397:158, 1997.
- [12] L3 Collab., M. Acciarri et al.. Pair-Production of W Bosons in Interactions at GeV. CERN-PPE, 97-014, 1997. Accepted by Phys. Lett. B.
- [13] OPAL Collab., K. Ackerstaff et al.. Phys. Lett., B389:416, 1996.
- [14] Private communication with the LEP Collaborations and the LEP/SLD Electroweak Working Group. See also: http://www.cern.ch/LEPEWWG/.
- [15] A. Gurtu. W Production and Mass Measurements at LEP II. In Proceedings of the 11th Rencontre de la Vallee d’Aoste on Results and Perspectives in Particle Physics, La Thuile, Italy, 2-8 March 1997.
- [16] G. Guglielmo, these proceedings.
- [17] M. Demarteau. Electroweak Measurements from the Tevatron. In Proceedings of the Workshop on New Directions for High Energy Physics (Snowmass96), Snowmass, Colorado, USA, 25 June - 12 July 1996. Available as a preprint: Fermilab-Conf-96/353 or hep-ex/9611018.
- [18] R. Hamberg, W.L. van Neerven and T. Matsuura. Nucl. Phys., B359:343, 1991.
- [19] W.L. van Neerven and E.B. Zijlstra. Nucl. Phys., B382:11, 1992.
- [20] T. Takeuchi J.L. Rosner, M.P. Worah. Phys. Rev., D49:1363, 1994.
- [21] Particle Data Group, R. M. Barnett et al. Phys. Rev., D54:1, 1996.
- [22] D. Wood. Electroweak Physics from D0. In Proc. of the XXXIInd Rencontres de Moriond, Les Arcs, France, 15-22 March 1997.
- [23] V. Barger et al. Phys. Rev., D28:2912, 1983.
- [24] X. Tata M. Drees, C.S. Kim. Phys. Rev., D37:784, 1988.
- [25] J. Terrón T. Alvarez, A. Leites. Nucl. Phys., B301:1, 1988.
- [26] L3 Collab., M. Acciarri et al.. Production of Single W Bosons at LEP. CERN-PPE, 97-28, 1997. Submitted to Phys. Lett. B.
- [27] D. Bardin, A. Leike, and T. Riemann. Phys. Lett., B344:383, 1995.
- [28] M. Thomson. W Mass at LEP2 from Direct Reconstruction. In Proc. of the XXXIInd Rencontres de Moriond, Les Arcs, France, 15-22 March 1997.
- [29] CDF Collab., F. Abe et al.. Phys. Rev. Lett., 65:2243, 1990.
- [30] CDF Collab., F. Abe et al.. Phys. Rev., D43:2070, 1991.
- [31] CDF Collab., F. Abe et al.. Phys. Rev. Lett., 75:11, 1995.
- [32] CDF Collab., F. Abe et al.. Phys. Rev., D52:4784, 1995.
- [33] A. Gordon. Measurement with Decays at CDF for Run 1b. In Proc. of the XXXIInd Rencontres de Moriond, Les Arcs, France, 15-22 March 1997.
-
[34]
CDF Collab., D. Errede, private communication.
See also: http://www-cdf.fnal.gov/physics/ewk/wmass.html. - [35] D0 Collab., S. Abachi et al.. Phys. Rev. Lett., 77:3309, 1996.
-
[36]
D0 Collab., D. Wood, private communication.
See also: http://www-d0.fnal.gov/public/wz/wmass/wmass.html. - [37] J. Alitti et al.. Phys. Lett., B276:365, 1992.
- [38] P. Clarke, these proceedings.
- [39] K. S. McFarland et al.. FNAL-Pub-97, 001-E, 1997. (to be published).
- [40] R. Raja. “Top Quark Mass Results from CDF and D0”. In Proceedings of the XXXIInd Rencontres de Moriond, Gif-sur-Yvette, France, 1997. Editions Frontières.