Polarization of and in 920 GeV Fixed-Target Proton-Nucleus Collisions
I. Abt23, M. Adams10, M. Agari13, H. Albrecht12, A. Aleksandrov29, V. Amaral8, A. Amorim8, S. J. Aplin12, V. Aushev16, Y. Bagaturia12,36, V. Balagura22, M. Bargiotti6, O. Barsukova11, J. Bastos8, J. Batista8, C. Bauer13, Th. S. Bauer1, A. Belkov11,†, Ar. Belkov11, I. Belotelov11, A. Bertin6, B. Bobchenko22, M. Böcker26, A. Bogatyrev22, G. Bohm29, M. Bräuer13, M. Bruinsma28,1, M. Bruschi6, P. Buchholz26, T. Buran24, J. Carvalho8, P. Conde2,12, C. Cruse10, M. Dam9, K. M. Danielsen24, M. Danilov22, S. De Castro6, H. Deppe14, X. Dong3, H. B. Dreis14, V. Egorytchev12, K. Ehret10, F. Eisele14, D. Emeliyanov12, S. Erhan19,37, S. Essenov22, L. Fabbri6, P. Faccioli6, M. Feuerstack-Raible14, J. Flammer12, B. Fominykh22, M. Funcke10, Ll. Garrido2, A. Gellrich29, B. Giacobbe6, J. Gläß20, D. Goloubkov12,33, Y. Golubkov12,34, A. Golutvin22, I. Golutvin11, I. Gorbounov12,26, A. Gorišek17, O. Gouchtchine22, D. C. Goulart7, S. Gradl14, W. Gradl14, F. Grimaldi6, Yu. Guilitsky22,35, J. D. Hansen9, J. M. Hernández29, W. Hofmann13, M. Hohlmann12, T. Hott14, W. Hulsbergen1, U. Husemann26, O. Igonkina22, M. Ispiryan15, T. Jagla13, C. Jiang3, H. Kapitza12, S. Karabekyan25, N. Karpenko11, S. Keller26, J. Kessler14, F. Khasanov22, Yu. Kiryushin11, I. Kisel23, E. Klinkby9, K. T. Knöpfle13, H. Kolanoski5, S. Korpar21,17, C. Krauss14, P. Kreuzer12,19, P. Križan18,17, D. Krücker5, S. Kupper17, T. Kvaratskheliia22, A. Lanyov11, K. Lau15, B. Lewendel12, T. Lohse5, B. Lomonosov12,32, R. Männer20, R. Mankel29, S. Masciocchi12, I. Massa6, I. Matchikhilian22, G. Medin5, M. Medinnis12, M. Mevius12, A. Michetti12, Yu. Mikhailov22,35, R. Mizuk22, R. Muresan9, M. zur Nedden5, M. Negodaev12,32, M. Nörenberg12, S. Nowak29, M. T. Núñez Pardo de Vera12, M. Ouchrif28,1, F. Ould-Saada24, C. Padilla12, D. Peralta2, R. Pernack25, R. Pestotnik17, B. AA. Petersen9, M. Piccinini6, M. A. Pleier13, M. Poli6,31, V. Popov22, D. Pose11,14, S. Prystupa16, V. Pugatch16, Y. Pylypchenko24, J. Pyrlik15, K. Reeves13, D. Reßing12, H. Rick14, I. Riu12, P. Robmann30, I. Rostovtseva22, V. Rybnikov12, F. Sánchez13, A. Sbrizzi1, M. Schmelling13, B. Schmidt12, A. Schreiner29, H. Schröder25, U. Schwanke29, A. J. Schwartz7, A. S. Schwarz12, B. Schwenninger10, B. Schwingenheuer13, F. Sciacca13, N. Semprini-Cesari6, S. Shuvalov22,5, L. Silva8, L. Sözüer12, S. Solunin11, A. Somov12, S. Somov12,33, J. Spengler12, R. Spighi6, A. Spiridonov29,22, A. Stanovnik18,17, M. Starič17, C. Stegmann5, H. S. Subramania15, M. Symalla12,10, I. Tikhomirov22, M. Titov22, I. Tsakov27, U. Uwer14, C. van Eldik12,10, Yu. Vassiliev16, M. Villa6, A. Vitale6, I. Vukotic5,29, H. Wahlberg28, A. H. Walenta26, M. Walter29, J. J. Wang4, D. Wegener10, U. Werthenbach26, H. Wolters8, R. Wurth12, A. Wurz20, Yu. Zaitsev22, M. Zavertyaev12,13,32, T. Zeuner12,26, A. Zhelezov22, Z. Zheng3, R. Zimmermann25, T. Živko17, A. Zoccoli6
1NIKHEF, 1009 DB Amsterdam, The Netherlands a
2Department ECM, Faculty of Physics, University of Barcelona, E-08028 Barcelona, Spain b
3Institute for High Energy Physics, Beijing 100039, P.R. China
4Institute of Engineering Physics, Tsinghua University, Beijing 100084, P.R. China
5Institut für Physik, Humboldt-Universität zu Berlin, D-12489 Berlin, Germany c,d
6Dipartimento di Fisica dell’ Università di Bologna and INFN Sezione di Bologna, I-40126 Bologna, Italy
7Department of Physics, University of Cincinnati, Cincinnati, Ohio 45221, USA e
8LIP Coimbra, P-3004-516 Coimbra, Portugal f
9Niels Bohr Institutet, DK 2100 Copenhagen, Denmark g
10Institut für Physik, Universität Dortmund, D-44221 Dortmund, Germany d
11Joint Institute for Nuclear Research Dubna, 141980 Dubna, Moscow region, Russia
12DESY, D-22603 Hamburg, Germany
13Max-Planck-Institut für Kernphysik, D-69117 Heidelberg, Germany d
14Physikalisches Institut, Universität Heidelberg, D-69120 Heidelberg, Germany d
15Department of Physics, University of Houston, Houston, TX 77204, USA e
16Institute for Nuclear Research, Ukrainian Academy of Science, 03680 Kiev, Ukraine h
17J. Stefan Institute, 1001 Ljubljana, Slovenia i
18University of Ljubljana, 1001 Ljubljana, Slovenia
19University of California, Los Angeles, CA 90024, USA j
20Lehrstuhl für Informatik V, Universität Mannheim, D-68131 Mannheim, Germany
21University of Maribor, 2000 Maribor, Slovenia
22Institute of Theoretical and Experimental Physics, 117259 Moscow, Russia k
23Max-Planck-Institut für Physik, Werner-Heisenberg-Institut, D-80805 München, Germany d
24Dept. of Physics, University of Oslo, N-0316 Oslo, Norway l
25Fachbereich Physik, Universität Rostock, D-18051 Rostock, Germany d
26Fachbereich Physik, Universität Siegen, D-57068 Siegen, Germany d
27Institute for Nuclear Research, INRNE-BAS, Sofia, Bulgaria
28Universiteit Utrecht/NIKHEF, 3584 CB Utrecht, The Netherlands a
29DESY, D-15738 Zeuthen, Germany
30Physik-Institut, Universität Zürich, CH-8057 Zürich, Switzerland m
31visitor from Dipartimento di Energetica dell’ Università di Firenze and INFN Sezione di Bologna, Italy
32visitor from P.N. Lebedev Physical Institute, 117924 Moscow B-333, Russia
33visitor from Moscow Physical Engineering Institute, 115409 Moscow, Russia
34visitor from Moscow State University, 119899 Moscow, Russia
35visitor from Institute for High Energy Physics, Protvino, Russia
36visitor from High Energy Physics Institute, 380086 Tbilisi, Georgia
37Physics Department, CERN, Geneve 1211, Switzerland
†deceased
a supported by the Foundation for Fundamental Research on Matter (FOM), 3502 GA Utrecht, The Netherlands
b supported by the CICYT contract AEN99-0483
c supported by the German Research Foundation, Graduate College GRK 271/3
d supported by the Bundesministerium für Bildung und Forschung, FRG, under contract numbers 05-7BU35I, 05-7DO55P, 05-HB1HRA, 05-HB1KHA, 05-HB1PEA, 05-HB1PSA, 05-HB1VHA, 05-HB9HRA, 05-7HD15I, 05-7MP25I, 05-7SI75I
e supported by the U.S. Department of Energy (DOE)
f supported by the Portuguese Fundação para a Ciência e Tecnologia under the program POCTI
g supported by the Danish Natural Science Research Council
h supported by the National Academy of Science and the Ministry of Education and Science of Ukraine
i supported by the Ministry of Education, Science and Sport of the Republic of Slovenia under contracts number P1-135 and J1-6584-0106
j supported by the U.S. National Science Foundation Grant PHY-9986703
k supported by the Russian Ministry of Education and Science, grant SS-1722.2003.2, and the BMBF via the Max Planck Research Award
l supported by the Norwegian Research Council
m supported by the Swiss National Science Foundation
Abstract
A measurement of the polarization of and baryons produced in and collisions at GeV has been performed with the HERA B spectrometer. The measurements cover the kinematic range of GeV/c GeV/c in transverse momentum and in Feynman-x. The polarization results from the two different targets agree within the statistical error. In the combined data set, the largest deviation from zero, , is measured for . Zero polarization is expected at in the absence of nuclear effects. The polarization results for the agree with a parametrization of previous measurements which were performed at positive values, where the polarization is negative. Results of polarization measurements are consistent with zero.
1 Introduction
Previous measurements (see e.g. Refs. [1, 2]) have, contrary to expectations, shown that ’s and other hyperons produced in unpolarized hadron-hadron interactions are transversely polarized. For ’s, the magnitude of the polarization is observed to depend on the kinematic variables. For fixed-target interactions usually the momentum transverse to the beam direction, , and its Feynman-x, taken to be , are used. Here is the longitudinal momentum of the hyperon relative to beam direction as measured in the center of mass of the beam proton and target nucleon. The magnitude of the polarization is observed to increase with and decrease as approaches zero. No existing model adequately describes the observations. (For general introductions to the topic of polarization and overviews of previous results and models see Refs. [3, 4].) Additional experimental input in previously unmeasured kinematic regions could provide additional insight into the mechanism responsible for the polarization.
Most previous measurements were performed at positive , the only exceptions being low statistics measurements from bubble chamber experiments [5] which probe the polarization over the full phase space. In this letter, we report a new measurement of and (henceforth designated ) polarizations in inclusive 920 GeV proton-nucleus interactions, predominately at negative and in the range of GeV/c GeV/c.
The polarization is inferred from the magnitude of the angular asymmetry of protons resulting from the decay , as observed in the rest-frame. For each event the coordinate system is defined such that the axis coincides with the boost vector from the laboratory system to the rest-frame. The direction is the normal to the production plane as defined by the cross product of the beam direction as seen in the rest frame with the axis () and . Since the ’s are produced via parity-conserving strong interactions, polarization can only occur transverse to the production plane [6], corresponding to the direction. The polarization is measurable since the ’s decay via a parity-nonconserving weak process.
The expected intensities are:
| (1) |
where . is the polarization, is the detector acceptance and is the asymmetry parameter of the decay. For the the equations are modified by substituting: and .
2 Detector, Data Sample and Event Selection
The data sample used for this analysis was collected with the fixed-target HERA B spectro-meter operating at the 920 GeV proton storage ring of HERA, at DESY. The target consists of thin wires of various materials – for this measurement, carbon (C) and tungsten (W) – dynamically positioned in the halo of the proton beam. Particles produced in collisions are measured using a variety of sub-detector systems, the most important for this paper being the silicon vertex detector (VDS) [7] and the outer tracker (OTR) [8]. The VDS is positioned immediately downstream of the target and consists of 8 planar stations with a total of 64 double-sided silicon microstrip detectors. The VDS is followed by a large aperture 2.13 Tm magnet and the OTR, which consists of 7 planar stations of honeycomb drift chambers. The spectrometer has a large angular coverage: 15 mrad to 220 mrad in the horizontal (bending) plane and 15 mrad to 160 mrad in the vertical plane. A Ring Imaging Cerenkov detector (RICH) and an electromagnetic calorimeter (ECAL) cover the full aperture and, for the purposes of this measurement, are only used to provide a minimum bias trigger: events are required to have either 20 hits in the RICH (corresponding to 60% of the expected yield of a single relativistic charged particle) or at least one ECAL cluster with an energy of at least 1 GeV. More details on the spectrometer can be found in Ref. [9] and references therein.
The data sample consists of a total of 119 million events from two targets: 55 million from the carbon target sample and 64 million events from the tungsten target sample (henceforth referred to as the C-target and W-target samples). The events are selected from single wire runs and consist mainly of single interactions, with approximately 10% having more than one interaction.
The detector acceptance is determined from Monte Carlo simulations (MC). Fritiof 7.02 [10] is used as event generator, and a GEANT 3.21-based detector model simulates the detector response [11]. The generated decay angle distributions are flat in . The generated and distributions of the ’s were tuned such that the reconstructed MC distributions are in agreement with the uncorrected data in the kinematic range of the measurement.
Segments of tracks are reconstructed in the VDS and OTR independently requiring at least five and six hits, respectively. Segments are then combined to tracks with the constraint that each segment is only allowed in one track. No particle identification cuts are applied. A candidate is initially identified as two oppositely-charged tracks forming a common vertex downstream of the target. Using the signal, , and background, , from data, an optimization of the signal significance, , is performed with respect to three discriminating variables, with the resulting cuts:
-
•
The impact parameter of the candidate to the closest primary vertex is required to be less than .
-
•
The maximal allowed distance of closest approach between the two decay tracks is .
-
•
The flight path of the candidate times the sum of the momenta of the decay tracks transverse to the direction of propagation of the candidate is required to be larger than 0.15 cmGeV/c.
An effect of the first cut is, according to MC studies, that the fraction of cascade ’s is suppressed by a factor of approximately 10, so that only of ’s in the final signal originates from cascade decays. The invariant mass of the candidate is calculated under the assumption that the positive track is a proton and the negative track is a pion. Only candidates with masses in the mass range: [1.10; 1.13] GeV/c2 are considered in the analysis. candidates which are also consistent with a hypothesis are rejected by eliminating those candidates whose invariant mass when calculated under the assumption that both tracks are pions, lies within the mass window (i.e. less than from the nominal mass). This cut ensures that the percentage of misidentified ’s is less than 0.3%. The analogous search is made for ’s. Finally, we consider only ’s in the range and . The invariant mass distributions for selected and candidates from the W-target sample are shown in Fig. 1(a) and Fig. 1(b), respectively. The distributions for the C-target sample are similar. According to fits using two Gaussians to describe the signal and a second order polynomial to describe the background, the C-target and W-target samples contain (47K/23K) and (84K/37K) ’s, respectively. Depending on the kinematic range (see Sect. 3), the background constitutes of the signal, but since events from the side-bins of the mass distribution show no significant dependence on , the background contribution to the polarization is negligible.


3 Results
The polarization is determined separately in three intervals of similar event statistics: and . For each interval, and for both real data and MC, the events are split into four bins of equal size in and the mass spectra for each bin are fitted. The corrected distribution is the ratio: of data to MC normalized to the same total number of events. The resulting corrected distributions are plotted in Fig. 2. Since the MC sample is generated flat in , this ratio should be flat if the ’s are unpolarized, and otherwise be a linear function of according to Eq. (1).
The results are summarized in Tables 1 and 2 for the C-target and W-target samples separately. The measured polarizations in C-target and W-target samples are consistent in all intervals. We therefore follow the approach of previous measurements and present results averaged over the two data samples, see Table 4. The statistical uncertainties of the polarization measurements are larger than the corresponding measurements due to the factor of approximately two difference in statistics.


| [GeV/c] | |||
|---|---|---|---|
| [GeV/c] | |||
|---|---|---|---|
The fact that and polarizations are small near compared to the maximal measured value of at [13] is not surprising for at least two reasons: firstly, previous measurements at positive show that the magnitude of polarization decreases with [2], and secondly, in collisions, the polarization must be an antisymmetric function of for symmetry reasons (i.e. to avoid the ambiguity which would otherwise be encountered, since there is no a priori reason to favor the beam proton direction over the target proton direction when defining the production plane at ). Any non-zero polarization near in the present measurement would then necessarily come from either a difference in polarization in interactions with neutrons compared to protons or nuclear effects. Previous attempts to measure nuclear effects in polarization show that, in the forward region, any such effects can only be very weak [4].
4 Systematic studies
We discuss separately two categories of possible systematic errors: those due to possible inaccuracies in the MC detector description (), and those due to the method of extracting the signal (). An additional rather insignificant contribution to the systematic error is introduced by the uncertainty of the decay asymmetry parameter , as obtained from the PDG [12]. The final estimates for each of these three sources is given in Table 3.
| interval | [-0.15; -0.07] | [-0.07; -0.04] | [-0.04; 0.01] |
|---|---|---|---|
| 0.022 | 0.022 | 0.022 | |
| -0.004 | 0.000 | +0.002 | |
| 0.001 | 0.000 | 0.001 | |
| 0.029 | 0.029 | 0.029 | |
| +0.002 | +0.006 | -0.003 | |
| 0.000 | 0.000 | ||
To establish limits on biases due to an imperfect MC efficiency
determination, we first evaluate the asymmetry in the
distributions for various subsamples. Any asymmetry in
could only be due to detector bias (see
Sec. 1). The limits are evaluated separately for and since their decay products traverse rather different parts
of the spectrometer due to bending in the spectrometer magnetic field.
For each of three intervals and for each of the two targets, the
data set is divided into (approximate) halves according to the directions
of the produced ’s as seen in the lab frame, e.g. up/down,
left/right and at various angles in the transverse plane. For each such pair
of subsamples, the asymmetry difference, a quantity which should be
consistent with zero, is evaluated.
The largest deviation from zero was found between the up and down
subsamples. To avoid correlations, we therefore use only
the up/down subsamples as a basis for the evaluation. The data is
thus divided into a total of 12 subsamples for which the asymmetry is
separately evaluated. The sum, with each term weighted by the inverse
square of its statistical error, is formed and interpreted
as a statistic
for 12 degrees of freedom. The systematic error is estimated by
dividing the obtained number by where is determined by
requiring the resulting to correspond to a
probability. The systematic error estimate due to possible acceptance
distortions is then the average of the statistical errors in the three
bins multiplied by . The results are given in Table 3.
Similar results were obtained in a cross check analysis using
rather than
, where and
refers to ’s propagating in the direction of upper/lower hemisphere
in the lab frame.
As a cross check of the systematic error, the apparent polarization
was determined using the same method as for .
Since is a pseudo-scalar meson, it cannot be polarized. The result for is that even for , the probability for zero polarization exceeds .
An additional systematic error, , could result from
the fitting procedure used to
extract the number of signal events in each bin. An alternative to
the fit procedure, namely counting the number of candidates
in the signal region of the mass plot and subtracting background, as
estimated from side-bins was checked.
Estimates of the individual contributions to the systematic error are shown in Table 3. Of the three sources considered, the first dominates. Note also that the first contribution is correlated between the three bins since the decay products corresponding to the different bins traverse the same detector elements. The second is proportional to the measured polarization and the third is not correlated with the first two. To be conservative, the correlations are ignored, and the total systematic error (see Table 4) is calculated by adding the individual contributions of Table 3 in quadrature.
5 Discussion
The present measurements are performed in three bins which are integrated over a interval common to all bins. In contrast, most previous measurements were performed in relatively small lab-frame angular apertures, and thus, unlike the present measurement, have strong correlations between the average and values of the reported results. Consequently, a comparison is non-trivial. Furthermore, a point by point comparison is not possible for two reasons: very few publications supply all the needed information (the average and values of the measured points), and, the region of the present measurement does not overlap with the regions of previous measurements. Instead, we compare our results to a parameterization of measurements given in Ref. [13], which describes measurements from four experiments performed at GeV proton beam energy with hydrogen and beryllium targets, at various targeting angles. Those results cover the range [0.1;0.5], and are fitted to a simple expression with factorized and dependences:
| (2) |
The fitted coefficients are: , and .
| [GeV/c] | ||||
|---|---|---|---|---|
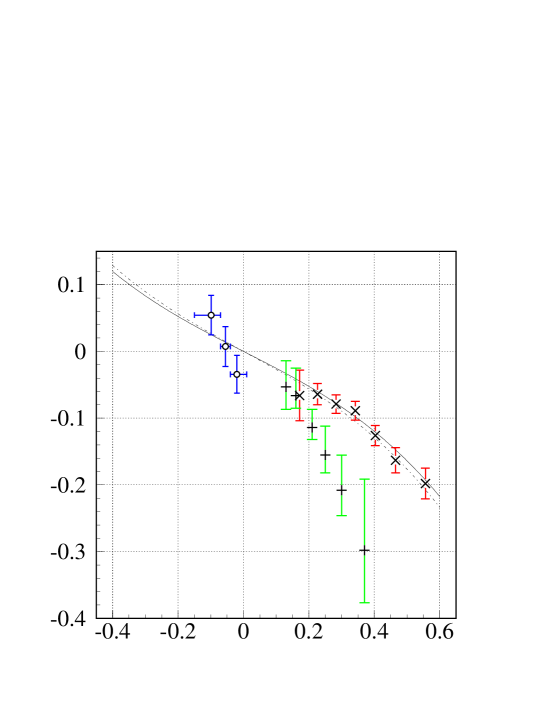
In Ref. [3] it is argued that the polarization dependence on CM energy is weak. Assuming complete energy independence, the functional form of Eq. (2) can be checked against more recent and independent GeV measurements [2]. The comparison is shown in Fig. 3, where the solid curve corresponds to Eq. (2) with = 0.77 GeV/c, the equivalent obtained by averaging () for the present measurement and the dashed curve corresponds to Eq. (2) with infinite Except for the lowest point, the measurements of Ref. [2] are at larger than the present results, and should therefore correspond to a curve lying between the two displayed curves. The data are clearly consistent with the parameterization. Also shown in Fig. 3 are the three HERA B measurements, which are also compatible with the extrapolation of the parameterization to negative The values of corresponding to the HERA B points are given in Table 4.
The third dataset shown in Fig. 3 are results from NA48 [14]111In Ref. [2, 14] is defined in the laboratory system. This gives rise to small shifts in the calculation as compared to our definition.. The NA48 data, albeit taken at a similar and in a similar kinematic regime as the measurements parametrized by Eq. (2), are not described by this parameterization and are inconsistent with Ref. [13].
Previous measurements of polarization include: [13], [2], and [14]. These numbers are average values for the specific kinematic ranges covered by each experiment and are therefore not directly comparable. Nonetheless, all results are consistent with zero and in agreement with our measurement.
6 Conclusion
A measurement of the inclusive polarization has been
performed in the range:
[-0.15; 0.01] and the interval:
[0.6; 1.2] GeV/c using ’s produced in and
collisions. As the polarization results from the two targets agree within
their statistical uncertainties, we see no evidence of nuclear effects.
The magnitude of the polarization is less than and
measurements suggest an increase of the polarization with an increase
of .
When combining the data from the two targets, the largest deviation from zero polarization, , is measured for .
Zero polarization is expected at in the absence of
nuclear effects.
The polarization measurements are consistent with a
parameterization, , of earlier measurements performed at
positive where the polarization is negative.
The polarization measurements are consistent
with zero.
Acknowledgments
We are grateful to the DESY laboratory and to the DESY accelerator group for their strong support since the conception of the HERA B experiment. Also, we would like to thank the technical and administrative staff without whom the HERA B experiment would not have been possible.
References
- [1] Heller, K. J. et al., Phys. Rev. Lett. 41, 607 (1978).
- [2] Ramberg, E. J. et al. (E799 Collaboration), Phys. Lett. B 338, 403 (1994).
- [3] Heller, K. J., Spin and high energy hyperon production, results and prospects, Prepared for 12th International Symposium on High-energy Spin Physics (SPIN 96), Amsterdam, Netherlands, 10-14 Sep 1996 (1996).
- [4] Soffer, J., hep-ph/9911373 (1999).
- [5] Yuldashev, B. S. et al., Phys. Rev. D 43, 2792 (1991).
- [6] Perkins, D. H., Introduction to High-Energy Physics, Addison-Wesley (1982).
- [7] Bauer, C. et al., Nucl. Instr. Meth. A 501 39, (2003).
- [8] Albrecht, H. et al., Nucl. Instr. Meth. A 541, 610 (2005); Nucl. Instr. and Meth. A 555, 310 (2005).
- [9] Abt, I. et al. (HERA-B collaboration), Phys. Rev. D.73, 052005 (2006).
- [10] Pi, H., Comput. Phys. Commun. 71, 173 (1992).
- [11] Brun, R., et al., GEANT3, Internal Report CERN-DD/EE/84-1, CERN (1987).
- [12] Eidelman, S. et al., Review of particle physics, Phys. Lett. B 592, 1 (2004).
- [13] Lundberg, B. et al., Phys. Rev. D 40, 3557 (1989).
- [14] Fanti, V. et al. (NA48 Collaboration), Eur.Phys.J. C 6, 265 (1999).