M. Ablikim1, J. Z. Bai1, Y. Ban12,
J. G. Bian1, X. Cai1, H. F. Chen17,
H. S. Chen1, H. X. Chen1, J. C. Chen1,
Jin Chen1, Y. B. Chen1, S. P. Chi2,
Y. P. Chu1, X. Z. Cui1, Y. S. Dai19,
L. Y. Diao9,
Z. Y. Deng1, Q. F. Dong15,
S. X. Du1, J. Fang1,
S. S. Fang2, C. D. Fu1, C. S. Gao1,
Y. N. Gao15, S. D. Gu1, Y. T. Gu4,
Y. N. Guo1, Y. Q. Guo1, Z. J. Guo16,
F. A. Harris16, K. L. He1, M. He13,
Y. K. Heng1, H. M. Hu1, T. Hu1,
G. S. Huang1a, X. T. Huang13,
X. B. Ji1, X. S. Jiang1,
X. Y. Jiang5, J. B. Jiao13,
D. P. Jin1, S. Jin1, Yi Jin8,
Y. F. Lai1, G. Li2, H. B. Li1,
H. H. Li1, J. Li1, R. Y. Li1,
S. M. Li1, W. D. Li1, W. G. Li1,
X. L. Li1, X. N. Li1,
X. Q. Li11, Y. L. Li4,
Y. F. Liang14, H. B. Liao1,
B. J. Liu1,
C. X. Liu1,
F. Liu6, Fang Liu1, H. H. Liu1,
H. M. Liu1, J. Liu12, J. B. Liu1,
J. P. Liu18, Q. Liu1,
R. G. Liu1, Z. A. Liu1,
Y. C. Lou5,
F. Lu1, G. R. Lu5,
J. G. Lu1, C. L. Luo10, F. C. Ma9,
H. L. Ma1, L. L. Ma1, Q. M. Ma1,
X. B. Ma5, Z. P. Mao1, X. H. Mo1,
J. Nie1, S. L. Olsen16,
H. P. Peng17b, R. G. Ping1,
N. D. Qi1, H. Qin1, J. F. Qiu1,
Z. Y. Ren1, G. Rong1, L. Y. Shan1,
L. Shang1, C. P. Shen1,
D. L. Shen1, X. Y. Shen1,
H. Y. Sheng1,
H. S. Sun1, J. F. Sun1, S. S. Sun1,
Y. Z. Sun1, Z. J. Sun1, Z. Q. Tan4,
X. Tang1, G. L. Tong1,
G. S. Varner16, D. Y. Wang1, L. Wang1,
L. L. Wang1,
L. S. Wang1, M. Wang1, P. Wang1,
P. L. Wang1, W. F. Wang1c, Y. F. Wang1,
Z. Wang1, Z. Y. Wang1, Zhe Wang1,
Zheng Wang2, C. L. Wei1, D. H. Wei1,
N. Wu1, X. M. Xia1, X. X. Xie1,
G. F. Xu1, X. P. Xu6, Y. Xu11,
M. L. Yan17, H. X. Yang1,
Y. X. Yang3, M. H. Ye2,
. X. Ye17, Z. Y. Yi1, G. W. Yu1,
C. Z. Yuan1, J. M. Yuan1, Y. Yuan1,
S. L. Zang1, Y. Zeng7, Yu Zeng1,
B. X. Zhang1, B. Y. Zhang1, C. C. Zhang1,
D. H. Zhang1, H. Q. Zhang1,
H. Y. Zhang1, J. W. Zhang1,
J. Y. Zhang1, S. H. Zhang1, X. M. Zhang1,
X. Y. Zhang13, Yiyun Zhang14, Z. P. Zhang17,
D. X. Zhao1, J. W. Zhao1,
M. G. Zhao1, P. P. Zhao1, W. R. Zhao1,
Z. G. Zhao1d, H. Q. Zheng12, J. P. Zheng1,
Z. P. Zheng1, L. Zhou1,
N. F. Zhou1d,
K. J. Zhu1, Q. M. Zhu1, Y. C. Zhu1,
Y. S. Zhu1, Yingchun Zhu1b, Z. A. Zhu1,
B. A. Zhuang1, X. A. Zhuang1, B. S. Zou1
(BES Collaboration)
1 Institute of High Energy Physics, Beijing 100049, People’s Republic of China
2 China Center for Advanced Science and Technology (CCAST), Beijing 100080, People’s Republic of China
3 Guangxi Normal University, Guilin 541004, People’s Republic of China
4 Guangxi University, Nanning 530004, People’s Republic of China
5 Henan Normal University, Xinxiang 453002, People’s Republic of China
6 Huazhong Normal University, Wuhan 430079, People’s Republic of China
7 Hunan University, Changsha 410082, People’s Republic of China
8 Jinan University, Jinan 250022, People’s Republic of China
9 Liaoning University, Shenyang 110036, People’s Republic of China
10 Nanjing Normal University, Nanjing 210097, People’s Republic of China
11 Nankai University, Tianjin 300071, People’s Republic of China
12 Peking University, Beijing 100871, People’s Republic of China
13 Shandong University, Jinan 250100, People’s Republic of China
14 Sichuan University, Chengdu 610064, People’s Republic of China
15 Tsinghua University, Beijing 100084, People’s Republic of China
16 University of Hawaii, Honolulu, HI 96822, USA
17 University of Science and Technology of China, Hefei 230026, People’s Republic of China
18 Wuhan University, Wuhan 430072, People’s Republic of China
19 Zhejiang University, Hangzhou 310028, People’s Republic of China
a Current address: Purdue University, West Lafayette, IN 47907, USA
b Current address: DESY, D-22607, Hamburg, Germany
c Current address: Laboratoire de l’Accélérateur Linéaire, Orsay, F-91898, France
d Current address: University of Michigan, Ann Arbor, MI 48109, USA
Abstract
Results are presented on radiative decays to
and based on a sample of 58M events taken with
the BES II detector. Partial wave analyses are carried out using
the relativistic covariant tensor amplitude method in the 1.0 to 2.3
GeV/ mass range. There are conspicuous peaks due
to the and two states in the 1.45 and 1.75
GeV/ mass regions. The first state has a mass of
MeV/, a width of
MeV/, and a branching fraction .
Spin 0 is strongly preferred over spin 2. The second state peaks
at MeV/ with a width of MeV/. If this is interpreted as coming from ,
the ratio of its branching fractions to and is
.
pacs:
12.39.Mk, 13.25.Gv, 14.40.Cs
I Introduction
QCD predicts the existence of glueballs, the bound states of gluons,
and the observation of glueballs would provide a direct test of
QCD. In the quenched approximation, lattice QCD calculations predict
the lightest glueball to be a with the mass being in the
region from 1.4 to 1.8 GeV/ QCDL . Although the
identification of a glueball is very complicated, there are several
glueball candidates, including the and . The
properties of the and are reviewed in detail
in the latest issue of the Particle Data Group (PDG) PDG .
radiative decays have been suggested as promising modes
for glueball searches. The process was
analyzed previously in the Mark III mark3 , DM2 dm2
and BES I bes1charge experiments, in which there was evidence for
and an additional . However, the high mass shoulder of the
, at about 1.45 GeV/, was unsettled. A revised
amplitude analysis of Mark III data assigned the shoulder to be a
scalar at 1.43 GeV/, and, in addition, found the peak at
1.7 GeV/ to be scalar rather than tensor dunwoodie . The
process was also studied by the
Crystal Ball cball and BES I experiments bes1 , but no
partial wave analysis has yet been performed on this channel. In this
paper, the results of partial wave analyses on
and are presented based
on a sample of 58M events collected by the upgraded Beijing
Spectrometer (BES II) located at the Beijing Electron Positron Collider
(BEPC).
II BES detector
BES II is a large solid-angle magnetic spectrometer that is described
in detail in Ref. detector . Charged particle momenta are
determined with a resolution of = 1.78 %
( in GeV/) in a 40-layer cylindrical main drift chamber
(MDC). Particle identification is accomplished by specific ionization
() measurements in the drift chamber and time-of-flight (TOF)
measurements in a barrel-like array of 48 scintillation counters. The
resolution is = 8.0 %; the TOF resolution is
ps for Bhabha events. Outside of the
time-of-flight counters is a 12-radiation-length barrel shower counter
(BSC) comprised of gas tubes operating in limited stream mode. The
BSC measures the energies of photons with a resolution of
21 % / ( in GeV). Outside the
solenoidal coil, which provides a 0.4 T magnetic field over the
tracking volume, is an iron flux return that is instrumented with
three double layers of counters that are used to identify muons.
In this analysis, a GEANT3 based Monte Carlo simulation program
(SIMBES) simbes with detailed consideration of detector
performance (such as dead electronic channels) is used. The
consistency between data and Monte Carlo has been checked in many high
purity physics channels, and the agreement is quite
reasonable simbes .
III Event selection
The first level of event selection of
requires two charged tracks with total charge zero. Each charged
track, reconstructed using MDC information, is required to be well
fitted to a three-dimensional helix, be in the polar angle region
, and have the point of closest approach of
the track to the beam axis be within 2 cm of the beam axis and within
20 cm from the center of the interaction region along the beam line.
More than one photon per event is allowed because of the possibility
of fake photons coming from the interactions of charged tracks with
the shower counter or from electronic noise in the shower counter. A
neutral cluster is considered to be a photon candidate when the energy
deposited in the BSC is greater than 50 MeV, the first hit is in the
beginning six radiation lengths, the angle between the nearest charged
track and the cluster is greater than 18∘, and the angle
between the cluster development direction in the BSC and the photon
emission direction is less than 30∘.
The total number of layers with hits associated with the two charged
particles in the muon counter is required to be less than four in
order to remove events. To remove the large
backgrounds from Bhabha events, we require that (i) the opening angle of
the two tracks satisfies and (ii) the
energy deposit by each track in the BSC satisfies
GeV. We require to remove
conversions that occur at low mass. In order to reduce
the background from final states with kaons and electrons, both tracks
are required to be identified as pions by TOF or when the
momenta are lower than 0.7 GeV/. In other cases, at least one
track is required to be identified as a pion by TOF.
Requirements on two variables, and , are
imposed THimel . The variable is
required to satisfy GeV. Here, and
are, respectively, the missing energy and momentum of
charged particles. The variable
is required
to be (GeV/)2, where is the angle
between the missing momentum and the photon direction. The cut
removes most background from events having multikaon or other neutral
particles, such as , events.
The cut on is used to reduce backgrounds with
s.
In order to reduce the dominant background, events with more
than one photon
satisfying GeV/ are
rejected. Here is the invariant mass of the
two isolated photons with the smallest angle between the plane
determined by these two photons and the direction of
in all possible photon combinations. is
calculated using and the angle between and
the direction. The advantage of this method is that it uses
the momenta of the charged tracks measured by the MDC, which has good
momentum resolution, and is independent of photon energy measurement.
Finally, the two charged tracks and photon in the event are
kinematically fitted using four energy and momentum conservation
constraints (4-C) under the hypothesis
to obtain better mass resolution and to suppress backgrounds further
by using the requirements and . If there is more
than one photon, the fit is repeated using all permutations and the
combination with the best fit to is retained.
For , the mesons in the event are
identified through the decay . The isolated
photon is required to have the energy deposited in the BSC greater
than 80 MeV and come from the interaction point. The number of
isolated photons is required to be greater than four and less than
seven. A 4-C kinematic fit to is performed, the
combination of five photons with the smallest is selected,
and a kinematic fit Chi-square is
required. For five photons, there are 15 combinations from which to
construct two s. To select s, we choose the combination
with the smallest , where and
require MeV/. To reduce
background with s, events with the invariant mass of a
and one photon in the mass interval
MeV/ are rejected.
To further suppress backgrounds with more than one neutral particle recoling
to the system, the recoiling mass squared of the
system is required to be less than 4.8 (GeV/)2.
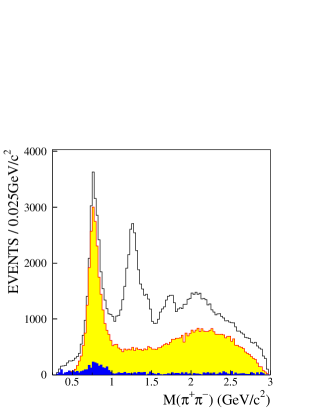
Fig. 1 shows the mass spectrum for the
selected events, together with the corresponding background
distributions and the Dalitz plot.
There is a strong peak mainly due to background from
. A strong signal, a shoulder on the
high mass side of the , an enhancement at 1.7 GeV/,
and a peak at 2.1 GeV/ are clearly visible.
The lightly shaded histogram in Fig. 1 corresponds to the
dominant background .
The data taken at the center of mass energy of 3.07 GeV, with a
luminosity of nb-1, are used to determine the continuum
background. The sum of continuum background and the other possible
backgrounds, such as
(), , , is estimated to be
3.8 % of the data in the whole mass range and is shown as the dark shaded
histogram in Fig. 1.
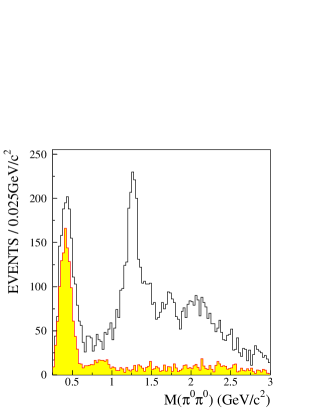
Fig. 2 shows the mass spectrum and the Dalitz plot.
The shaded histogram corresponds to the sum of estimated backgrounds
determined using PDG branching ratios PDG . The backgrounds
are mainly from (,
), , () and
(, ). The peak below 0.5 GeV/
is mainly from , ().
The continuum background is also studied using the data taken at the
center of mass energy of 3.07 GeV. No events survive selection
requirements. In general, the and
mass spectra exhibit similar structures above 1.0 GeV/.
Figure 1: Invariant mass spectrum of and the Dalitz
plot for , where the lightly and dark shaded
histograms in the upper panel correspond to
and other estimated backgrounds, respectively.
Figure 2: Invariant mass spectrum of and the Dalitz
plot for , where the shaded histogram
in the upper panel corresponds to the estimated backgrounds.
IV partial wave analysis
We have carried out partial wave analyses for the mass range from
1.0 to 2.3 GeV/ using relativistic covariant
tensor amplitudes constructed from Lorentz-invariant combinations of
the polarization and momentum 4-vectors of the initial and final state
particles, with helicity for initial states pwa .
Cross sections are summed over photon polarizations.
The relative magnitudes and phases of the
amplitudes are determined by a maximum likelihood fit.
For ,
the following channels are fitted to the data:
Constant width Breit-Wigner functions are used for each
resonance. The form is described as follows:
where is the square of invariant mass, and are
the mass and width of intermediate resonance , respectively.
The dominant background in comes from
.
From Mark III’s analysis on , described in
terms of the amplitudes representing the sequential two-body decay
process wmd-chen ,
the is dominant, but there are also contributions from
the excited states of .
A preliminary PWA on BESII also shows that
a complete description of the data requires not only the dominant
, but also the contributions from states ,
and , as well as state .
Using the branching fraction measurement of BES II 3pi ,
which agrees with the result from the BaBar Collaboration babar ,
and the generator based on the published results of Ref. wmd-chen ,
events are generated and
given the opposite log likelihood in the fit to cancel the background
events in the data.
The other background contributions are much smaller than
background in the 1.0 to 2.3 GeV/
mass range and not considered in the partial wave analysis.
Due to the limitation of the present statistics and the complexity of
the large background, it is difficult to cleanly distinguish
components in the high mass region. The main goal of this analysis
will be to understand the structures below 2.0 GeV/. We use the
four states , , , and ,
which are listed in PDG PDG in the fit with the masses and
widths fixed to those in the PDG, to describe the contribution of the
high mass states in the mass range below 2.0 GeV/.
For the states, relative phases between different helicity
amplitudes for a single resonance are theoretically expected to be
very small korner . Therefore, these relative phases are set to
zero in the final fit so as to constrain the intensities further.
After the mass and width optimization, the resulting fitted
intensities are illustrated in Figs. 3 and 4. Angular distributions
in the whole mass range are shown in Fig. 5. Here,
is the polar angle of the photon in the
rest frame, and is the polar angle of the pion in the
rest frame.
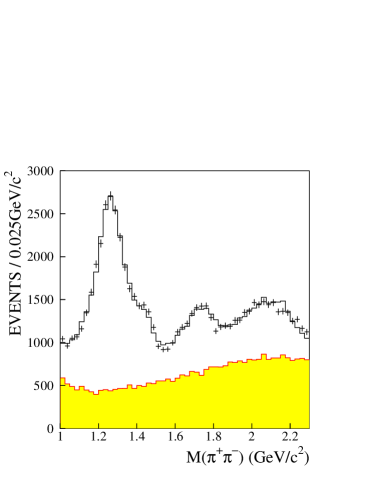
Figure 3: The invariant mass distribution from
.
The crosses are data, the full histogram shows
the maximum likelihood fit, and the shaded histogram
corresponds to the background.
Figure 4: The mass projections of the individual components for
. The crosses are data. The complete
and contributions are also shown, including all
interferences.
Figure 5: Projections in and
for the whole mass range. The crosses are data
( sample), and the histograms are the
fit results.
From Figs. 3 and 5, we see that the fit agrees well with data.
Fig. 4 shows the distributions of the individual components
and full and contributions including
interferences. A free fit to gives a fitted mass of MeV/ and a width of MeV/. The
fitted masses and widths of the and are
M MeV/, MeV/ and M
MeV/, MeV/,
respectively. The branching fractions of , , and
determined by the partial wave analysis fit are , , and
, respectively. For the , we
find the ratios of helicity amplitudes and with correlation factor , where ,
, correspond to the three independent production
amplitudes with helicity 0, 1 and 2. The errors here are
statistical errors. An alternative
fit is tried by replacing with a resonance. There
are three helicity amplitudes fitted for spin 2, while only one
amplitude for spin 0, which means the the number of degrees of freedom
is increased by 2 in the case. However, the log likelihood
is worse by 108. This indicates that with is
strongly favored. If the is removed from the fit, the log
likelihood is worse by 379, which corresponds to a signal significance
much larger than .
The partial wave analysis of is performed
independently. The components used are the same as those of
. Due to the limited statistics, we take
the partial wave analysis fit results of
as a cross-check of the ones obtained in the charged channel. The
background distribution is close to flat in the mass interval 1.0 - 2.3
GeV/, so we use multiplied by phase space to
approximately describe such a flat contribution, where the 2nd order
polynomial function is obtained by fitting the
mass phase space distribution of Monte
Carlo simulation.
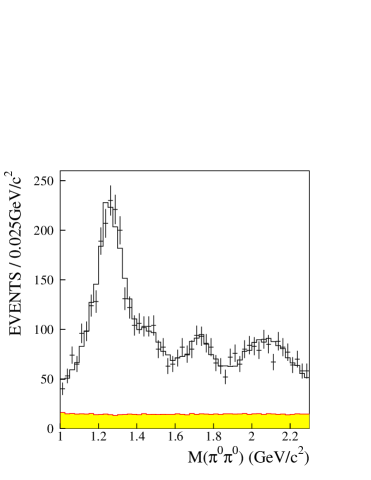
The fitted intensities as a function of mass are
illustrated in Fig. 6. A free fit to gives a fitted mass
of MeV/ and a width of
MeV/. The fitted masses and widths of the and
are M MeV/,
MeV/ and M
MeV/,
MeV/, respectively. The errors shown here are statistical.
Figure 6: The invariant mass distribution from
.
The crosses are data, the full histogram shows
the maximum likelihood fit, and the shaded histogram
corresponds to the background.
Besides the above global fit, a bin-by-bin fit is applied to
data using the method described in
Ref. gzj . A strong is observed, and the S-wave
mass distribution shows a large signal at 1.45
GeV/, a significant signal at 1.75 GeV/, and a peak
at 2.1 GeV/. In general, the bin-by-bin fit gives similar
features as those of the global fit, and the results of these two fits
are approximately consistent with each other.
V Systematic errors
The systematic errors for the partial wave analysis fit to
data are estimated by varying the masses
and widths of the , , and within the
fitted errors; varying the masses and widths of the ,
, , and within the PDG
errors PDG ; adding a small component ; varying the
background fraction within reasonable limit and replacing the
with the . They also include the uncertainties
in the number of events analyzed,
the efficiency of photon detection, the efficiency of MDC
tracking, and the kinematic fit.
Different generators, one is
based on the published results of Ref. wmd-chen and another is
from BESII preliminary PWA results which include a dominant
and its excited states ,
, and , are used for the estimation
of the background . The PWA results
with different backgrounds agree with each other within the error.
Their difference is taken as the systematic error too.
The systematic errors in this analysis do not include all model-dependent
effects, such as the difference of using simple Breit-Wigner
formalism and K-matrix formalism.
Table 3 shows the summary of the systematic errors for the
global fit.
For the , the total systematic errors are 0.10 and 0.19 for
and , respectively. The correlation factor between the and
systematic errors is 0.29 which is calculated with , where
i runs over all systematic errors.
Table 3 shows the mass, width, and branching fraction
measurements for , , and , where the
first error is statistical and the second is systematic, determined by
adding all sources in quadrature. In order to compare the branching
fractions of , , and in
and , we fix the mass and width
of each component in to those of the charged
channel and re-calculate the branching fractions and estimate the
systematic errors. The results are shown in Table 3. The
branching fractions determined from the two channels agree with each
other within errors after considering isospin corrections.
Table 1: Estimation of systematic errors for the
in the global fit. For the mass and
width, what shown are the absolute errors in MeV/. For
the branching fraction and the ratios of helicity
amplitudes, and , the listed are the relative errors.
is the correlation factor between and .
M (%) (%) (%)
M (%)
M (%)
M and of
1.4 0.2 2.0 0.26
0 0 2.3
0 0 0.1
M and of
1 0 0.1 0.1 2.2 0.26
10.1
0 1 1.9
M and of
0 0 0.1 0.5 0.6 0.26
0 1 2.6
8.9
M and of
0 1 1.4 2.9 0.5 0.26
1 7 4.2
3 15 6.9
M and of
1 3 1.0 1.6 1.2 0.27
6 2 3.0
5 10 5.8
M and of
1 2 1.2 1.2 0.4 0.26
3 0 3.2
1 3 3.3
M and of
0 1 0.1 0.4 0.7 0.26
1 2 0.4
0 0 0.7
add
2 5 0.2 6.9 34.6 0.35
3 7 18.6
3 10 2.9
MDC tracking and kinematic fit
4 4 3.5 6.2 12.8 0.38
14 18 31.0
8 1 13.4
background fraction
3 2 1.8 3.4 4.3 0.33
4 2 13.9
3 10 7.8
background with different generator
3 3 11.8 1.7 19.5 0.41
2 13 14.6
5 7 9.0
replace with
4 5 8.7 2.1 4.4 0.27
12 4 11.0
5 65 16.4
4.7
4.7
4.7
Detection efficiency
of photon
2.0
2.0
2.0
Total Systematic error
8 10 16.2 10.9 42.3 0.29
20 25 44.8
13 69 28.3
Table 2: Fit results for .
The first error is statistical, and the second is systematic.
Mass (MeV/)
(MeV/)
()
Table 3: The branching fraction measurements of
, where the masses and widths of the
resonances are fixed to the values determined from
. The first error is statistical, and
the second is systematic.
Mass (MeV/) (MeV/)
()
same as charged channel
same as charged channel
same as charged channel
VI discussion
The measured mass of the , MeV/,
is lower than the PDG value, and the branching fraction of
is a bit higher
than the PDG value PDG . A fit with the PDG mass and width is
visibly poorer, and the log likelihood is worse than the optimum fit
by 44. In this analysis, the S-wave contribution on the high mass
shoulder of the large peak is well separated, which may
explain this mass difference. The ratios of the helicity amplitudes
of the from the present analysis are and with correlation
and . The values of and are in
agreement with predictions korner ; krammer within the errors.
Comparing to the results determined by DM2 dm2 ,
Mark III mark3 , and Crystal Ball cball2 , there is a
difference in the value of y. The main reason for this difference may be
that we consider influences from other states in the 1.0 to 2.3
GeV/ mass range, while previous analyses by DM2 and
Mark III ignored these and only considered the
in the 1.15-1.4 GeV/ mass range.
The most remarkable feature of the above results is that three
states at the mass 1.45, 1.75, and 2.1
GeV/ are observed from the partial wave analysis. For the high
mass state at 2.1 GeV/, we use the , which is
listed in the PDG, to describe it. No further efforts are made on the
measurements of its resonant parameters due to the difficulties
described in Section IV.
The lower state peaks at a mass of
MeV/ with a width of MeV/, which
is consistent with the scalar glueball candidate, . Spin 0
is strongly preferred over spin 2. Therefore we interpret the small
but definite shoulder on the high mass side of the in the
mass distribution as originating from the
, which interferes with nearby resonances in the partial
wave analysis. However, due to the uncertainties of the mass and width
determinations and large interferences between the S-wave states, the
existence of the in cannot be
excluded by present data.
Strong production of the was observed in the partial wave
analysis of , with a mass of
MeV/, a width of
MeV/, and a branching fraction of of
gzj .
Interpreting the state in the mass region 1.75 GeV/
as coming from the and using the
branching fraction of determined from
after isospin correction and the branching
fraction of in Ref. gzj , we obtain the
ratio of to branching fractions for the as
The ratio is consistent with the PDG value ()
PDG within the errors. An alternative interpretation for this
state is the . Data on and show a definite peak in at 1790
MeV/ but no significant signal in phipp . If the
mass and width of the state are fixed to 1790 MeV/ and
270 MeV/ found in phipp , the log likelihood is worse by
47. This state may also be a superposition of and
.
Due to the uncertainty of the high mass region, we do an alternative fit
removing the and re-optimizing the masses and widths of
, , and for the
sample. The log likelihood is worse by
160. The fit gives a mass of MeV/ and
a width of MeV/. The measured masses and
widths of the and are M
MeV/, MeV/ and M
MeV/, MeV/, respectively. The branching fractions
of the , , and are , , and , respectively.
The light-meson spectroscopy of scalar states in the mass range 1-2
GeV/, which has long been a source of controversy, is still very
complicated. Overlapping states interfere with each other differently
in different production and decay channels. More experimental data are
needed to clarify the properties of these scalar states.
VII summary
In summary, the partial wave analyses of
and using 58M events of
BES II show strong production of and
evidence for two states in the 1.45 and 1.75 GeV/ mass
regions. For the , the branching ratio determined
by the partial wave analysis fit is
. The ratios of the helicity amplitudes
of the are determined to be and
with correlations and
.
The has a mass of MeV/, a width of MeV/, and
a branching fraction
.
The state in the 1.75 GeV/ mass region has a mass of
MeV/ and a width of MeV/.
If this state is interpreted as coming from ,
the ratio of the to branching fractions is
. This may help in understanding the
properties of and .
VIII Acknowledgments
The BES collaboration thanks the staff of BEPC and computing center
for their hard efforts. We wish to thank Prof. David Bugg for
contributions to the early stage of this analysis. This
work is supported in part by the National Natural Science Foundation
of China under contracts Nos. 10491300, 10225524, 10225525, 10425523,
the Chinese Academy of Sciences under contract No. KJ 95T-03, the 100
Talents Program of CAS under Contract Nos. U-11, U-24, U-25, and the
Knowledge Innovation Project of CAS under Contract Nos. KJCX2-SW-N10, U-602, U-34
(IHEP), the National Natural Science Foundation of China under
Contract No. 10225522 (Tsinghua University), and the Department of
Energy under Contract No.DE-FG02-04ER41291 (U Hawaii).
References
(1) G. Bali, K. Schilling, A. Hulsebos, A. Irving, C.
Michael, and P. Stephenson, Phys. Lett. B 309, 378 (1993);
C. Michael, Hadron Spectroscopy, AIP
Conf. Proc. No. 432 (AIP. Melville, NY, 1997), p. 657;
W. Lee, and D. Weingarten, hep-lat/9805029;
C. Morningstar, and M. Peardon, Phys. Rev. D 60, 034509
(1999).
(2) Particle Data Group, S. Eidelman ,
Phys. Lett. B 592, 1 (2004).
(3) R. M. Baltrusaitis , Phys. Rev. D 35, 2077 (1987).
(4) J. E. Augustin , Zeit. Phys. C 36, 369 (1987).
(5) J. Z. Bai , (BES Collaboration),
Phys. Rev. Lett. 76 3502 (1996).
(6) W. Dunwoodie, Hadron Spectroscopy, AIP
Conf. Proc. No. 432 (AIP. Melville, NY, 1997), p. 753.
(7) L. Köpke, N. Wermes, Phys. Rep. 174, 67 (1989).
(8) J. Z. Bai , (BES Collaboration),
Phys. Rev. Lett. 81, 1179 (1998).
(9) J. Z. Bai , (BES Collaboration),
Nucl. Phys. A 458, 627 (2001).
(10) M. Ablikim, , (BES Collaboration),
Nucl. Instru. Meth. A 552, 344 (2005).
(11) T. Himel , Phys. Lett. 45, 1146 (1980).
(12) B. S. Zou and D. V. Bugg, Eur. Phys. J. A 16, 537 (2003).
(13) L. P. Chen and W. Dunwoodie, SLAC-PUB-5674 (1991).
(14) J. Z. Bai , (BES Collaboration), Phys. Rev. D
70, 012005 (2004).
(15) B. Aubert , (BaBar Collaboration),
Phys. Rev. D 70 072004 (2004).
(16) J. G. Körner, J. H. Kühn, and H. Schneider, Phys.
Lett. B 120, 444 (1983).
(17) J. Z. Bai , (BES Collaboration), Phys. Rev. D 68, 052003 (2003).
(18) M. Krammer, Phys. Lett. B 74 361 (1978).
(19) C. Edwards , Phys. Rev. D 25, 3065 (1982).
(20) M. Ablikim, , (BES Collaboration), Phys. Lett.
B 607, 243 (2005).