First Measurements of the Exclusive Decays of the to B Meson Final States
and Improved Mass Measurement
O. Aquines
Z. Li
A. Lopez
H. Mendez
J. Ramirez
University of Puerto Rico, Mayaguez, Puerto Rico 00681
G. S. Huang
D. H. Miller
V. Pavlunin
B. Sanghi
I. P. J. Shipsey
B. Xin
Purdue University, West Lafayette, Indiana 47907
G. S. Adams
M. Anderson
J. P. Cummings
I. Danko
J. Napolitano
Rensselaer Polytechnic Institute, Troy, New York 12180
Q. He
J. Insler
H. Muramatsu
C. S. Park
E. H. Thorndike
University of Rochester, Rochester, New York 14627
T. E. Coan
Y. S. Gao
F. Liu
R. Stroynowski
Southern Methodist University, Dallas, Texas 75275
M. Artuso
S. Blusk
J. Butt
J. Li
N. Menaa
R. Mountain
S. Nisar
K. Randrianarivony
R. Redjimi
R. Sia
T. Skwarnicki
S. Stone
J. C. Wang
K. Zhang
Syracuse University, Syracuse, New York 13244
S. E. Csorna
Vanderbilt University, Nashville, Tennessee 37235
G. Bonvicini
D. Cinabro
M. Dubrovin
A. Lincoln
Wayne State University, Detroit, Michigan 48202
D. M. Asner
K. W. Edwards
Carleton University, Ottawa, Ontario, Canada K1S 5B6
R. A. Briere
I. Brock
Current address: Universität Bonn; Nussallee 12; D-53115 Bonn
J. Chen
T. Ferguson
G. Tatishvili
H. Vogel
M. E. Watkins
Carnegie Mellon University, Pittsburgh, Pennsylvania 15213
J. L. Rosner
Enrico Fermi Institute, University of
Chicago, Chicago, Illinois 60637
N. E. Adam
J. P. Alexander
K. Berkelman
D. G. Cassel
J. E. Duboscq
K. M. Ecklund
R. Ehrlich
L. Fields
R. S. Galik
L. Gibbons
R. Gray
S. W. Gray
D. L. Hartill
B. K. Heltsley
D. Hertz
C. D. Jones
J. Kandaswamy
D. L. Kreinick
V. E. Kuznetsov
H. Mahlke-Krüger
T. O. Meyer
P. U. E. Onyisi
J. R. Patterson
D. Peterson
E. A. Phillips
J. Pivarski
D. Riley
A. Ryd
A. J. Sadoff
H. Schwarthoff
X. Shi
S. Stroiney
W. M. Sun
T. Wilksen
M. Weinberger
Cornell University, Ithaca, New York 14853
S. B. Athar
P. Avery
L. Breva-Newell
R. Patel
V. Potlia
H. Stoeck
J. Yelton
University of Florida, Gainesville, Florida 32611
P. Rubin
George Mason University, Fairfax, Virginia 22030
C. Cawlfield
B. I. Eisenstein
I. Karliner
D. Kim
N. Lowrey
P. Naik
C. Sedlack
M. Selen
E. J. White
J. Wiss
University of Illinois, Urbana-Champaign, Illinois 61801
M. R. Shepherd
Indiana University, Bloomington, Indiana 47405
D. Besson
University of Kansas, Lawrence, Kansas 66045
T. K. Pedlar
Luther College, Decorah, Iowa 52101
D. Cronin-Hennessy
K. Y. Gao
D. T. Gong
J. Hietala
Y. Kubota
T. Klein
B. W. Lang
R. Poling
A. W. Scott
A. Smith
University of Minnesota, Minneapolis, Minnesota 55455
S. Dobbs
Z. Metreveli
K. K. Seth
A. Tomaradze
P. Zweber
Northwestern University, Evanston, Illinois 60208
J. Ernst
State University of New York at Albany, Albany, New York 12222
K. Arms
Ohio State University, Columbus, Ohio 43210
H. Severini
University of Oklahoma, Norman, Oklahoma 73019
S. A. Dytman
W. Love
S. Mehrabyan
V. Savinov
University of Pittsburgh, Pittsburgh, Pennsylvania 15260
(Mar. 17, 2006)
Abstract
Using 420 of data collected on the resonance
with the CLEO III detector, we
reconstruct mesons in 25 exclusive decay channels to
measure or set upper limits on the decay rate of into
B meson final states.
We measure the inclusive cross-section to
be nb
and make the first measurements of the production rates
of nb and
nb, respectively.
We set 90% confidence level limits of
nb,
nb and
nb.
We also extract the most precise value of the mass to date,
MeV/.
pacs:
13.25.Hw,13.66.Bc
††preprint: CLNS 06-1950CLEO 06-1
The resonance was discovered by the CLEO cleo_y5s and
CUSB cusb_y5s collaborations. Its production cross-section and mass were
measured to be about 0.35 nb and (10.8650.008) GeV/ cleo_y5s ,
respectively. Final states can be: , , ,
, , , ,
, and . Here,
= or , and the may be charged or neutral
(consistent with charge zero of the final state).
Throughout this article, we use to signify both and .
Including a symbol in parentheses indicates that it may or may not be present.
The cross-section in this region is well-described by the
Unitarized Quark Model (UQM) uqm , which
predicts that about 1/3 of the decay rate is
to and that dominates the inclusive rate.
A previous CLEO measurement using inclusive production
revealed that constitutes (16.02.65.8)%
of the total rate radia_5s . A second analysis victor_5s ,
which performed exclusive reconstruction of mesons found
nb
(about 1/3 of the total hadronic resonance cross-section).
The two results are consistent with each other and with predictions
of the UQM.
In this Letter, we measure the contributions of various
meson final states to the decay. These measurements may better
constrain coupled-channel models in the mass region as
well as near the lower resonances eichten .
We also exploit exclusively reconstructed mesons from this analysis
and the corresponding analysis victor_5s to extract
the most precise measurement of the mass to date.
CLEO III is a general purpose solenoidal detector
that includes a tracking system for measuring momenta and specific ionization ()
of charged particles, a Ring Imaging Cherenkov detector (RICH) to aid in particle
identification, a CsI calorimeter for detection of electromagnetic showers, and
a muon system for identifying muons cleo3 .
The analysis presented here uses 420 of data collected on the
resonance ( GeV) at the Cornell Electron Storage Ring.
Using techniques pioneered at the , we utilize two kinematic
variables: the energy difference and the
beam-constrained mass ,
where () is the energy (momentum) of the reconstructed
candidate and is the beam energy. Because of its low energy,
reconstruction of the photon in
is not essential; to maintain high efficiency,
we do not reconstruct the . (Charge conjugate final states are implied
throughout this Letter.)
To obtain a meson sample of high purity, events are required
to have at least five charged tracks and a ratio of the second to zeroth
Fox-Wolfram moment fox-wolfram , .
Candidate mesons are reconstructed in exclusive final states
containing either or mesons.
Charged particles are required to pass standard
selection criteria and are identified by using
their measured momenta in conjunction with , RICH, calorimeter
and muon system information. For particle types (
we define -like quantities for as the difference
in the measured and expected , normalized by the uncertainty,
i.e., ,
and for RICH as
(difference in negative log-likelihood
between hypotheses and ), respectively. We require
at least 3 detected Cherenkov photons from the RICH.
Pions are identified by requiring or .
For kaons, we define a combined quantity,
and
require . Electron candidates are formed from
particles that have a ratio of calorimeter energy () to measured
momentum () in the range . Muons are identified by
either having penetrated at
least 3 layers of iron absorber or by having deposited energy in the
calorimeter consistent with a minimum ionizing particle ( MeV).
Photons are formed from showers that have deposited at least 30 MeV of energy in
the calorimeter and are not associated with a charged track. Pairs of photons
that have an invariant mass within 2 standard deviations ( MeV/) of the
known mass () pdg are defined as candidates and
are kinematically constrained to give .
Candidate ’s are formed from or pairs.
For muon pairs, we require GeV/.
For combinations with GeV/,
bremsstrahlung photons are searched for among the showers with no
matching charged track and within a cone about each electron’s
initial direction. For each and candidate, we
perform a mass-constrained fit to the mass pdg and
make a loose requirement that the fit per degree of freedom is less than 100.
Candidate () [] mesons are formed from
() [] combinations that have
an invariant mass in the range from 620-920 (490-505)
[820-970] MeV/. () meson candidates are
reconstructed via their decays to (, and
) and are required to have an invariant
mass within 2 of their PDG pdg values.
To reduce combinatorial background in , we require MeV/.
Candidate () decays are formed from
and candidates that have a mass difference in the range
MeV/ ( MeV/).
Similarly, mesons are reconstructed in , and the mass
difference is required to be in the interval MeV/.
Candidate mesons are reconstructed in the 25 decay channels listed
in Table 1. For and b2dstrho ,
we take advantage of the helicity angle () hel_angle distribution in
these decays and require .
To improve the signal-to-background ratio, we also reject low momentum (backward-emitted)
’s from the decays by requiring .
Table 1 also shows the product branching fractions, ,
including the branching ratios of the daughter modes pdg , and the reconstruction
efficiencies, determined from Monte Carlo simulations pythia ; qq ; photos
of these decays followed by a geantgeant
based detector simulation.
We validate our simulation
and analysis procedure by measuring branching fractions for these decay modes
using data collected on the resonance. Good agreement
with the world averages are found for all modes.
Table 1: Modes used in exclusive meson reconstruction along with
their product branching fractions () pdg , reconstruction
efficiencies (),
and expected yields () in data assuming nb.
Mode
(%)
43.40.9
4.3
,
25.60.6
2.2
37.21.7
1.1
,
34.40.5
5.4
,
12.80.5
7.0
,
20.70.7
6.4
, ,
11.10.5
1.0
, ,
2.50.2
0.8
, ,
6.90.4
1.2
,
8.20.3
3.5
,
3.00.2
4.5
,
5.20.3
4.4
, ,
2.10.1
0.4
, ,
0.70.1
0.5
, ,
1.50.1
0.6
,
30.91.5
6.9
, ,
22.00.4
1.3
, ,
4.00.1
0.8
, ,
1.4
,,
7.30.5
0.5
,
6.60.4
3.9
, ,
4.30.2
0.6
, ,
1.30.1
0.7
, ,
2.70.2
0.8
,,
1.70.1
0.3
Total
60.4
We first determine the total meson yield by fitting the invariant mass
distribution formed from candidates in the , region of GeV/,
GeV. The relatively wide region is used to avoid biasing
the background shape.
The invariant mass distribution, shown in Fig. 1,
is fit to the sum of a second-order polynomial background and a Gaussian signal shape
whose width is
fixed to 12.3 MeV/, the expected average resolution of these candidates.
We find a yield of events; fitting to the and
distributions individually results in 11.23.5
and 42.38.4 events, respectively.
Using (see Table 1),
we measure a cross-section nb.
Figure 1:
The meson invariant mass distribution for all decay modes
listed in Table 1 in data.
The points are the data and the curve is the fit described in the text.
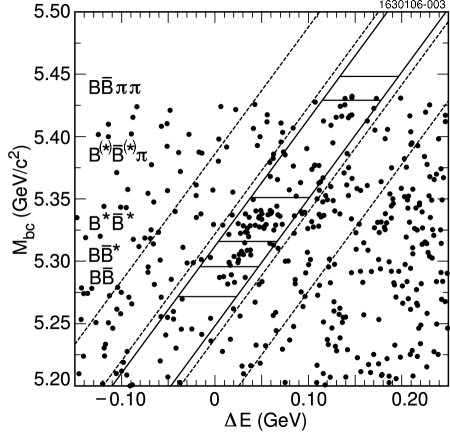
Figure 2 shows the reconstructed events in the
plane for data. Signal and sideband regions are defined
using MC simulations of these final states. To extract rates for ,
, and separately, we select events in a signal region defined by the
area between the diagonals GeV/ and GeV/.
This restricted signal
region has a total .
Lower and upper sidebands of the same width, also shown in
Fig. 2, are shifted to the left and right
of the signal region by 10 MeV, respectively.
Figure 2:
Scatter plots of vs. for all decay modes
listed in Table 1 in data. The diagonal lines show the expected signal
(solid) and 2 sideband (dashed) regions, as discussed in the text. The horizontal
lines show the regions for the various final states.
The , and final states are kinematically
well separated, but final states have a large degree of overlap,
and with the limited statistics cannot be distinguished. The
final states, because of the limited phase space,
peak at . If their rate is large enough, their
shape (in ) will be sufficient to distinguish them from the broad
tail of final states that extend into the region of .
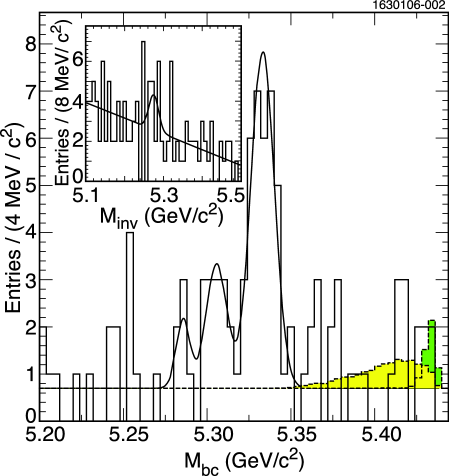
Events in the signal
region of Fig. 2 are projected onto the axis
(see Fig. 3) and fit to the sum of a flat background and
three Gaussian signals, one each for the peaks produced by
, and events.
The signal resolutions are set to 4.0, 6.2 and 7.0 MeV/,
respectively, as determined from MC simulation, and the background is
fixed to 0.7 events/4 MeV, as determined from the average of the
upper and lower sidebands. In the fit we use the precisely known
mass difference pdg and constrain its value
to 47.5 MeV/ mdif . The middle peak, which corresponds to
, is not constrained in the fit
and is found to be within 1 of the expected value.
Figure 3:
Distribution of for all reconstructed modes
listed in Table 1 for data.
The histogram displays the data, the curve shows the fit described in the text
and the flat line shows the background as determined from a fit to the sidebands
as discussed in the text.
Distributions for (lightly shaded) and (darker shading) obtained
from MC simulation of these final states are superimposed for illustrative purposes.
The inset shows the invariant mass of candidates in the region
with the fit superimposed.
The fitted yields are ,
and 31.46.1 events. Only the latter two are statistically significant
with significances, determined from the change in log-likelihood when
the contribution from each peak is removed, of 4.3 and 7.6, respectively.
For , we compute an upper limit of 7.5 events at 90% confidence level (CL).
A potential excess in is examined
by plotting the invariant mass of candidates in the region defined
by GeV/ and GeV, which should
exhibit a peak at (see inset in Fig. 3).
This region includes ()% of reconstructed events,
where the uncertainty reflects the maximum variation based on the
possible final states. That distribution is fit to the sum of a
Gaussian signal whose mean and r.m.s width are constrained to 5.279 GeV/
and 12.3 MeV/, respectively, and a linear background shape.
The yield of is not statistically significant, and we
compute an upper limit of 13.1 events at 90% CL.
For the final state, we select events in the region
GeV/ and GeV and find
three events consistent with . This additional requirement on and
has an efficiency of . While the combinatorial background is
small ( events), the cross-feed from into the signal
region is ()%. If we conservatively assume a yield equal to
its 90% upper limit value and that the 3 candidates are also
, we would expect 1.0 - 2.9 events to lie within the
mass region. Based on this range of expected background and
3 observed events, we take the most conservative upper limit
on , which corresponds to feldman events at 90% CL.
For illustration, we superimpose on Fig. 3, 6.7 (lightly
shaded, with a ratio of 1:1:1 ratio for ::) and
3 (darker shading) events.
Yields, efficiencies, cross-sections and relative production fractions are
summarized in Table 2. We also show the cross-sections as
determined from the and modes separately.
We find that is indeed dominant, comprising (% of the rate.
Several sources of systematic uncertainty on the cross-sections
measurements are considered.
Potential errors from the background normalization and shape are evaluated by
using different background parameterizations and varying the normalization within
its uncertainty. The corresponding uncertainties in the cross-sections vary from
3.1% for to 16.7% for . Uncertainties in the reconstruction
efficiencies include contributions from charged particle tracking and identification,
and reconstruction, and finite MC statistics. Averaged over all modes,
we find an uncertainty of 6.5%.
The analysis procedure was also checked by comparing -meson branching fractions
in our signal modes measured using data collected on the resonance with
PDG values pdg . We find a relative difference of ()%,
averaged over all modes, indicating that the efficiencies are well understood.
Errors due to the fixed signal shape parameters are determined
by varying them within their uncertainties and refitting (3%-4%). The occurrence
of multiple candidates in data (in a single event) are found to agree with simulation
to within 3%. Uncertainties on input branching fractions and measured
integrated luminosity contribute 3% and
2%, respectively. These systematic uncertainties are added in quadrature
and the resulting values are included in the cross-sections shown in
Table 2.
Table 2: Summary of yields, efficiencies, cross-sections and fractional contributions
of various subprocesses in decays.
Upper limits are set at the 90% CL.
Uncertainties are from statistical and systematic sources, respectively.
Yield
Efficiency
Cross-Section
(#Events)
(nb)
(%)
22
53.29.1
Modes
11.23.5
Modes
42.38.4
We proceed to use the distribution from this analysis in combination
with the one for in Ref. victor_5s to obtain an improved measurement
of the mass. Since those results
used exactly the same data set as in this analysis, the largest systematic error,
the beam energy calibration of () MeV victor_5s ,
cancels out in the (uncorrected) difference, .
The rightmost peak in Fig. 3 corresponds to ,
and its mean value is measured to be MeV/.
The peak value for from Ref. bs
is MeV, where we have added back the () MeV
beam energy correction to obtain an uncorrected value. The difference in
the peak values, , can be
translated into the mass difference,
after correcting for the -1.7 (-0.1) MeV/ bias
that is introduced due to our use of reconstructed instead of
mesons. We therefore find a mass
difference MeV/.
The 1.6 MeV/ error is statistical and the 0.2 MeV/ uncertainty is
from systematic errors in fitting our spectrum.
Combining this mass difference with MeV/ pdg , we
obtain an improved value for the mass, MeV/.
Using the well-measured mass from CDF of
MeV/ cdf_bs , we determine
the mass splitting MeV/.
This mass splitting measurement supersedes the previous CLEO result victor_5s of
MeV/ victor_5s and is significantly
more precise than an earlier indirect measurement of MeV/ cusb_bs .
It is also consistent with the corresponding splitting in the
system of (45.780.35) MeV/ pdg
as expected from heavy-quark symmetry bmass .
In summary, we have measured or set upper limits on the rates for the
various final states in decay. We find that predictions of the
UQM uqm are consistent with our findings that
is dominant, with a measured
value of of the total rate. The rate is measured to be
about 1/3 of the rate.
Upper limits on , and have also been presented. Lastly, we
utilized the peak positions for and victor_5s to
extract ,
which is the most precise value of the mass to date.
We gratefully acknowledge the effort of the CESR staff
in providing us with excellent luminosity and running conditions.
This work was supported by the A.P. Sloan Foundation,
the National Science Foundation, and the U.S. Department of Energy.
References
(1)
D. Besson et al. (CLEO Collaboration), Phys. Rev. Lett. 54, 381 (1985).
(2)
D. M. Lovelock et al. (CUSB Collaboration), Phys. Rev. Lett. 54, 377 (1985).
(3)
N. Trnqvist, Phys. Rev. Lett. 53, 878 (1984); S. Ono, N. Trnqvist, J. Lee-Franzini and A. Sanda, Phys. Rev. Lett. 55, 2938 (1985); S. Ono, A. Sanda and N. Trnqvist, Phys. Rev. D 34, 186 (1986).
(4)
M. Artuso et al. (CLEO Collaboration), Phys. Rev. Lett. 95, 261801 (2005) [hep-ex/0508047].
(5)
G. Bonvincini et al. (CLEO Collaboration), Phys. Rev. Lett. 96, 022002 (2006) [hep-ex/0510034].
(6)
E. Eichten et al., Phys. Rev. D 21, 203 (1980).
(7)
D. Peterson et al., Nucl. Instrum. Meth. A 478, 142 (2002);
M. Artuso et al., Nucl. Instrum. Meth. A 554, 147 (2005);
Y. Kubota et al., Nucl. Instrum. Meth. A 320, 66 (1992).
(8)
G. C. Fox and S. Wolfram, Phys. Rev. Lett 41, 1581 (1978).
(9)
S. Eidelman et al., Phys. Lett. B 592, 1 (2004) and 2005 partial update
for the 2006 edition available on the PDG WWW pages (http://pdg.lbl.gov/).
(10)
S. E. Csorna et al. (CLEO Collaboration), Phys. Rev. D 67, 112002 (2003).
(11)
For this decay, the helicity angle is the angle between the direction
in the rest frame and the direction in the rest frame.
(13)QQ - The CLEO Event Generator, http://www.lns.cornell.edu/public/CLEO/soft/QQ.
(14)
E. Barberio and Z. Was, Comput. Phys. Commun. 79, 291 (1994).
(15)
R. Brun et al., GEANT 3.21, CERN Program Library Long Writeup W5013 (unpublished), 1993.
(16)
The - mass difference is MeV/, to which a 1.7 MeV/
Lorentz boost correction was applied that reflects our use of the meson
momentum in computing rather than the momentum.
(17)
G. Feldman and R. Cousins, Phys. Rev. D 57, 3873 (1998).
(18)
This value is reduced by the beam energy correction of 4.6 MeV which was applied
in Ref. victor_5s .
(19)
D. Acosta et al. (CDF Collaboration), submitted to Phys. Rev. Lett. [hep-ex/0508022].
(20)
J. Lee-Franzini et al. (CUSB Collaboration), Phys. Rev. Lett 65, 2947 (1990).
(21)
W. Bardeen, E. Eichten and C. Hill, Phys. Rev. D 68, 054024 (2003), and
references therein.