Measurement of the Running of the Electromagnetic Coupling at
LEP
Salvatore Mele
INFN, Sezione di Napoli, I-80125,
Napoli, Italy
Salvatore.Mele@cern.ch
Abstract
The study of low-angle and large-angle Bhabha scattering at
LEP gives access to the running of the electromagnetic coupling. Two
recent measurements of the OPAL and L3 collaborations probe the
running of in the regions and
, respectively. The
strategies and the results of these studies are presented. A global
overview is given of the agreement of these and previous L3 findings
with the QED predictions.
To appear in the Proceedings of the
International Europhysics Conference on High Energy
Physics
July 21st - 27th 2005, Lisboa, Portugal
1 Introduction
A remarkable feature of quantum field theory is the dependence of
coupling constants on the energy scale of the processes in which their
corresponding interactions occur. In QED, large momentum-transfers
probe virtual-loop corrections to the photon propagator, as sketched
in Figure 1, inducing a dependence of the electromagnetic
coupling, , on the squared momentum transfer, . This
evolution, or running, of is parametrised
as [1]:
(1)
where is the fine-structure constant. This is measured with
high accuracy in solid-state processes and via the study of the
anomalous magnetic moment of the electron to be [2]. The contributions to
from lepton loops are precisely predicted, while
those from quark loops are difficult to calculate due to
non-perturbative QCD effects. They are estimated using
dispersion-integral techniques. At the scale of the Z-boson mass, a
recent calculation yields [3].
Figure 1: -channel Feynman diagrams contributing to Bhabha
scattering and the phenomenon of vacuum-polarisation. The
sum of all diagrams including zero, one, two or more
vacuum-polarisation insertions is denoted by the diagram to
the left with the double-wavy photon propagator, with an
electromagnetic coupling .
Bhabha scattering at colliders, , constitutes a unique window on the vacuum-polarisation
insertions of Figure 1. Its measurement gives access to the
running of in the space-like region, . The
four-momentum transfer in Bhabha scattering is measured with high
precision through its dependence on the squared centre-of-mass energy,
, and on the scattering angle, : . Low-angle, , and
large-angle, , Bhabha scattering
correspond to the low- and high- regimes, respectively.
A caveat is in order when discussing the extraction of
information on the running of from Bhabha scattering. The
cross section of this process can be written as:
(2)
Naively, one could imagine inserting the measured cross section in the
left-hand side of Equation 2, and incorporate the knowledge of
the -channel contributions, and ,
and of the radiative correction, , to extract a value for
. This argument is unfortunately flawed as the measurement
of the cross section requires knowledge of the integrated luminosity.
At LEP this is estimated by measuring events from low-angle Bhabha
scattering and assuming its cross section which, in turns, depends on
. Therefore, the only information which is experimentally
accessible concerns the evolution of over a
range. Two recent measurements of the running of are
discussed in the following, along with some previous measurements,
and, finally, a combined overview.
2 Previous measurements
The L3 collaboration first established the running of in the
range [4] by comparing event
counts from low-angle Bhabha scattering in different regions of its
luminosity monitor, with a result:
(3)
where the uncertainty combines statistical and systematic
uncertainties.
The running of in large-angle Bhabha scattering was first
investigated by the VENUS Collaboration at TRISTAN in the range
[5]. Later, the L3
Collaboration studied the same process at for
scattering angles , probing the range
[4], finding:
(4)
where the uncertainty comprises statistical and systematic sources.
3 Precision measurement at low
The OPAL collaboration recently performed a high-precision study of
the running of at low- [6] using data
collected with their luminometer. This consisted of tungsten absorber
and 32-pad silicon detectors, covering a polar angle
. The analysis relies on 10 million high-energy
back-to-back cluster pairs originating from low-angle Bhabha
scattering at , corresponding to a momentum
transfer . The spectrum of the events is
investigated to extract information on . Data are divided
in five bins and compared with the BHLUMI Monte
Carlo [7], as shown in Figure 2a. The ratio
between data and Monte Carlo counts for the hypothesis
is fitted with the function ,
where is the mean value of in the data sample and
the parameter is related to the running of as
(5)
Three hypotheses are considered and found to be completely excluded by
the data: ; a running of induced only by
electron virtual-loops; a running of induced only by lepton
virtual-loops. The QED hypothesis of a running with virtual loops of
both leptons and quarks fits the data best. The result of a fit for
, through Equation 5, yields:
(6)
in excellent agreement with the QED prediction of . The first uncertainty is statistical, the second systematic
–dominated by the simulation of the detector material and by the
reconstruction of the radial coordinate of the clusters– and the
third theoretical.
This measurement proves the running of at low- with a
significance of , and, for the first time, establishes the
hadronic contribution to the running with a significance of
as:
(7)
Figure 2: Experimental results proving the running of at
a) low and b) high . a) The ratio of event counts in
different radial regions of the OPAL luminometer, corresponding to
different values of , for data and a Monte Carlo simulation
with , from Reference [6]. The
data favour the QED prediction of and exclude
all other scenarios. Only statistical uncertainties are shown. b)
The ratio of centre-of-mass-averaged differential cross section of
for large-angle Bhabha scattering measured by L3 divided by the
theoretical predictions, from Reference [9]. The inner error
bars denote the statistical uncertainties, the outer the
combination of statistical and systematic uncertainties. The data
exclude the scenario .
4 First measurement at large
The L3 collaboration measured the differential cross section for
Bhabha scattering for scattering angles in the range
. About 40 000 events are selected as back-to-back
clusters in the high-resolution BGO electromagnetic calorimeter with
matched tracks, at , corresponding to . The 80 measured values of the
cross section, for each of ten angular ranges and eight centre-of-mass
energies, are compared with the predictions of the BHWIDE Monte
Carlo [8] to extract information on the running of
[9]. Figure 2b compares the data and the
predictions for the centre-of-mass-averaged cross sections. The
running of is parametrised as:
(8)
The hypothesis , corresponding to , is
completely excluded, whereas the data are in excellent agreement with
the running predicted in QED, corresponding to . A fit determines
(9)
where the first uncertainty is statistical and the second systematic,
dominated by theoretical uncertainties with some contribution from the
detector modelling.
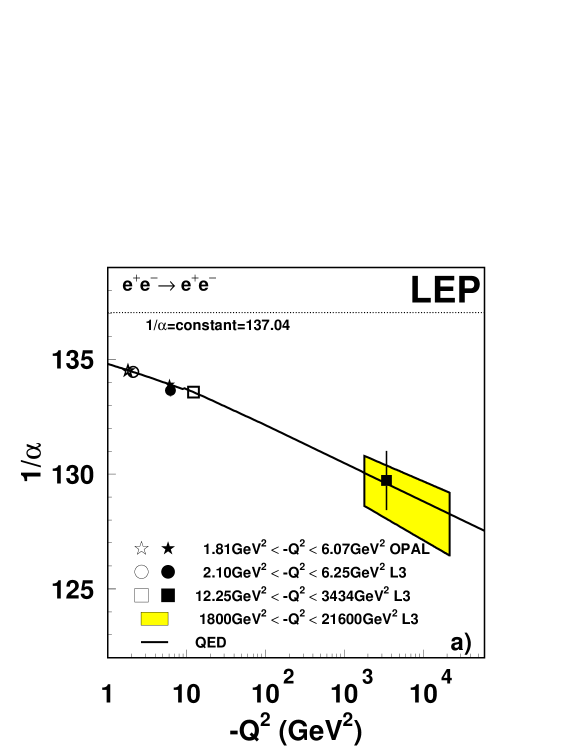
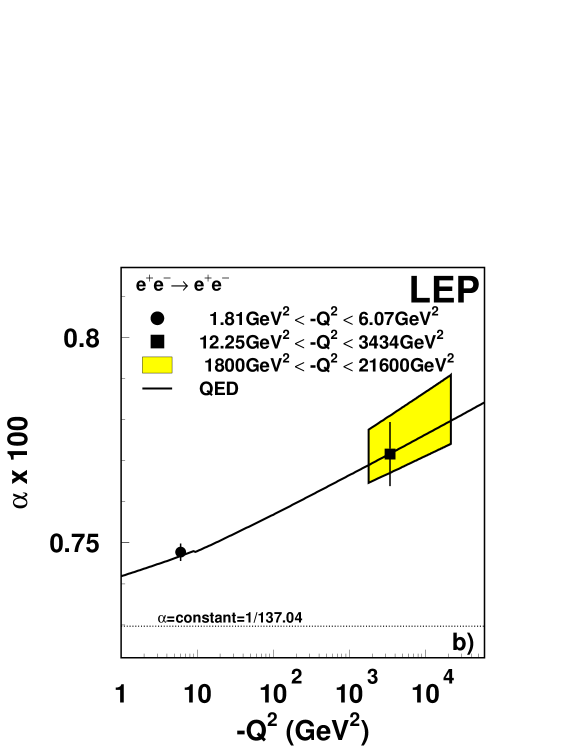
5 Two textbook plots?
Figures 3a and 3b summarise the LEP results on the
running of the electromagnetic coupling. In both figures, the L3
measurement at [9] is represented as a yellow band, obtained by
inserting the measured value of from Equation 9 into
Equation 8 and assuming the QED description of
of Reference [3].
Figure 3: Comparison of LEP results on the measurement of the
running of the electromagnetic coupling with QED predictions. The
treatment of data and the meaning of the symbols is discussed in
the last section of the text.
In Figure 3a, the OPAL measurement at
, Equation 6, and the L3
measurements at and
, Equations 3
and 4, respectively, are represented with a pair of
symbols each. The empty symbol represents the value of
fixed at the lower end of each range with
Equation 1 and the QED description of
of Reference [3]. The full symbol represents the
values of at the higher end of each range
extracted from these fixed values and the measurements in
Equations 6, 3 and 4.
Figure 3b goes one step further, anchoring the lower end of
each range by using the L3 measurement of at and assuming it also describes
the running of for lower values of . First, the L3
measurement at and the OPAL measurement at
are combined in a single measurement:
. The
value of is then fixed by using the measured
value of from Equation 9, the evolution expected from
Equation 8 and the QED description of
of Reference [3]. Finally, the value of
is extracted by using the fixed value of
, with an additional uncertainty which follows
from the 14% uncertainty on . A similar procedure is followed to
extract the value of from
Equation 4.
Both Figures present an excellent agreement with the QED predictions
of Reference [3], represented by the solid line:
two textbook plots!
References
[1] E.C.G. Stückelberg and A. Petermann,
Helv. Phys. Acta 26 (1953) 499;
M. Gell-Mann and F. Low,
Phys. Rev. 95 (1954) 1300;
N.N. Bogoliubov and D.V. Shirkov,
Dokl. AN SSSR 103 (1955) 203.