Review of Solar and Reactor Neutrinos
Abstract
Over the last several years, experiments have conclusively demonstrated that neutrinos are massive and that they mix. There is now direct evidence for s from the Sun transforming into other active flavors while en route to the Earth. The disappearance of reactor s, predicted under the assumption of neutrino oscillation, has also been observed. In this paper, recent results from solar and reactor neutrino experiments and their implications are reviewed. In addition, some of the future experimental endeavors in solar and reactor neutrinos are presented.
1 Introduction
From the 1960s to just a few years ago, solar neutrino experiments had been observing fewer neutrinos than what were predicted by detail models of the Sun[1, 2, 3, 4, 5, 6]. The radiochemical experiments, which used 37Cl[7] and 71Ga[8, 9, 10] as targets, were sensitive exclusively to . The real-time water Cherenkov detector Super-Kamiokande[11, 12, 13, 14] (and its predecessor Kamiokande[15]) observes solar neutrinos by -e elastic scattering, and has sensitivity to all active neutrino flavors. However, its sensitivity to and is only 1/6 of that for , and the flavor content of the observed solar neutrino events cannot be determined.
As these terrestrial detectors have different kinematic thresholds, they probed different parts of the solar neutrino energy spectrum. The measured solar neutrino flux exhibited an energy dependence. These observations of an energy dependent flux deficit can be explained only if the solar models are incomplete or neutrinos undergo flavor transformation while in transit to the Earth. Table 1 shows a comparison of the predicted and the observed solar neutrino fluxes for these experiments.
Since 2001, significant advances have been made in solar neutrino physics. The Sudbury Neutrino Observatory (SNO)[16, 17, 18, 19, 20, 21] has conclusively demonstrated that a significant fraction of s that are produced in the solar core transforms into other active flavors. One of the most favored explanation for this flavor transformation is matter-enhanced neutrino oscillation, or the Mikheyev-Smirnov-Wolfenstein (MSW) effect[25]. The KamLAND experiment[22, 23, 24] observes the disappearance of reactor s that is predicted from the neutrino mixing parameters derived from global MSW analyses of solar neutrino results. This provides very strong evidence that MSW oscillation is the underlying mechanism in solar neutrino flavor transformation. In this paper, these advances in solar and reactor neutrino experiments and their physical implications are discussed. A brief overview of the future program in solar neutrinos and reactor anti-neutrinos will also be presented.
| Experiment | Measured Rate/Flux | SSM Prediction (BP2001)[1] |
|---|---|---|
| Homestake[7] (37Cl) | 2.56 0.16 0.16 SNU | 7.6 SNU |
| SAGE[8] (71Ga) | 70.8 SNU | |
| Gallex[9] (71Ga) | 77.5 6.2 SNU | 128 SNU |
| GNO[10] (71Ga) | 62.9 2.5 SNU | |
| Kamiokande[15] () | 2.80 0.19 0.33 | 5.05 |
| Super-Kamiokande[12] () | 2.32 0.03 |
2 Solar Neutrino Flux Measurements at Super-Kamiokande
The Super-Kamiokande (SK) detector is a 50000-ton water Cherenkov detector located in the Kamioka mine, Gifu prefecture, Japan. During the first phase of the experiment SK-I (April 1996 to July 2001), approximately 11200 20-inch-diameter photomultiplier tubes (PMTs) were mounted on a cylindrical tank to detect Cherenkov light from neutrino interactions in the inner detector. Since December 2002, the experiment has been operating in its second phase (SK-II) with approximately 5200 PMTs in its inner detector. An additional 1885 8-inch-diameter PMTs are used as a cosmic veto.
2.1 Super-Kamiokande-I
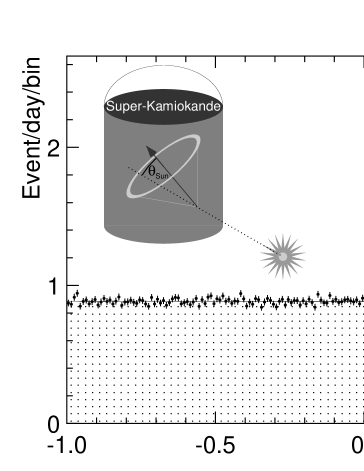
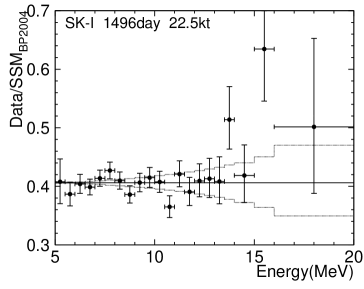
In SK-I and SK-II, neutrinos from the Sun are detected through the elastic scattering process . Because of the strong directionality in this process, the reconstructed direction of the scattered electron is strongly correlated to the direction of the incident neutrinos. The sharp elastic scattering peak in the angular distribution for events with a total electron energy of 520 MeV in the SK-I data set is shown in Figure 1. This data set spans 1496 days (May 31, 1996 to July 15, 2001), and the solar neutrino flux is extracted by statistically separating the solar neutrino signal and the backgrounds using this angular distribution. At the analysis threshold of =5 MeV, the primary signal is s from 8B decays in the solar interior. The extracted solar 8B neutrino flux in this SK-I data set () is[26] (in units of ):
When comparing this measured flux to the BP2001[1] and BP2004[2] model predictions:
where the model uncertainties (20%) have not been included in the systematic uncertainties above.
2.2 Super-Kamiokande-II
With only about half of the photocathode coverage as SK-I, significant improvements have been made to the trigger system in the SK-II detector in order to maintain high trigger efficiency for solar neutrino events. The improved trigger system can trigger with 100% efficiency at 6.5 MeV. Results from a 622-day SK-II data set have recently been released. The solar angular distribution plot is shown in Figure 2. For the first 159 days (Dec. 24, 2002 to July 15, 2003) of these data, the energy threshold for the analysis was set at 8 MeV, and it was lowered to 7 MeV for the remaining 463 days (Jul. 15, 2003 to Mar. 19, 2005). The extracted solar 8B neutrino flux in this 622-day SK-II data set () is (in units of ):
which is consistent with the SK-I results.

3 Sudbury Neutrino Observatory
The Sudbury Neutrino Observatory (SNO) detector is a 1000-tonne heavy water (D2O) Cherenkov detector located near Sudbury, Ontario, Canada. Approximately 9500 8-inch-diameter PMTs are mounted on a spherical geodesic structure to detect Cherenkov light resulting from neutrino interactions. It can make simultaneous measurements of the flux from 8B decay in the Sun and the flux of all active neutrino flavors[27] through the following reactions:
The charged-current (CC) reaction on the deuteron is sensitive exclusively to , and the neutral-current (NC) reaction has equal sensitivity to all active neutrino flavors (, ). Similar to the Super-Kamiokande experiment, elastic scattering (ES) on electron is also sensitive to all active flavors, but with reduced sensitivity to and . If the measured total flux (through the NC channel) is greater than the measured flux (through the CC channel), it would conclusively demonstrate that solar s have undergone flavor transformation since their production in the solar core. Alternatively, this flavor transformation can be demonstrated by comparing the flux deduced from the ES channel to the flux.
3.1 Pure D2O phase
The first phase of the SNO experiment (SNO-I) used a pure D2O target. The free neutron from the NC interaction is thermalized, and in 30% of the time, a 6.25-MeV ray is emitted following the neutron capture by deuteron. In 2001, the SNO collaboration published a measurement of the flux, based on a 241-day data set taken from Nov. 2, 1999 to Jan 15, 2001. At an electron kinetic energy threshold of 6.75 MeV[17], the measured and fluxes through the CC and ES channels are (in units of ):
The measured agrees with that from the SK-I detector . But a comparison of to , after adjusting for the difference in the energy response of the two detectors, yields (in units of )
which is 3.3 away from 0. This measurement not only confirmed previous observations of the solar neutrino deficit from different experiments, it also provided the first indirect evidence, when combined with the SK-I results, that neutrino flavor transformation might be the solution to this long-standing deficit.
In 2002, the SNO collaboration reported a measurement of the total active neutrino flux through the NC channel[18]. This measurement used a threshold of 5 MeV and was based the 306-day data set (Nov. 2, 1999 to May 28, 2001). Under the assumption of an undistorted 8B spectrum, the non- component () of the total active neutrino flux is (in units of )
which is 5.3 away from 0. This result was the first direct evidence that demonstrated neutrino flavor transformation. The measured total active neutrino flux confirmed the solar model predictions and provided the definitive solution to the solar neutrino deficit problem.
3.2 Salt Phase
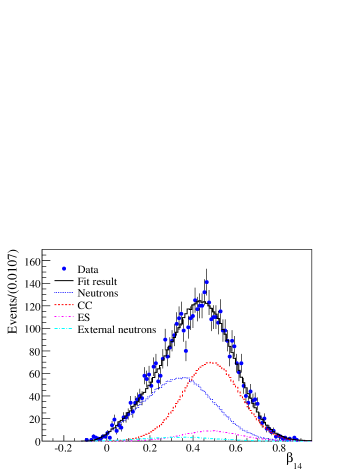
In phase two of the SNO experiment (SNO-II), 2 tonnes of NaCl were added to the D2O target in order to enhance the detection efficiency of the NC channel. The free neutron from the NC channel was thermalized in the D2O and subsequently captured by a 35Cl nucleus, which resulted in the emission of a -ray cascade with a total energy of 8.6 MeV. The neutron capture efficiency increased three folds from SNO-I. The CC signal involved a single electron and multiple s were emitted in the NC channel. This difference in the number of particles in the final state resulted in a difference in the isotropy of the Cherenkov light distribution. The CC and the NC signals could be statistically separated by this isotropy difference. This separation for events with 5.5 MeV is shown in Fig. 3 for the 391-day data set (taken from Jul. 26, 2001 to Aug. 28, 2003). This use of light isotropy also removed the need to constrain the 8B energy spectrum, which can be distorted if the neutrino flavor transformation process is energy dependent, as in SNO-I. The measured energy-unconstrained and fluxes through the different channels are[20, 21] (in units of ):
The ratio of the flux and the total active neutrino flux is of physical significance (which will be discussed later), and is
4 Search for MSW Signatures in Solar Neutrinos
Recent results from SNO and Super-Kamiokande have conclusively demonstrated that neutrino flavor transformation is the solution to the solar neutrino deficit. The most favored mechanism for this transformation is the Mikheyev-Smirnov-Wolfenstein (MSW) matter-enhanced neutrino oscillation[25]. MSW oscillation can be a resonant effect as opposed to vacuum oscillation, which is simply the projection of the time evolution of eigenstates in free space. A resonant conversion of to other active flavors is possible in MSW oscillation if the ambient matter density matches the resonant density. Two distinct signatures of the MSW effect are distortion of the neutrino energy spectrum and a day-night asymmetry in the measured neutrino flux. The former signature arises from the energy dependence in neutrino oscillation. When the Sun is below a detector’s horizon, some of the oscillated solar neutrinos may revert back to while traversing the Earth’s interior. This re-generation effect would give an asymmetry in the measured fluxes during the day and the night.
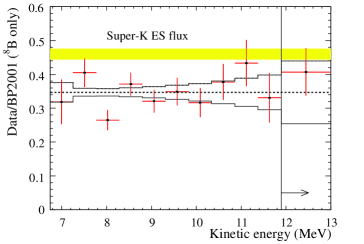
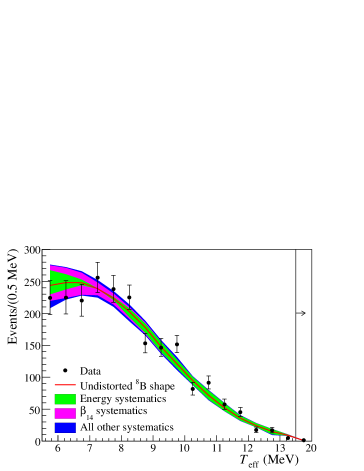
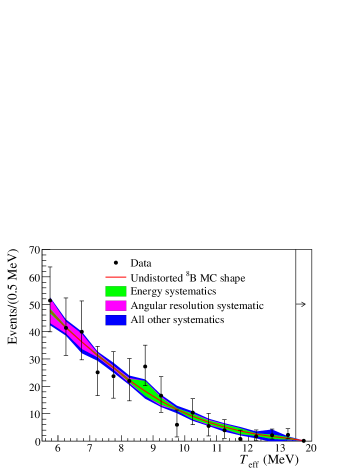
Both SNO and Super-Kamiokande have done extensive searches for these two signatures in their data. Figure 4 shows the measured electron spectra from SK-I and SK-II, whereas Fig. 5 shows the measured spectra from SNO-I and SNO-II. No statistically significant distortion is seen from either experiment.

The Super-Kamiokande experiment defines the day-night asymmetry ratio as[14]
where is the measured neutrino flux when the Sun is above the horizon, and is the corresponding flux when the Sun is below the horizon. The measured day-night asymmetries of the solar neutrino flux by SK-I and SK-II are:
It should be noted that the flux measured by Super-Kamiokande is a mixture of all three active neutrino flavors.
The SNO experiment has also measured the day-night asymmetry of the measured neutrino flux[19, 21]. It should be noted that the SNO and the Super-Kamiokande asymmetry ratios are defined differently, such that . Because SNO can measure the flux and the total active neutrino flux separately through the CC and the NC channels, it can determine the day-night asymmetry for these fluxes separately. In addition, the asymmetry ratio can be determined with the day-night asymmetry in the NC channel constrained to 0. With the 8B shape and constraints, the measured day-night asymmetry in the flux in SNO-I and SNO-II are
Because of the presence of and in the Super-Kamiokande measured flux, its day-night asymmetry is diluted by a factor of 1.55[21]. Assuming an energy-independent conversion mechanism and only active neutrinos, the SK-I result scales to a flux asymmetry . Combining the SNO-I and SNO-II values for with the equivalent SK-I value () gives . No statistically significant day-night asymmetry has been observed.
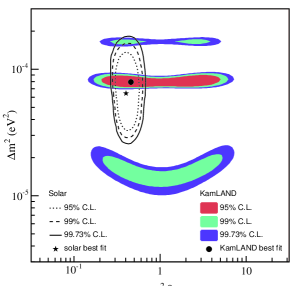
5 MSW Interpretation of Solar Neutrino Data
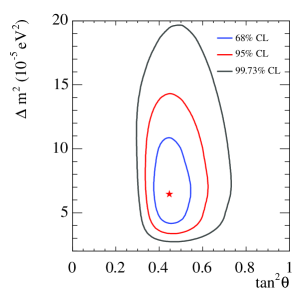
Although no direct evidence for the MSW effect has been observed, the null hypothesis that no MSW oscillation in the solar neutrino results is rejected at 5.6[28]. There are two parameters in a two-flavor, active neutrino oscillation model: , which is the difference of between the square of the eigenvalue of two neutrino mass states; and , which quantifies the mixing strength between the flavor and the mass eigenstates. Each pair of these parameters affects the total solar neutrino spectrum differently, which can give rise to the energy dependence in the ratio between the observed and the predicted neutrino fluxes in different detectors. Using the measured rates in the radiochemical (37Cl and 71Ga) experiments, the solar zenith angle distribution from the Super-Kamiokande experiment, and the day and night energy spectra from the SNO experiment, a global statistical analysis can then be performed to determine the (, ) pair that best describes the data[29]. The best-fit parameters[21] are found in the so-called “Large Mixing Angle” (LMA) region:
There are two implications to these results. First, maximal mixing (i.e. ) is ruled out at very high significance. This is in contrary to the atmospheric neutrino sector, where maximal mixing is the preferred scenario. Second, because the “dark-side” () is also ruled out, a mass hierarchy of is implied.
6 KamLAND
Previous reactor oscillation experiments, with reactor-detector distances (“baselines”) ranging from 10 m to 1 km, did not observe any disappearance[30]. If CPT is conserved and matter-enhanced neutrino oscillation is the underlying mechanism for the observed flavor transformation in solar neutrinos, one would expect a significant fraction of the reactor s oscillating (primarily through vacuum oscillation) into another flavor at a baseline of 100 to 200 km. The Kamioka Liquid scintillator Anti-Neutrino Detector (KamLAND) experiment[22] has a unique geographic advantage over other previous reactor experiments; it is surrounded by 53 Japanese power reactors with an average baseline of 180 km.
KamLAND is a 1000-tonne liquid scintillator detector located in the Kamioka mine in Japan. Its scintillator is a mixture of dodecane (80%), pseudocumene (1,2,4-Trimethylbenzene, 20%), and 1.52 g/liter of PPO (2,5-Diphenyloxazole). An array of 1325 17-inch-diameter PMTs and 554 20-inch-diameter PMTs are mounted inside the spherical containment vessel. Outside this vessel, an additional 225 20-inch-diameter PMTs act as a cosmic-ray veto counter.
KamLAND detects s by the inverse decay process , which has a 1.8 MeV kinematic threshold. The prompt signal in the scintillator, which includes the positron kinetic energy and the annihilation energy, is related to the incident energy and the average neutron recoil energy by MeV. The final state neutron is thermalized and captured by a proton with a mean lifetime of 200s. The prompt signal and the 2.2-MeV emitted in the delayed neutron capture process form a coincident signature for the signal.
| First result[23] | Second result[24] | |
| Data Sets | ||
| Data span | Mar. 4, 2002 to Oct. 6, 2002 | Mar. 9, 2002 to Jan. 11, 2004 |
| Live days | 145.1 live days | 515.1 live days |
| Exposure | 162 ton-year | 766.3 ton-year |
| Results | ||
| Expected signal | 86.8 5.6 counts | 365.2 23.7 counts |
| Background | 1 1 count | 17.8 7.3 counts |
| Observed signal | 54 counts | 258 counts |
| Systematic uncertainties | 6.4% | 6.5% |
| disappearance C.L. | 99.95% | 99.998% |
Table 2 summarizes the two KamLAND reactor rate measurements[23, 24] to-date. The exposure of the two measurements are 162 ton-years and 766 ton-years respectively. The null hypothesis that the observed rates are statistical downward fluctuations is rejected at 99.95% and 99.998% confidence levels in the two measurements. KamLAND is the first experiment that observes reactor disappearance.
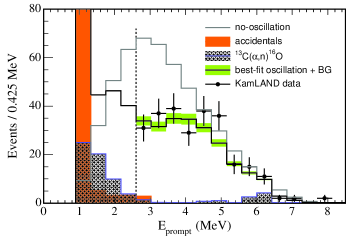
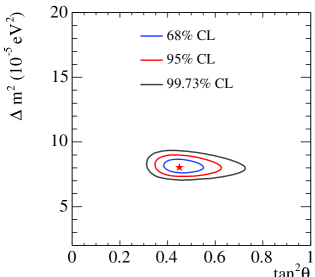
If vacuum oscillation is responsible for the disappearance of reactor s in KamLAND, then one might expect a distortion of the spectrum. The measured spectrum is shown in Fig. 7. A fit of the observed spectrum to a simple re-scaled, undistorted energy spectrum is excluded at 99.6%. Also shown in the figure is the best-fit spectrum under the assumption of neutrino oscillation. The allowed oscillation parameter space is shown in Fig. 8, and the best-fit parameters of this KamLAND-only analysis are[24]
Assuming CPT invariance, a global neutrino oscillation analysis can be performed on the solar neutrino results and the KamLAND results. The allowed parameter space is shown in Fig. 9. The best-fit parameters in this global analysis are[21]
One immediately notices the complementarity of reactor anti-neutrino and solar neutrino experiments. The former restricts , whereas the latter restricts in an orthogonal manner.
7 Future Experimental Solar Neutrino Program
In the next several years, both running solar neutrino experiments SNO and Super-Kamkiokande have an ambitious physics program.
The three-flavor mixing matrix element can be written[31] as , which approximately equals for two-flavor solar neutrino oscillation when is small and when from the solar neutrino sector is much less than that from the atmospheric neutrino sector. For oscillation parameters in the LMA region, the MSW effect can result in 8B neutrinos emerging from the Sun essentially as a pure state. The SNO ratio, a direct measure of survival probability, is also a direct measure of (). Therefore, one of the primary goals of the SNO experimental program is to make a precision measurement of this fundamental parameter by improving on the CC and NC measurements.
The SNO experiment has entered the third phase (SNO-III) of its physics program. Thirty six strings of 3He and 4 strings of 4He proportional counters have been deployed on a 1-m square grid in the D2O volume. In SNO-I and SNO-II, the extracted CC and NC fluxes are strongly anti-correlated (the correlation coefficient is -0.53 in SNO-II). This anticorrelation is a significant fraction of the total flux uncertainties. By introduction this array of 3He proportional counters, NC neutrons are detected by ; whereas the Cherenkov light from the CC electrons are recorded by the PMT array. This physical separation, as opposed to a statistical separation of the CC and NC signals in SNO-I and SNO-II, will allow a significant improvement in the precision of the CC and the NC fluxes. Table 3 summarizes the uncertainties in the CC and NC flux measurements in SNO-I and SNO-II, and the projected uncertainties for the corresponding measurements in SNO-III.
Because the 3He proportional counter array “removes” Cherenkov light signals from NC interactions, it allows for a search of CC electron spectral distortion at an analysis threshold of 4 to 4.5 MeV. The distortion effects are enhanced at this threshold when compared to those analyses at higher thresholds in SNO-I and SNO-II.
| SNO-I | SNO-II | SNO-III | ||||
|---|---|---|---|---|---|---|
| Systematic | 5.3 | 9.0 | 4.9 | 7.3 | 3.3 | 5.2 |
| Statistical | 3.4 | 8.6 | 3.7 | 4.2 | 2.2 | 3.8 |
| Total | 6.3 | 12.4 | 6.1 | 8.4 | 4.0 | 6.4 |
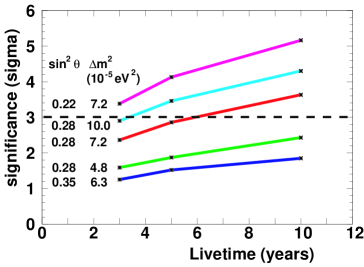
The Super-Kamiokande is scheduled for a detector upgrade from October 2005 to March 2006. After this upgrade, the detector will return to the same photocathode coverage in SK-I. The primary physics goal of the SK-III solar neutrino program is to search for direct evidence of the MSW effect. With the improvements made to the trigger system in SK-II and the anticipated increase in photocathode coverage, the SK-III detector will be able to push the analysis threshold down to 4 MeV.
Figure 10 shows the projected SK-III sensitivity to observing spectral distortion in its solar neutrino signal. In this figure, the sensitivities of several combinations of (, ) in the LMA region allowed by solar neutrino measurements (c.f. Fig. 6) are shown. It is possible to discover MSW-induced spectral distortion at after several years of counting.
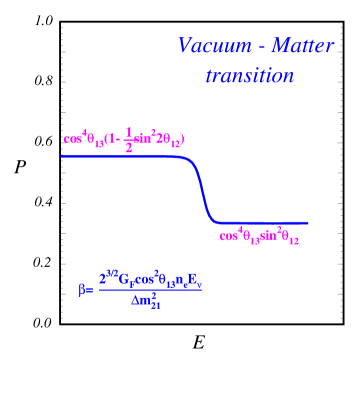
Future solar neutrino experiments focus on detecting the low energy neutrinos ( MeV), 7Be neutrinos ( MeV, BR=90%), neutrinos ( MeV), or neutrinos from the CNO cycle. These experiments are subdivided into two broad classes: -only detection mechanism through charged-current interaction with the target nucleus; and elastic scattering which measures an admixture of , and . The neutrino experiments seek to make high precision measurement of the neutrino flux and to constrain the flux of sterile neutrinos. The 7Be and the neutrino experiments seek to map out the survival probability in the vacuum-matter transition region. Figure 11 shows this transition region[32]. Although certain non-standard interaction (NSI) models[33] can match the survival probability in the and the 8B energy regimes, they differ substantially from the MSW prediction in the 7Be and energy regimes ( MeV).
Table 4 is a tabulation of future solar neutrino experiments (adopted from Nakahata[34]). Most of these experiments are in proposal stage; but two liquid scintillator experiments, Borexino and KamLAND, will come online for 7Be solar neutrino measurements in the next year. The construction of Borexino is complete, and it is waiting for authorization to fill the detector with liquid scintillator. The purification system of the KamLAND experiment is being upgraded in order to achieve an ultra-pure liquid scintillator for the 7Be neutrino measurement.
For other future solar experiments, a summary of their current status can be found in the supplemental slides of this conference talk[35].
| Experiment | source | Reaction | Detector |
| Charged-Current Detectors | |||
| LENS | 15 tons of In in 200-ton liquid scintillator | ||
| Lithium | , CNO | Radiochemical, 10 ton lithium | |
| MOON | 3.3 ton 100Mo foil + plastic scintillator | ||
| Elastic Scattering Detectors | |||
| Borexino∗ | 7Be | 100 ton liquid scintillator | |
| CLEAN | , 7Be | 10 ton liquid Ne | |
| HERON | , 7Be | 10 ton liquid He | |
| KamLAND∗ | 7Be | 1000 ton liquid scintillator | |
| SNO+ | , CNO | 1000 ton liquid scintillator | |
| TPC-type | , 7Be | Tracking electron in gas target | |
| XMASS | , 7Be | 10 ton liquid Xe | |
8 Future Experimental Reactor Anti-neutrino Program
The future reactor anti-neutrino program is focused on determining the neutrino mixing angle . This is the only unknown angle in the neutrino mixing matrix, and its current upper limit is (90% C.L.)[36].
Although there are ongoing efforts in developing accelerator-based measurements by searching for appearance, such long baseline measurements can be affected by matter effects. The determination of in these appearance experiments is complicated by the degeneracy of mixing parameters (e.g. ). A reactor-based measurement can complement accelerator-based experiments by removing these intrinsic ambiguities. In a reactor-based measurement, one searches for flux suppression and spectral distortion of the prompt positron signal at different baselines.
The general configuration of such a reactor-based experiment consists of at least two or more detectors: one is placed at a distance of 0.5 km, and the other at 1-2 km. The near detector is used to normalize the reactor flux, while the far detector is used to search for rate suppression and spectral distortion. The baseline of the far detector, 2 km, is the distance where the survival probability reaches its first minimum. In order to shield the detectors from muon spallation backgrounds, these detectors require overhead shielding. For these experiments, a 1% error budget is required in order to reach a sensitivity of .
In addition to measurements, these experiments can also make contributions in measuring the Weinberg angle (at 0), and in investigating the nature of neutrino neutral-current weak coupling. The precision in can also be improved by a reactor anti-neutrino experiment with a baseline of 50 to 70 km[37].
Table 5 is a tabulation of the proposed reactor experiments[38]. More details on the status of these experiments can be found in the supplemental slides of this talk[35].
| Baseline | Overburden | Detector size | ||||||
| Experiment | Location | (km) | (m.w.e.) | (tons) | sensitivity | |||
| Near | Far | Near | Far | Near | Far | (90% C.L.) | ||
| Angra dos Reis | Brazil | 0.3 | 1.5 | 200 | 1700 | 50 | 500 | 0.01 |
| Braidwood | USA | 0.27 | 1.51 | 450 | 450 | 652 | 652 | 0.01 |
| Double Chooz | France | 0.2 | 1.05 | 50 | 300 | 10 | 10 | 0.03 |
| Daya Bay | China | 0.3 | 1.8-2.2 | 300 | 1100 | 50 | 100 | 0.01 |
| Diablo Canyon | USA | 0.4 | 1.7 | 150 | 750 | 50 | 100 | 0.01 |
| KASKA | Japan | 0.4 | 1.8 | 100 | 500 | 8 | 8 | 0.02 |
| Kr2Det | Russia | 0.1 | 1.0 | 600 | 600 | 50 | 50 | 0.03 |
9 Conclusions
After nearly four decades, the solar neutrino deficit problem is finally resolved. There are now strong evidences for neutrino oscillation from solar neutrino and reactor anti-neutrino experiments. SNO, Super-Kamiokande and KamLAND will improve the precision of the neutrino oscillation parameters. Future solar neutrino experiments will provide high precision tests of the solar model calculations, and will probe the energy dependence of neutrino oscillation. Future reactor anti-neutrino experiments will attempt to measure the unknown mixing angle . Once the magnitude of this angle is known, a new arena of CP studies may be opened up in the neutrino sector in the future.
Acknowledgments
The author thanks the conference organizers for the invitation to speak; and E. Blucher, M. Chen, P. Decowski, H. Ejiri, R. Hazama, K. Ishii, R. Lanou, T. Lasserre, K.-B. Luk, D. McKinsey, M. Nakahata, R. Raghavan, F. Suekane, R. Svoboda, and Y. Takeuchi for providing much of the background information in this talk and proceedings.
References
- [1] J. N. Bahcall, M. Pinsonneault, S. Basu, Astrophys. J. 555, 999 (2001).
- [2] J. N. Bahcall and M. H. Pinsonneault, Phys. Rev. Lett. 92, 121301 (2004).
- [3] J. N. Bahcall, A. M. Serenelli, and S. Basu, astro-ph/0412440.
- [4] A. S. Brun, S. Turck-Chièze, and J. P. Zahn, Astrophys. J. 525, 1032 (1999)
- [5] S. Turck-Chièze et al., Ap. J. Lett. 555 (2001).
- [6] S. Turck-Chièze et al., Phys. Rev. Lett. 93, 221102 (2004).
- [7] B. T. Cleveland et al. [Homestake Collaboration], Astrophys. J. 496, 505 (1998).
- [8] J. N. Abdurashitov et al. [SAGE Collaboration], J. Exp. Theor. Phys. 95, 181 (2002).
- [9] W. Hampel et al. [GALLEX Collaboration], Phys. Lett. B 447, 127 (1999).
- [10] M. Altmann et al. [GNO COLLABORATION Collaboration], Phys. Lett. B 616, 174 (2005).
- [11] S. Fukuda et al. [Super-Kamiokande Collaboration], Nucl. Instr. Meth. A 501, 418 (2003).
- [12] S. Fukuda et al. [Super-Kamiokande Collaboration], Phys. Rev. Lett. 86, 5651 (2001).
- [13] S. Fukuda et al. [Super-Kamiokande Collaboration], Phys. Rev. Lett. 86, 5656 (2001).
- [14] M. B. Smy et al. [Super-Kamiokande], Phys. Rev. D 69 011104 (2004).
- [15] Y. Fukuda et al. [Kamiokande Collaboration], Phys. Rev. Lett. 77, 1683 (1996).
- [16] J. Boger et al. [SNO Collaboration], Nucl. Instr. and Meth. A 449, 172 (2000).
- [17] Q. R. Ahmad et al. [SNO Collaboration], Phys. Rev. Lett. 87, 071301 (2001).
- [18] Q. R. Ahmad et al. [SNO Collaboration], Phys. Rev. Lett. 89, 011301 (2002).
- [19] Q. R. Ahmad et al. [SNO Collaboration], Phys. Rev. Lett. 89, 011302 (2002).
- [20] S. N. Ahmed et al. [SNO Collaboration], Phys. Rev. Lett. 92, 181301 (2004).
- [21] B. Aharmim et al. [SNO Collaboration], arXiv:nucl-ex/0502021.
- [22] A. Suzuki, talk at the XVIII International Conference on Neutrino Physics and Astrophysics, Takayama, Japan, (1998).
- [23] K. Eguchi et al. [KamLAND Collaboration], Phys. Rev. Lett. 90, 021802 (2003).
- [24] T. Araki et al. [KamLAND Collaboration], Phys. Rev. Lett. 94, 081801 (2005).
- [25] S. P. Mikheyev and A. Yu. Smirnov, Sov. J. Nucl. Phys. 42 913 (1985); L. Wolfenstein, Phys. Rev. D17 2369 (1978).
- [26] Super-Kamiokande results presented in this paper are preliminary results provided by the collaboration. Since this conference, the Super-Kamiokande collaboration has published a full summary of its SK-I results in J. Hosaka et al., arXiv:hep-ex/0508053.
- [27] H. H. Chen, Phys. Rev. Lett. 55, 1534 (1985).
- [28] G.L. Fogli, E. Lisi, A. Marrone, and A. Palazzo, Phys. Lett. B 583 149 (2004).
- [29] Examples of such global analyses include J.N. Bahcall, M.C. Gonzalez-Garcia and C. Peña-Garay, JHEP 08, 016 (2004); A. B. Balantekin and H. Yüksel, Phys. Rev. D 68, 113002 (2003); A. Bandyopadhyay, S. Choubey, S. Goswami, S. T. Petcov, and D. P. Roy, Phys. Lett. B 583, 134 (2004); G. L. Fogli et al. Phys. Rev. D 66, 053010 (2002); P. C. de Holanda and A. Yu. Smirnov, Astropart. Phys. 21, 287 (2004).
- [30] A comprehensive review of reactor neutrino oscillation experiments, prior to the KamLAND experiment, can be found in C. Bemporad, G. Gratta, and P. Vogel, Rev. Mod. Phys. 74, 297 (2002).
- [31] Z. Maki, N. Nakagawa, and S. Sakata, Prog. Theor. Phys. 28, 870 (1962); V. Gribov and B. Pontecorvo, Phys. Lett. B 28, 493 (1969).
- [32] J.N. Bahcall and C. Peña-Garay, JHEP 11, 004 (2003)
- [33] O. G. Miranda, M. A. Tortola and J. W. F. Valle, Nucl. Phys. Proc. Suppl. 145, 61 (2005); A. Friedland, C. Lunardini and C. Pena-Garay, Phys. Lett. B 594, 347 (2004).
- [34] M. Nakahata, Nucl. Phys. Proc. Suppl. 145, 23 (2005).
- [35] The conference website is http://www.uu.se/LP2005.
- [36] M. Apollonio et al. [CHOOZ Collaboration], Eur. Phy. J. C 27, 331 (2003).
- [37] A. Bandyopadhyay, S. Choubey, S. Goswami and S. T. Petcov, Phys. Rev. D 72, 033013 (2005)
- [38] E. Abouzaid et al., Report of the APS Neutrino Study Reactor Working Group, http://www.aps.org/neutrino (2004).
DISCUSSION
- Jonathan Rosner
-
(U. of Chicago, USA): Can you say more about the proposal to put liquid scintillator in SNO?
- Alan Poon
-
: The main objectives of this proposed experiment are to measure the pep neutrino flux and to search for geo-neutrinos. The pep measurement will probe the vacuum-matter transition that I discussed in the talk.
The project is still in an early proposal stage. There are a number of technical problems that need to be resolved before its realisation. For example, the compatibility of the liquid scintillator and the acrylic vessel has to be established; the longevity of the current photomultiplier tube mounting structure, which was designed to have a life span of 10 years in ultra-pure water, has to be evaluated; and the optical response of the liquid scintillator has to be established.
- Peter Rosen
-
(DOE, USA): A comment about MSW. If you restrict your analysis to 2 flavors, then the fact that the solar survival probability is less than 1/2 is evidence for MSW. Pure in-vacuum oscillation give a survival probability greater than or equal to 1/2. Secondly, the best chance to see a day/night effect is to have a detector at the equator. This maximizes tha path of the neutrino through matter, and through the densest part of the Earth.
- Alan Poon
-
: Thank you for your comment. Because of time constraint, I did not have enough time to discuss this point further in my talk. It is true that even though we have not directly observed MSW effect, there are very strong indirect evidence that it is the underlying mechanism for neutrino flavor transformation in solar neutrinos. Fogli et al. showed that the null hypothesis of no MSW effect in the solar neutrino results is rejected at more than 5.