\runtitleRecent measurements of sin2 at BaBar \runauthorG. Sciolla
Recent measurements of sin2 at BaBar
Abstract
The angle is the most accurately measured quantity that determines the Unitarity Triangle. In this article I review the various measurements of this angle performed by the BaBar Collaboration, and discuss their implications in the search for new physics.
1 INTRODUCTION
The BaBar detector[1] is located at the asymmetric B-factory at SLAC. The main physics goal of BaBar is to study CP-violation in the system and provide a quantitative test of the sector of the Standard Model.
The determination of the angle through the study of decays plays a key role in this test. The measurement of from decays mediated by tree level diagrams allows for a precise test of CP violation in the Standard Model and provides the most precise constraint in the determination of the parameters and . In addition, the measurement of the same angle in final states mediated by penguin decays and diagrams can be used to look for new physics.
All measurements presented in this article are based on a dataset of events.
2 THE EXPERIMENTAL TECHNIQUE
At the -factories, violation is studied through the measurement of the time dependent asymmetry, . This quantity is defined as
| (1) |
where is the number of that decay into the -eigenstate after a time .
In general, this asymmetry can be expressed as the sum of two components:
| (2) |
where is the difference in mass between mass eigenstates.
When only one diagram contributes to the final state, the cosine term vanishes. For decays such as , , where is the eigenvalue of the final state, negative for charmonium + and positive for charmonium + . It follows that
| (3) |
which shows how the angle is directly and simply measured by the amplitude of the time dependent asymmetry.
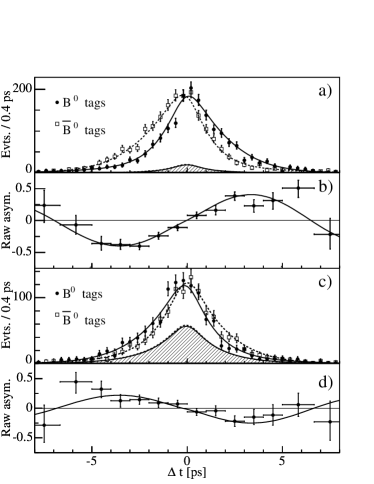
The measurement of utilizes decays of the into two neutral mesons, of which one () can be completely reconstructed into a eigenstate, while the decay products of the other () identify its flavor at decay time.
The time between the two decays is determined by reconstructing the two decay vertexes. The asymmetry amplitudes are determined from an unbinned maximum likelihood fit to the time distributions separately for events tagged as and .
3 INDEPENDENT MEASUREMENTS OF THE ANGLE
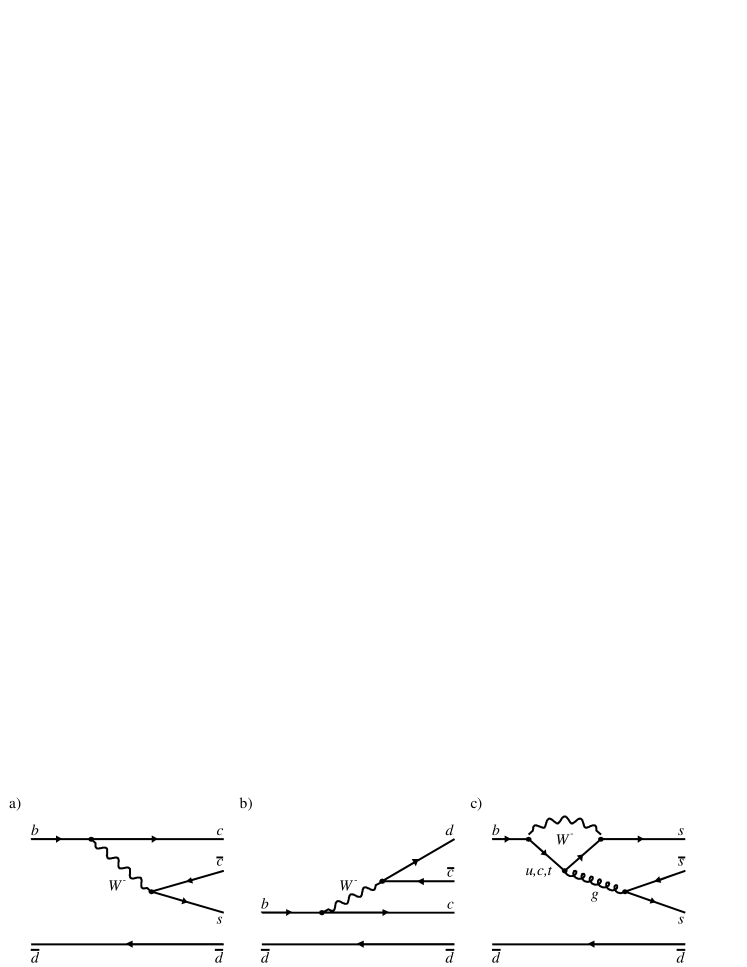
The angle can be independently measured through the three types of decays illustrated in fig. 1 and discussed in the following.
3.1
These decays, known as “golden modes”, are dominated by a tree level diagram with internal boson emission (fig. 1-a). The leading penguin diagram contribution to the final state has the same weak phase as the tree diagram, and the largest term with different weak phase is a penguin diagram contribution suppressed by . This makes in equation 2 a very good approximation.
Besides the theoretical simplicity, these modes also offer experimental advantages because of their relatively large branching fractions () and the presence of the narrow resonance in the final state, which provides a powerful rejection of combinatorial background.
The eigenstates considered for this analysis are , (2S), , and .
The asymmetry between the two distributions, clearly visible in figure 2, is a striking manifestation of violation in the system. The same figures also display the corresponding raw asymmetry with the projection of the unbinned maximum likelihood fit superimposed. The results of the fit is [2]. The main sources of systematic errors are uncertainties in the background level and characteristics, in the parameterization of the time resolution, and in the measurement of the mis-tag fractions. Most of these uncertainties will decrease with additional statistics.
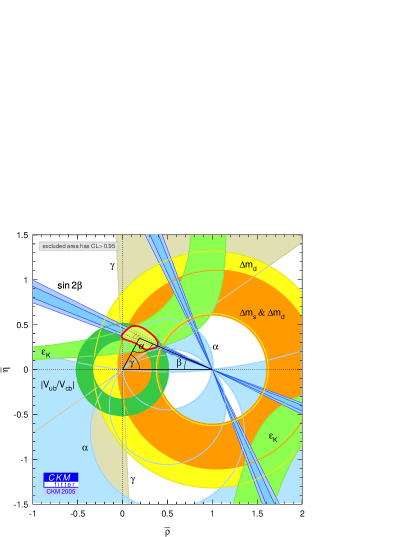
The world average value for , heavily dominated by the results from BaBar[2] and Belle[3], is . This value can be compared with the indirect constraints on the apex of the Unitarity Triangle originating from measurements of , , , and mixing as described, for example, in reference [5]. The comparison, illustrated in figure 3, shows excellent agreement between the measurements, indicating that the observed asymmetry in is consistent with the predictions of the CKM mechanism.
The measurement of leads to a four-fold ambiguity in the determination of the angle . This ambiguity can be reduced to a two-fold ambiguity measuring the sign of , which can be measured in a time-dependent angular analysis of the decays (). An analysis [4] based on 81.9 fb-1 measures , which determines the sign of to be positive at the 86.6% C.L., in agreement with the Standard Model expectation.
3.2
The decays are dominated by a tree level diagram with external boson emission (fig. 1-b). In the Standard Model, the leading penguin diagram contribution to this final state is expected to be small. The penguin-induced correction has been estimated using factorization and heavy quark symmetry to be about 2% [6]. New physics could enhance the penguin contribution and would lead to a measurement of time dependent asymmetry substantially different from that measured in decays.
BaBar measures in three different channels: [7], and [8]. Since two different diagrams can contribute to the final state in these decays, both the sine () and cosine () terms have to be extracted in the fit for . The extraction of the coefficients S and C is straightforward for the channel , which is a pure CP eigenstate. Instead, the decay is an admixture of CP-odd and CP-even components. The CP-odd fraction is measured by means of a transversity analysis[7] to be .
The results of the CP fit for decays to open charm reported in table 1 are in agreement with the Standard Model expectations.
| Channel | ||
|---|---|---|
3.3 Penguin dominated decays
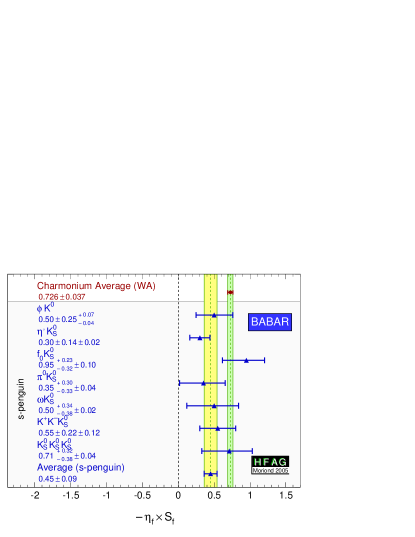
In the Standard Model, final states dominated by or decays offer a clean and independent way of measuring [9]. Examples of these final states are , , , , , and . These decays are mediated by the gluonic penguin diagram illustrated in figure 1-c. In presence of physics beyond the Standard Model, new particles such as squarks and gluinos, could participate in the loop and affect the time dependent asymmetries[10].
The decays are ideal for these studies. In the Standard Model, these decays are almost pure penguin decays, and their CP asymmetry is expected to coincide with the one measured in charmonium + K0 decays within a few percent [10]. Experimentally, this channel is also very clean, thanks to the powerful background suppression due to the narrow resonance. Unfortunately, the branching fraction for this mode is quite small (), therefore the measurement is affected by a large statistical error.
The decays are favored by a larger branching fraction (). In the Standard Model, these decays are also dominated by penguin diagrams; other contributions are expected to be small [11].
A summary of the measurements of in penguin modes [12, 13, 14, 15, 16] by the BaBar experiment is reported in figure 4. The average of all the penguin modes [17], shown in yellow in figure 4, is 2.8 away from the value of measured in the golden mode. This discrepancy, however, has to be interpreted with caution since each mode is theoretically affected by new physics in different ways.
4 SUMMARY AND CONCLUSION
The measurement of time-dependent CP asymmetry in decays have provided a crucial test of violation in the Standard Model. The parameter is now measured in decays by BaBar with a precision of 5%. Measurements of time-dependent violation asymmetries in and in penguin-dominated modes are sensitive to contributions from physics beyond the Standard Model. These measurements are still heavily dominated by statistical errors and will benefit greatly from additional data. BaBar is planning to double its dataset by 2006 and quadruple it by 2008.
References
- [1] B. Aubert et al., Nucl. Instrum. Meth. A 479, 1 (2002)
- [2] Phys. Rev. Lett. 94, 161803 (2005)
- [3] K. Abe et al., Phys. Rev. D 71, 072003 (2005)
- [4] B. Aubert et al., PRD 71 (2005)032005.
- [5] See http://ckmfitter.in2p3.fr.
- [6] X. Y. Pham and Z. Z. Xing, Phys. Lett. B 458, 375 (1999).
- [7] B. Aubert et al., arXiv:hep-ex/0506082.
- [8] B. Aubert et al., arXiv:hep-ex/0505092.
- [9] D. London and R. D. Peccei, Phys. Lett. B 223, 257 (1989); N. G. Deshpande and J. Trampetic, Phys. Rev. D 41, 895 (1990); R. Fleischer, Z. Phys. C 62, 81 (1994); N. G. Deshpande and X. G. He, Phys. Lett. B 336, 471 (1994); Y. Grossman, Z. Ligeti, Y. Nir and H. Quinn, Phys. Rev. D 68, 015004 (2003); M. Gronau and J. L. Rosner, Phys. Lett. B 564, 90 (2003).
- [10] A.B. Carter and A.I. Sanda, Phys. Rev. D 23, 1567 (1981); I.I. Bigi and A.I. Sanda, Nucl. Phys. B 193, 85 (1981); R. Fleischer and T. Mannel, Phys. Lett. B 511, 240 (2003);Y. Grossman, G. Isidori and M.P. Worah, Phys. Rev. D 58, 057504 (1998); Y. Grossman, Z. Ligeti, Y. Nir and H. Quinn, Phys. Rev. D 68, 015004 (2003); Y. Grossman and M.P. Worah, Phys. Lett. B 395, 241 (1997); R. Fleischer, Int. J. Mod. Phys. A 12, 2459 (1997); D. London and A. Soni, Phys. Lett. B 407, 61 (1997).
- [11] M. Gronau et. al., Phys. Lett. B 596, 107 (2003); M. Beneke and M. Neubert, Nucl. Phys. B675, 333 (2003).
- [12] B. Aubert et al., Phys. Rev. D 71, 091102(R) (2005)
- [13] B. Aubert et al., Phys. Rev. Lett. 94, 191802 (2005)
- [14] B. Aubert et al., arXiv:hep-ex/0503011.
- [15] B. Aubert et al., arXiv:hep-ex/0408095.
- [16] B. Aubert et al., arXiv:hep-ex/0503018.
- [17] The Heavy Flavor Averaging Group, http://www.slac.stanford.edu/xorg/hfag/.