DØ Top Quark Results and their Dependence on Successful Grid Computing
Abstract
The heaviest known Fermion particle — the top quark — was discovered at Fermilab in the first run of the Tevatron in 1995. However, besides its mere existence one needs to study its properties precisely in order to verify or falsify the predictions of the Standard Model. With the top quark’s extremely high mass and short lifetime such measurements probe yet unexplored regions of the theory and bring us closer to solving the open fundamental questions of our universe of elementary particles such as why three families of quarks and leptons exist and why their masses differ so dramatically.
To perform these measurements hundreds of millions of recorded proton-antiproton collisions must be reconstructed and filtered to extract the few top quarks produced. Simulated background and signal events with full detector response need to be generated and reconstructed to validate and understand the results. Since the start of the second run of the Tevatron the DØ collaboration has brought Grid computing to its aid for the production of simulated events. Data processing on the Grid has recently been added and thereby enabled us to effectively triple the amount of data available with the highest quality reconstruction methods.
We will present recent top quark results DØ obtained from these improved data and explain how they benefited from the availability of computing resources on the Grid.
1 Introduction
Elementary particle physics aims to find and describe the fundamental building blocks of matter and the forces by which they interact.
’Normal’ matter can be built out of only 3 elementary particles: electrons and two types of quarks labeled -quark and -quark. Electrons form the atomic shell. Triplets of quarks build the protons and neutrons that form the atomic nucleus. Protons consist of two -quarks and one -quark; neutron consist of two -quarks and one -quark. A 4th particle, the neutrino, is needed to explain radioactive -decays.
The fundamental matter particles, the Fermions, interact via four forces: Electromagnetism which binds the electrons to the atomic core, the strong nuclear force which binds the protons and neutrons within the atomic nucleus, the weak nuclear force which mediates radioactive -decays, and gravitation (which is neglected in elementary particle physics).
A feature of the weak interaction (CP-violation) requires that the above four particle, which are called the first generation of fermions, are accompanied by two more generations of 4 fermions each. The fermions of the second and third generation have quantum numbers identical to those of the first generation, but higher masses.
The final piece in the Standard Model is the mechanism of how elementary particle can obtain mass. The symmetries of the theory prohibit explicit mass terms in the fundamental equations. The so called Higgs mechanism overcomes this problem by introducing spontaneous breaking of the electro-weak symmetry. Besides “giving” mass to elementary particles it also predicts the existence of a spin 0 particle, the as yet unobserved Higgs boson.
| Leptons | electron neutrino | muon neutrino | tau neutrino | |||
| electron | muon | tauon | ||||
| Quarks | up-quark | charm-quark | top-quark | |||
| down-quark | strange-quark | bottom-quark |
Electromagnetism: Photon , Weak force: , Strong force: Gluon , Gravitation: Graviton
When the top quark was discovered in 1995 at Fermilab [1, 2] it completed the set of quarks predicted by the Standard Model. Its mass was determined to be 30 times higher than that of the second heaviest fermion thereby being very close to the electroweak symmetry breaking scale.
Within the Standard Model the properties of the top quark with the exception of its mass are fully defined. The various possible extensions of the Standard Model predict different variations of these properties. The high mass of the top quark and its closeness to the electroweak symmetry breaking scale has led to speculations that the top quark plays a special role among the elementary particles which is not reflected in the current Standard Model. Measuring the properties of the top quark is therefore essential to complete the verification of the Standard Model and to check the proposed theories of new physics.
In the following it will be described how such measurements are performed. Section 2 describes the Tevatron accelerator, the DØ experiment and how the obtained data are prepared for physics analysis. In section 3 the tools needed to actually perform this data preparation and to provide the resulting data to the physicists for analysis are discussed. Finally in sections 4 to 6 with the example of three important measurements it is explained how recent DØ top quark results are obtained emphasising in which way the analyses rely on DØ’s ability to utilise grid computing.
2 Experiment
2.1 The Fermilab Tevatron
To produce top quarks (in pairs) the energy equivalent to (twice) the top quarks mass needs to be concentrated into a volume which allows it to be to consumed in a fundamental reaction, .
The only machine which is currently capable of achieving this is the Tevatron proton-antiproton collider at Fermilab. The Tevatron is an accelerator ring with a circumference. Protons and antiprotons are accelerated around the ring in opposite directions until they reach an energy of . The beams of protons and antiprotons are then brought to collision at two interaction points both of which are equipped with detectors to record the resulting events. The detectors are CDF and DØ.
After an initial run in 1985–1995 the Tevatron has been upgraded and is operating again in its so called Run II since 2001.
2.2 DØ Detector
The detectors to record the collision events are built and operated by international collaborations. The DØ-collaboration consists of around 670 physicists from 86 institutes in 19 countries on 4 continents.
Like all modern day detectors in high energy particle physics DØ consists of three main detection systems, which are placed in a cylindrical structure around the beam pipe.
The innermost system is the tracking system which is used to detect charged particles. In DØ it consists of a high resolution silicon microstrip detector and a scintillating fiber tracker. The complete tracking system is enclosed in a superconducting solenoidal magnet creating a field of T. This enables DØ to measure the momentum and the charge sign of the detected particles. Efficient measurement of charged particles extends to pseudorapidities of , where pseudorapidity is a measure of azimuthal angle with respect to the beam axis, .
The calorimeter surrounds the tracking system. It aims to measure the energy of charged and neutral particles by complete absorption. The DØ calorimeter is built of liquid argon and uranium. It is separated into a central part (CC) which covers and two end calorimeters (EC) which cover to . By varying absorber thickness and materials the section closest to the interaction point within each of the three calorimeter parts specialises on absorbing electrons and photons while only the outer two section absorb the hadrons. The distinction between the inner sections (the electromagnetic calorimeter) and the outer two sections (the hadronic calorimeter) makes it possible to distinguish electrons and photons from hadronic particles.
Usually only muons and neutrinos escape these calorimeters. To identify muons the calorimeters are surrounded by 3 layers of drift tubes, the so called muon chambers. A toroidal magnetic field between the innermost two layers allows DØ to improve the measurement of muon momenta. The presence of neutrinos has to be inferred from a transverse momentum imbalance.
In total DØ has around million readout channels. All signals produced in the various detector components are digitised and collected into an event record and stored to tape in files which typically contain a few thousand events each. At a data taking rate of and an average event size of DØ writes to tape. The total amount of data recorded so far is .
Before these data are used for physics analyses a set of common and compute intensive reconstruction algorithms is applied to the raw data. Signals from the tracker are passed through pattern recognition algorithms which reconstruct the tracks of individual charged particles within the detector and determine their charges and momenta; Calorimeter cells are combined into jets of energy with various jet reconstruction algorithms. From these then more global event properties like e.g. the missing transverse energy are computed.
3 Grid
In order to handle its large amount of data and to serve them to institutes around the world DØ uses grid technologies. Since recently the grid is also used for the distribution of jobs required to perform the central reconstruction and simulation tasks.
3.1 SAM — Sequential Access through Metadata
SAM is DØ’s data handling system [3]. It exploits the fact that events are independent of each other and thus the order in which events are processed doesn’t matter.
Users request ‘datasets’ instead of ordered lists of files. SAM then optimises the order in which it presents the files to the users to minimise the number of copy or tape operations. In SAM each file has metadata describing its content. These metadata are used to describe the datasets.
For derived files the metadata also contain information about the file’s parents and about the application and version it was produced with. This information provides a complete book-keeping for any production operation.
Built on this data-handling system DØ has created a tiered infrastructure which allows coherent data access from all over the globe.
3.2 JIM — Job Information Monitoring
JIM aims to provide job submission to DØ’s distributed resources integrated with the SAM data-handling system. It is based on globus [4] and condor [5]. JIM also provides monitoring of remote (batch-)jobs. This monitoring information is held in an XML database. A standard view to the information is accessible via the Web. The combination of SAM and JIM is called the SamGrid [6, 7, 8].
3.3 Application
DØ is relying on the described capabilities in distributed computing to perform all its generation of simulated events since the beginning of Run II in 2001. Alone in the last year 80 million events with full detector response simulation corresponding to TB of data were generated and reconstructed remotely. A stable and reliable data-handling system is required for this task.
In addition DØ is using distributed computing for re-reconstruction of data. Re-reconstruction of data enables us to apply the most recent and most advanced algorithm to data which has been reconstructed before with older software versions. Improvements in the algorithms result from thorough investigation of the actual detector performance.
In a first effort at the end of 2003 300 million data events were reprocessed from an intermediate data format. Significantly improved tracking algorithms and improved tables of hot and dead calorimeter cells were applied. TB had to be read from tape and processed. 30% of this effort was done at non-dedicated remote sites. Following this effort the dataset available for this years publications using the improved algorithms could be doubled.
Currently DØ is again reprocessing its full dataset. Improved calorimeter calibration is applied during this reconstruction. As some of the information required for this computation is only available in the original raw data this reprocessing is performed from raw data. The reconstruction of billion events involves reading TB from tape and distributing them to the participating site. All participating sites need the ability to access the central calibration database either directly or through a local proxy server. It was planned to perform the complete effort on remote sites as the DØ processing farm at Fermilab, being busy with current data-taking, can only contribute to a small fraction.
In this effort the data-handling, the job distribution and the associated book-keeping capabilities of SamGrid are used. It is expected that the current reprocessing will double the dataset available for analysis with upto date reconstruction algorithms during early 2006.
4 Top pair production cross-section
At the Tevatron top quarks are most likely produced in pairs. The dominant process is quark anti-quark annihilation to a gluon that then splits into (Fig. 2). A pair production cross-section is thus probing our understanding of the strong force and its couplings to the top quark.
The top-quarks produced subsequently decay to a -quarks and a -boson to nearly 100%. Decay modes of events are thus determined by the decay modes of the s. Dilepton events feature two jets from -quarks, two leptons and a transverse momentum imbalance (missing transverse energies, ) stemming from the 2 neutrinos that escape the detector. Lepton plus jets events consists of two jets from -quarks, two additional jets from light quarks, a single lepton and missing transverse energy from the neutrino. The alljets events will have at least 6 jets, 2 of which stem from -quarks. As taus in the final state are difficult to identify usually only electron and muons are used in the lepton channels. The dilepton, lepton plus jets and alljets then contribute with , and , respectively.
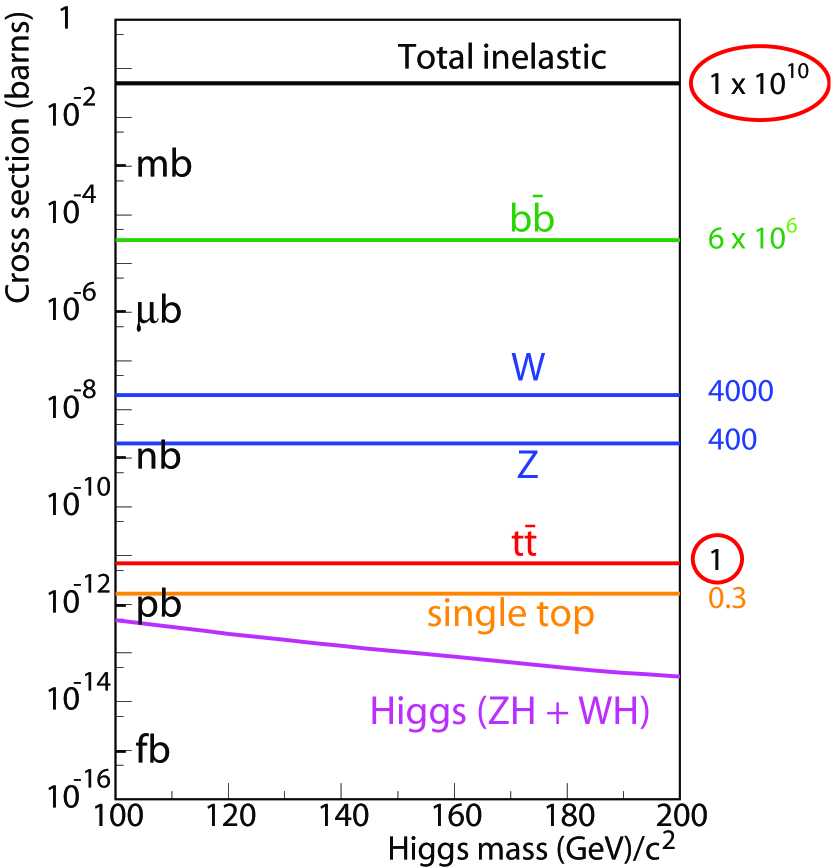
In order to measure a cross-section it is necessary to count the signal events in the data. In addition it is important to understand the amount of background events which remain after selection. In events background arises from multijet events, - and -production. In multijet events instead of a pair of top quarks a pair of light (or -)quarks is produced. Additional jets arise from initial and final state gluon radiation. - and -bosons are also produced by annihilation. Their leptonic decay modes can look like signal when additional jet arises from gluon radiation.
Besides these physics backgrounds instrumental backgrounds are important. Misidentification of physics objects as being leptons and momentum mismeasurement leading to overestimated are the most important. These misidentification and mismeasurements are in themselves rare, however, the cross-sections for the backgrounds are orders of magnitude higher than that for production (see Fig. 2).
mf_s_chanel_ttbar {fmfgraph*} (35,30) \fmfstraight\fmfleftem,ep \fmfrightq,qb \fmfplainem,v,ep \fmfgluon,lab=v,vv \fmffermionq,vv,qb \fmflabelep \fmflabelem \fmflabelq \fmflabelqb {fmffile}mf_t_chanel1_ttbar {fmfgraph*} (35,30) \fmfstraight\fmfleftg1,g2 \fmfrightq,qb \fmffermionq,v,vv,qb \fmfgluong1,v \fmfgluong2,vv \fmflabelg1 \fmflabelg2 \fmflabelq \fmflabelqb
mf_t_chanel2_ttbar {fmfgraph*} (35,30) \fmfstraight\fmfleftg1,g2 \fmfrightq,qb \fmfgluong1,v \fmfgluong2,vv \fmfphantomq,v,vv,qb \fmffreeze\fmffermionq,vv,v,qb \fmflabelg1 \fmflabelg2 \fmflabelq \fmflabelqb {fmffile}mf_g_fusion_ttbar {fmfgraph*} (35,30) \fmfstraight\fmfleftg1,g2 \fmfrightq,qb \fmffermionq,vv,qb \fmfgluong1,v,g2 \fmfgluonv,vv \fmflabelg1 \fmflabelg2 \fmflabelq \fmflabelqb
All analyses start by selecting event by event the signatures expected from the relevant final state. In the lepton plus jets analysis, which shall serve as an example here, this means requiring at least jets, an isolated (non-collinear) lepton and missing transverse energy. All objects are required to have a transverse momentum larger than . This yields 87 jets and 80 jets events in .
The efficiency of the selection is determined from applying this selection to simulated signal events. The agreement between simulation and data was checked in various distributions at preselection level. Additional smearing was applied where necessary. The efficiencies obtained are and for the jets and jets channel, respectively.
The background within the selected samples is dominated by jets events, which have the same signature as events. The samples also include contribution from multijet events from instrumental background. In order to determine the amount of background two method are applied. The instrumental background is taken from data following the “matrix” method described in [18].
To estimate the physical jets background a discriminant is built that allows separating the signal from background on a statistical basis. The optimal discriminant was found to be built from six observables: i) , the scalar sum of the of the four leading jets; ii) , the azimuthal opening angle between the lepton and the missing transverse energy; iii) , the minimum of an energy normalised distance between pairs of jets; iv) , the centrality; v) , the event aplanarity; vi) , the event sphericity.
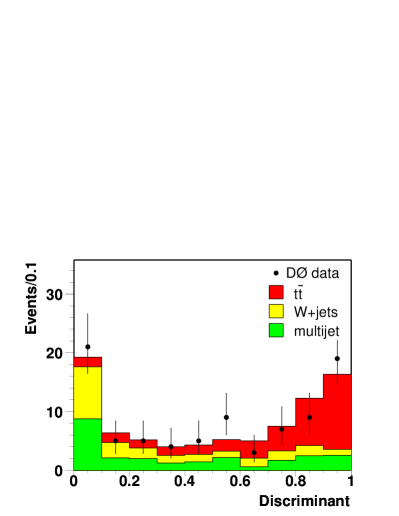
The amount of signal and jets background is then fitted to the observed distribution using the shapes expected from simulation. The instrumental background is kept fixed to the amount obtained from the matrix method. The resulting composition of signal and background is visualised in Fig. 3 as function of the events discriminant value. The final result from applying this method to of data [10] is
| (1) |
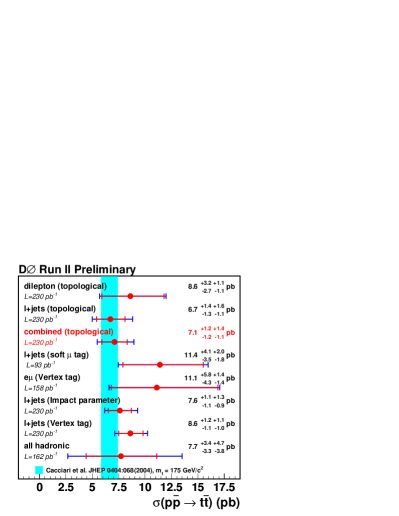
The result agree with the Standard Model prediction of [14, 15, 16, 17]. It is also consistent with results obtained with other methods and from other channels as presented in Fig. 3. Thus at the current level of precision there is no hint of deviations from the Standard Model, neither regarding the amount of production nor regarding the composition of decay channels.
5 Single top production
Beside being produced via strong interaction the top can also be produced via the weak interaction. When the intermediate boson is a it is produced singly. Measuring the single top production cross-section thus tests the strength of the coupling at the -vertex.
Two different Feynman diagrams with different final states contribute to the single top production, an -channel diagram in which the top is accompanied by a -quark and a -channel diagram in which it is accompanied by a light quark and a -quark diagram, see Fig. 4.
mf_single_top {fmfgraph*} (35,30) \fmfstraight\fmfleftem,ep \fmfrightq,qb \fmfplainem,v,ep \fmfphoton,lab=v,vv \fmfplainq,vv,qb \fmflabelep \fmflabelem \fmflabelq \fmflabelqb {fmfgraph*} (40,30) \fmfstraight\fmfleftg1,q1 \fmfrightb,t,dummy,q2 \fmfplainq1,vv,q2 \fmfphantomg1,dv,b \fmfphantomvv,dv \fmffreeze\fmfgluon,tension=2g1,g2 \fmfplaint,dv,g2,b \fmffreeze\fmfphoton,lab=dv,vv \fmflabelg1 \fmflabelq1 \fmflabelq2 \fmflabelt \fmflabelb
For the current analyses only the leptonic decay mode of the stemming from the top-decay is considered. While for the -channel the -quark produced together with the top quark is expected to be visible in the detector, for the -channel the associated -quark is likely to disappear along the beam pipe. So only a light quark with large transverse momentum is expected in addition to the top decay products.
In order to perform this analysis efficiently it is important to distinguish between light quark jets and -quark jets. To tag jets that stem from a -quark the long -lifetime is exploited. Hadrons formed from -quarks can travel several millimeters before they decay.
One method of -tagging is through reconstruction of secondary vertices. Tracks associated with a -hadron decay will form a vertex which due to the long lifetime is separated from the primary interaction vertex. The displacement of the secondary vertex is used to identify -hadrons. The tagging efficiency and purities directly enter into the signal efficiencies and purities for the single top analysis. Thus this analysis is specifically profiting from the improved tracking that is needed for a precise vertex reconstruction and has been provided by the 2003 data reprocessing.
The actual single top analysis is performed separately for the two channels, treating muons and electrons and further single and double tagged events separately. For each of these 8 analysis chains a neural network is trained to distinguish signal from background.
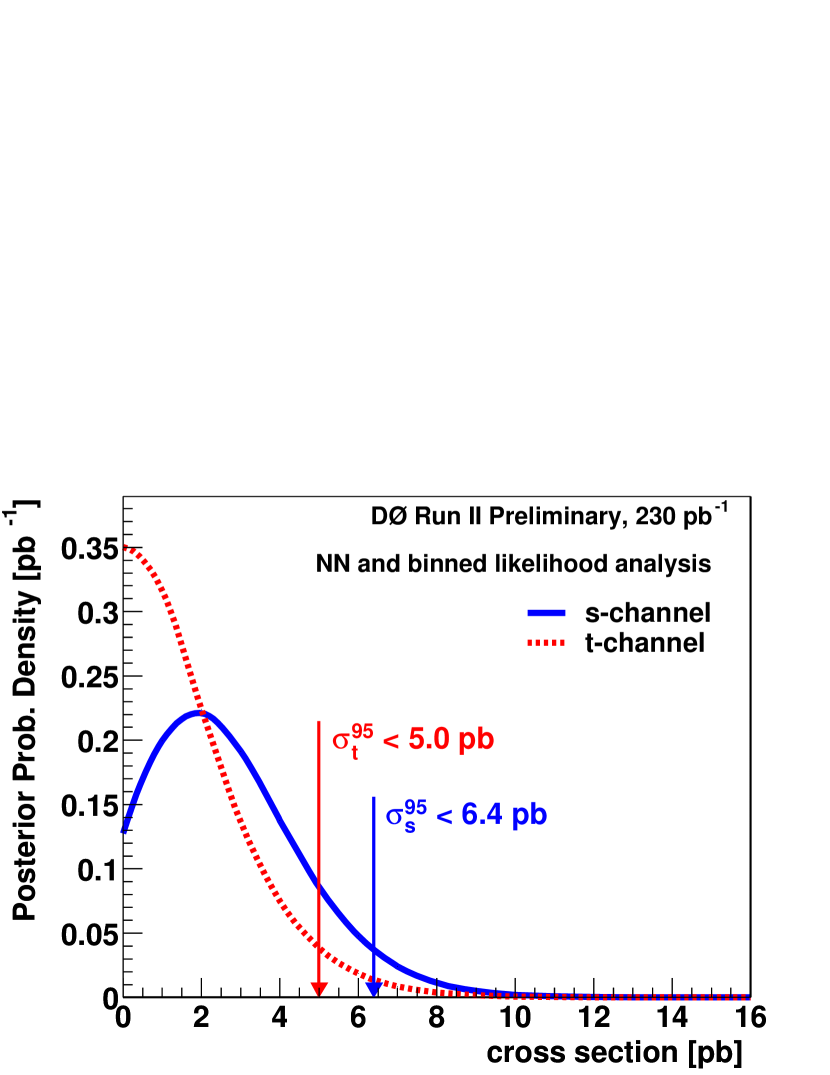
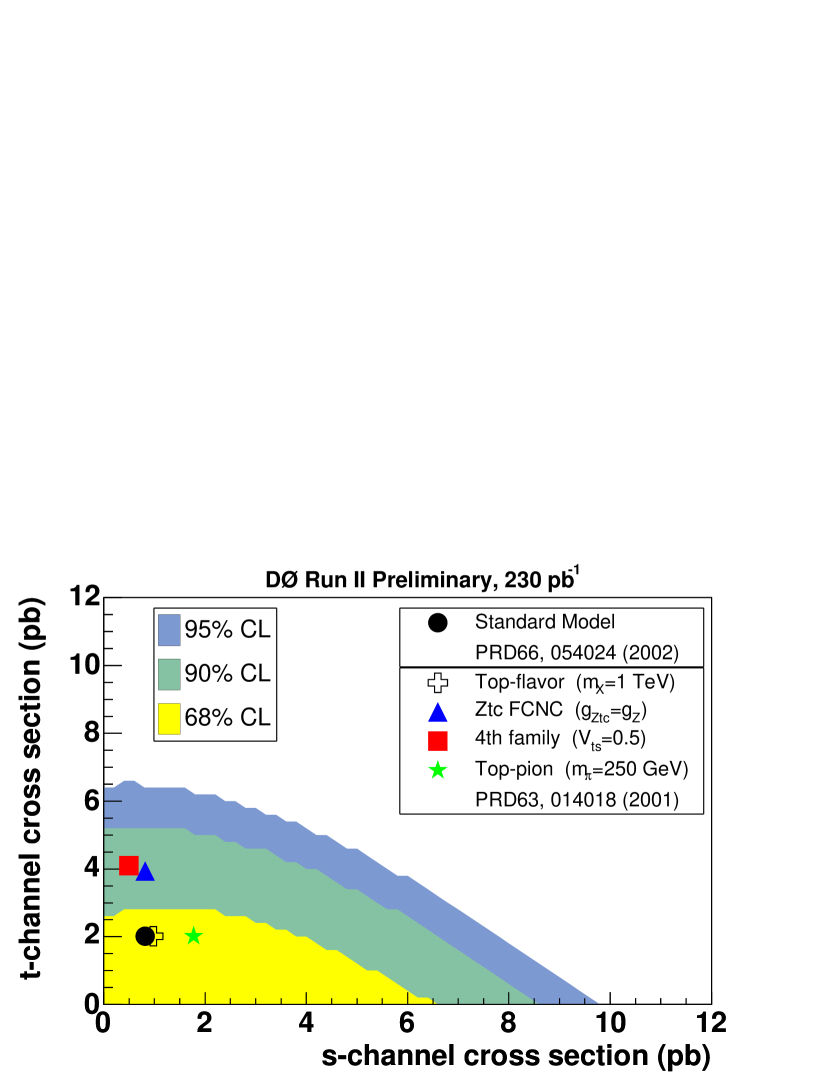
The final results are obtained from a binned log-likelihood. In of data no excess over the expected background is observed and upper limits on the cross-sections are set [19]:
| (2) |
Fig. 6 shows the posterior probability densities. These are the current worlds best limits. In a two dimensional presentation of these cross-section limits in Fig. 6 one can see that these limit are starting to reach the interesting region. Several extensions of the Standard Model can be checked before the sensitivity reaches the level of the Standard Model expectation.
6 Top quark mass measurement
The mass of the top quark as with all other fermion masses, isn’t predicted by the Standard Model. However, they enter virtual corrections to various processes. A precise knowledge of the top mass can thus still be used for checking the consistency of the Standard Model. It is also used to restrict the masses allowed for the Higgs boson within the Standard Model.
Here the most recent result on the top quark mass obtained be DØ is reported. It is based on the semileptonic decay channel with a selection identical to the one described for the cross-section measurement above. After the initial selection the sample is purified by cutting on a discriminant similar to the one used in that measurement.
Then the mass of the top quark is reconstructed event by event. First the full neutrino momentum needs to be recovered. The missing -coordinate is recovered by requiring that the combined invariant mass of particles assumed to be from the boson is consistent with the -mass. Then the lepton-neutrino pair and the four jets need to be assigned to the two top quarks. The invariant mass of these two triples is the reconstructed top quark mass. The correct assignment of particles to their parents as well as precisely measured momenta are crucial for this measurement.
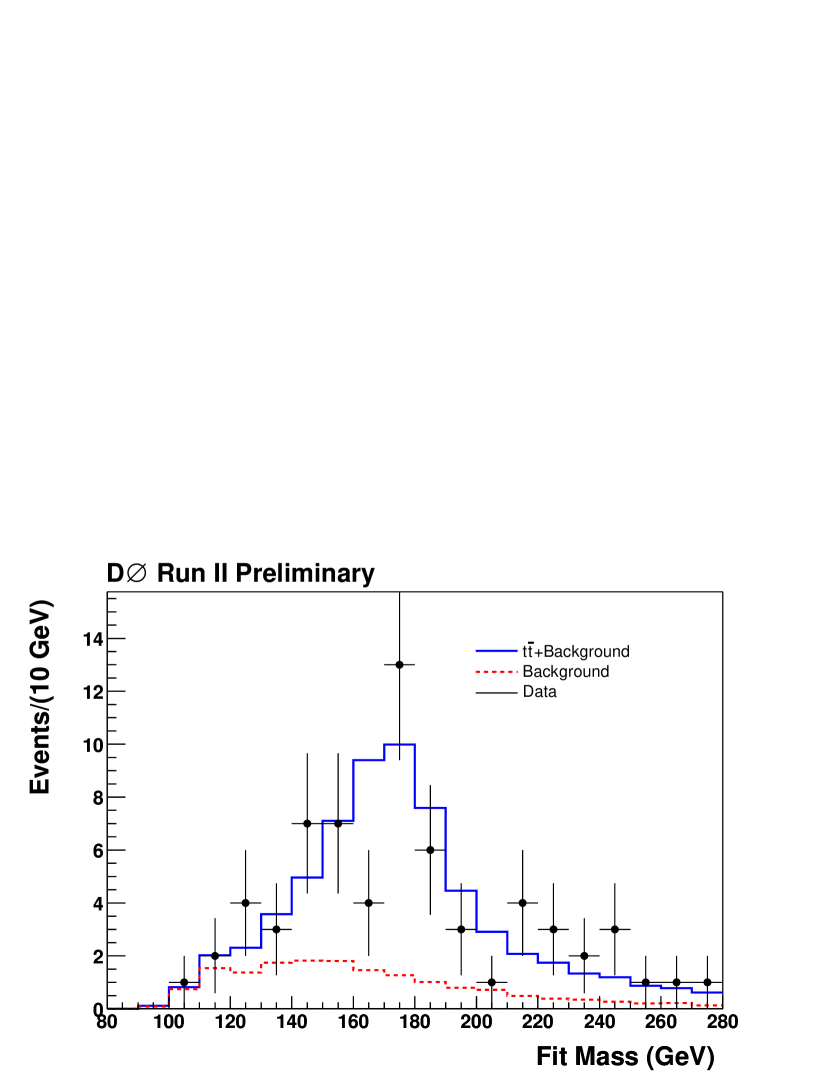
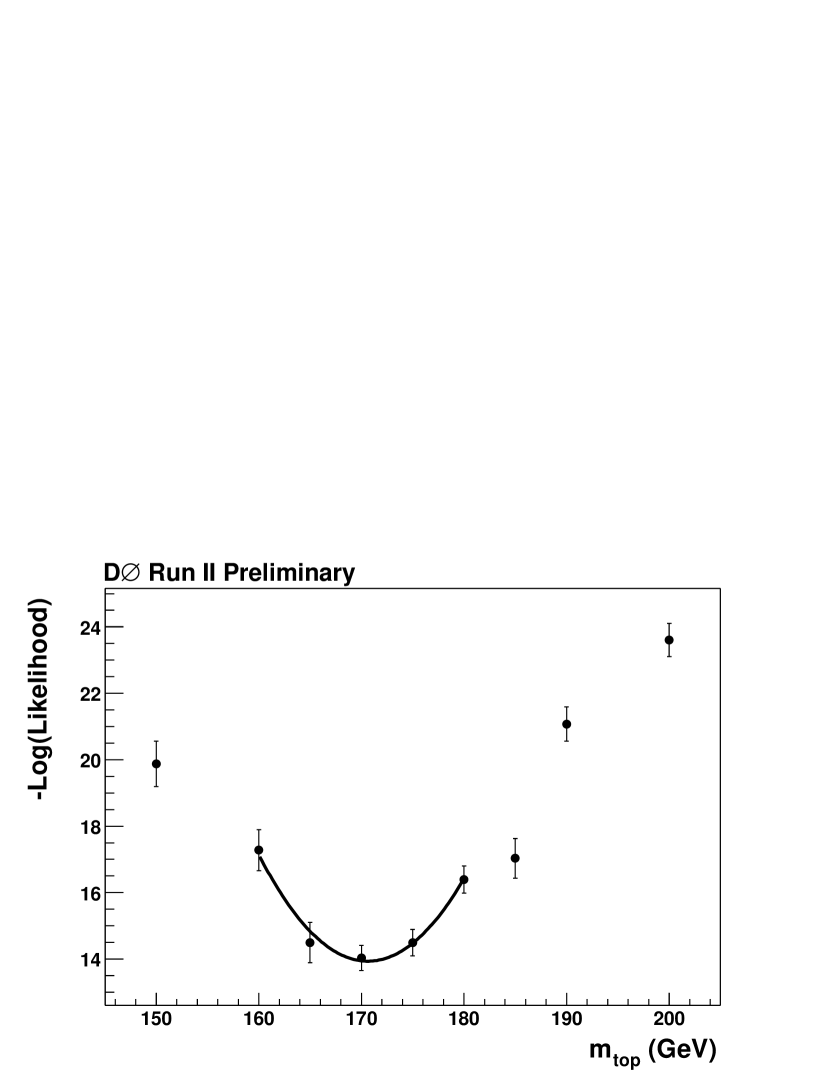
To determine the overall result the top masses reconstructed event-by-event are filled into a histogram and compared to simulations that were done for various hypothetical values of and that include the expected amount of background (Fig. 8). Finally the best value for is obtained with a maximum likelihood method (Fig. 8).
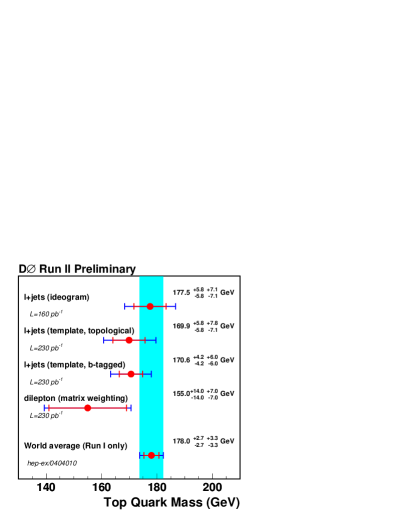
Results are presented for two options. A purely topological selection that uses all the described data and a selection which requires at least one -tag thereby reducing the number of possible assignments of jets to the top-quarks and also reducing the background [21]:
| (3) |
In Fig. 9 this result is compared to other results of in DØ. All method are consistent with each other and also with the result obtained in Run I.
While the measurements of the top quark mass rely on simulation and a good tracking for an efficient -tagging, they also depend on the overall calibration of the calorimeters to determine the measured jet energies.
This last issue has been tackled by improving the calibration of the calorimeter. This new calibration is applied during the currently ongoing data-reprocessing (see Section 3.3). Added to the amount of new data expected from the Tevatron during this year the reprocessing effort will again be responsible for doubling the dataset available for coherent physics analysis in 2006.
7 Summary
With the example of three top analyses it has been shown how physics results rely on DØ’s ability of successful Grid computing.
Distributed computing has been used for production of simulated events since the beginning of Tevatron Run II. In addition re-reconstruction of data in order to apply improved reconstruction algorithms or calibration constants is currently being performed in a distributed grid like manner for the second time. DØ is relying on their SamGrid project to perform these tasks.
Physics analyses rely on simulation and profit from improved algorithms implemented with improved detector understanding: the described top pair production cross-section measurement relies on the ability to extract the shape of a discriminant in signal and background simulation in order to determine the signal to background ratio in the selected events. tagging, which is a very powerful technique for enhancing the signal to background ration in top events, profits from the tracking improvements that were made available through the first reprocessing. DØ’s single top cross-section limits which are currently the worlds best limits are directly dependent on the -tagging efficiency. The top mass measurement in addition requires an excellent understanding of the jet energy scale. The current data re-reconstruction effort is applying improved calorimeter calibration constants which will reduce the systematic uncertainty due to the jet energy scale, which currently dominates the uncertainty.
These top quark measurements are just examples that illustrate how the production of simulated events impacts the physics results and where it is important to increase the dataset reconstructed with the latest algorithms by re-reconstructing older data. Other analyses in DØ’s wide physics programme profit from these efforts in a similar manner. Besides top quark measurements this include all aspects of the Standard Model as well as direct searches for new physics. Grid computing enables DØ to get the most of these data.
References
References
- [1] CDF , F. Abe et. al., “Observation of top quark production in anti-p p collisions,” Phys. Rev. Lett. 74 (1995) 2626–2631, hep-ex/9503002.
- [2] DØ , S. Abachi et. al., “Observation of the top quark,” Phys. Rev. Lett. 74 (1995) 2632–2637, hep-ex/9503003.
- [3] DØ , M. Diesburg et. al., “System software and hardware architectures for the sequential access model.” DØ-Note 3464, 1998.
- [4] I. Foster and C. Kesselman Intl J. Supercomputer Applications 11(2) (1997) 115–128.
- [5] D. Epema, M. Livny, R. van Dantzig, X. Evers, and J. Pruyne, “A worldwide flock of Condors: Load sharing among workstation clusters,” Future Generation Computer Systems 12 (1996) 53–65.
- [6] A. Baranovski et. al., “SAM-Grid: A system utilizing grid middleware and SAM to enable full function grid computing,” Nucl. Phys. Proc. Suppl. 120 (2003) 119–125.
- [7] A. Baranovski et. al., “The sam-grid project: Architecture and plan,” Nucl. Instrum. Meth. A502 (2003) 423–425.
- [8] A. Baranovski et. al., “Management of Grid jobs and information within SAMGrid,” cs.dc/0307007. ArXiv:cs.dc/0307007.
- [9] DØ , V. M. Abazov et. al., “Measurement of the t anti-t production cross section in p anti-p collisions at = 1.96 TeV in dilepton final states,” hep-ex/0505082.
- [10] DØ , V. M. Abazov et. al., “Measurement of the t anti-t production cross section in p anti-p collisions at = 1.96 TeV using kinematic characteristics of lepton + jets events,” hep-ex/0504043.
- [11] The DØ Collaboration, “Measurement of the production cross-section at in the channel using secondary vertex -tagging.” DØ note 4528-CONF, August, 2004.
- [12] DØ , V. M. Abazov et. al., “Measurement of the t anti-t production cross section in p anti-p collisions at = 1.96 TeV using lepton + jets events with lifetime b-tagging,” hep-ex/0504058.
- [13] The DØ Collaboration, “Measurement of the cross section in the all-jets channel.” DØ note 4428, April, 2004.
- [14] E. L. Berger and H. Contopanagos, “Threshold resummation of the total cross section for heavy quark production in hadronic collisions,” Phys. Rev. D57 (1998) 253–264, hep-ph/9706206.
- [15] R. Bonciani et. al., “NLL resummation of the heavy-quark hadroproduction cross- section,” Nucl. Phys. B529 (1998) 424–450, hep-ph/9801375.
- [16] N. Kidonakis and R. Vogt, “Next-to-next-to-leading order soft-gluon corrections in top quark hadroproduction,” Phys. Rev. D68 (2003) 114014, hep-ph/0308222.
- [17] M. Cacciari, S. Frixione, M. L. Mangano, P. Nason, and G. Ridolfi, “The cross-section at and : A study of the systematics due to parton densities and scale dependence,” JHEP 04 (2004) 068, hep-ph/0303085.
- [18] DØ , B. Abbott et. al., “Extraction of the width of the boson from measurements of and and their ratio,” Phys. Rev. D61 (2000) 072001, hep-ex/9906025.
- [19] DØ , V. M. Abazov et. al., “Search for single top quark production in p anti-p collisions at = 1.96 TeV,” hep-ex/0505063.
- [20] The DØ Collaboration, “Measurement of the top quark mass in the lepton+jets channel using DØ Run II data.” DØ note 4574-CONF, August, 2004.
- [21] The DØ Collaboration, “Measurement of the top quark mass in the lepton+jets channel using DØ Run II data: The low bias template method.” DØnote 4728-CONF, 2005.
- [22] The DØ Collaboration, “Measurement of the top quark mass in the dilepton channel.” DØ note 4425-CONF, February, 2005.
- [23] CDF Collaboration, DØ Collaboration and Tevatron Electroweak Working Group , P. Azzi et. al., “Combination of CDF and DØ results on the top-quark mass,” hep-ex/0404010.