Present address:
]Rutgers University, Piscataway, NJ 08855
Present address:
]Black Mesa Capital, Santa Fe, NM 87501
Present address:
]University of Connecticut, Storrs, CT 06269
Present address:
]LIGO/Caltech, Pasadena, CA 91125
Present address:
]Phonak AG, CH-8712 Stäfa, Switzerland.
Present address:
]SCIPP, University of California, Santa Cruz, CA 95064.
First observation of the decay
Abstract
Experiment 865 at the Brookhaven AGS has observed the decay . The branching ratio extracted is where the third term in the error results from the use of a model to extrapolate into a kinematic region dominated by background.
pacs:
13.20.Eb, 13.40.KsThe internally converted, radiative decays, , are an important source of information on the kaon. For example, within the framework of Chiral Perturbation Theory (ChPT) ChP radiative kaon decays can serve both as an important test and a source of input parameters for the theory.
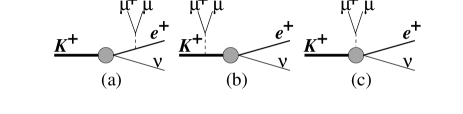
The is described by the graphs of Fig. 1. The tree diagrams (a) and (b) are the inner bremsstrahlung (IB), where the virtual photon is radiated by the kaon or positron. This contribution is electron-helicity suppressed and is negligible for the decay . The short distance, structure-dependent (SD) terms are combined in graph (c). The SD contribution is characterised by form factors , , and , which we define in accordance with the Particle Data Group Eidelman et al. (2000). These may be functions of and , the invariant masses of the and the pairs, respectively. In the vector meson dominance picture Bardin et al. (1976), this dependence has the form
| (1) |
with similar expressions for and . Here, is the -meson mass and is the mass of the for and of the for and . ChPT relates the form factors and to those of the decay and form factor to the kaon charge radius. Bijnens et al. Bijnens et al. (1993) gave a ChPT prediction for the branching ratio of . The previous experimental limit was Eidelman et al. (2000); Adler et al. (2000).
Experiment E865 at the Brookhaven National Laboratory Alternating Gradient Synchrotron (AGS) has produced substantial improvements in our knowledge of these radiative decays. Results for the decays and have already been reported Poblaguev et al. (2002). This paper presents results from E865 for the first observation of the decay .
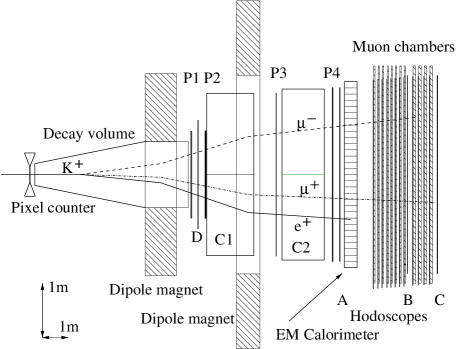
The experimental apparatus for Brookhaven E865 is shown in Fig. 2 and has been described in detail elsewhere Appel et al. (2002). A 6 GeV/c unseparated beam from the AGS was incident on a 5-m long evacuated decay volume. Decay particles from this region were separated into positive and negative charges by a dipole magnet and were momentum-analysed by a spectrometer containing a second dipole magnet and four 4-view wire chambers, P1 – P4. Particle identification was provided by two pairs of gas Cherenkov counters, C1 and C2 (hydrogen on the negative-particle side and methane on the positive side), a -element Shashlyk calorimeter containing 15 radiation lengths of lead/scintillator sandwich, and a muon detector containing twelve layers of iron with twelve 2-view wire chambers interspersed. Additionally, there were 4 hodoscope planes, A – D, for timing and triggering. A -element pixel detector, with pixel size mm, was located in the incident kaon beam to determine the position of the decaying kaon at the entrance to the decay volume.
The data taking for this part of E865 took place in parallel with studies of the () and decays, which have already been published Pislak et al. (2001, 2003, 2001).
Selection of candidate events required three tracks giving a vertex -coordinate within the decay region and an acceptable value of , where is the sum of squares of the deviations of the three tracks from the fitted vertex. Also, the individual tracks were each required to have good for the reconstruction and good timing. Electron identification required signals in both positive-side Cherenkov detectors and an energy deposition in the calorimeter equal to the reconstructed track momentum. The above cuts were also used in the event selection for the analysis. Additionally, for , the muon candidate tracks were required to have sufficient hits in the muon wire chambers, a hit in the appropriate element of the B hodoscope, located in the middle of the muon stack, and a signal consistent with minimum ionising in the shower calorimeter.
For each event, the neutrino momentum was calculated from the missing momentum; . The magnitude of was taken as the average value, derived from measurements of pion momenta from decays. The direction of was determined from the beam pixel detector and the reconstructed vertex where possible. About 45% of events had an unambiguous hit in the beam pixel detector. For those events that did not, the average kaon beam direction was assumed in the event reconstruction.
Simulation of the experiment was carried out using the GEANT package GEA . A problem with this package is that pion interactions are not always well simulated. As a result, the probability that a pion can penetrate well into the muon stack, causing it to be misidentified as a muon, is not well determined by the simulation. Experimental studies using , (each followed by ) and events established that this to misidentification probability is calculated by the simulation with an uncertainty of about 10%.

With the above cuts, 1834 candidate events remain. These are shown in Fig. 3 as a scatter plot of against , which also shows the region of where genuine events are expected.
Three sources of background were considered:
(a) () with both pions
misidentified as muons,
(b) Accidentals, and
(c) () with the pions
misidentified as , and respectively.
The contributions from these were determined as follows.
events give the largest contribution to the background. A large sample of Monte Carlo events (, equivalent to 20 times the number of data events) was generated. Background hits taken from actual data events were added to the simulated events, and the sample was analysed as for data events. This procedure should give a realistic estimate of the background shape. The magnitude of he background has an error due to uncertainty in the to misidentification probability, which is about 0.05 with an error of .
A sample of accidental events was extracted from the data by selecting events with bad timing and badly reconstructed vertices. The reconstructed total charged-track momenta for these events shows a tail above 6.5 GeV/c. The total charged-track momentum spectrum for the candidates shows a similar tail, which is assumed to arise entirely from accidentals. Therefore, the background contribution from accidentals was assumed to have the same shape as the bad-timing, bad-vertex events, with a magnitude derived by scaling this high-momentum tail to match that in the data.
The background contribution from decays was estimated by examining the data events obtained from the minimum-bias trigger. The and identification was required but there was no particle identification requirement on the third particle. The sample was then scaled by the known to misidentification probability of , determined from a study of events, where the contamination from decays is easily identified by the kinematics of the final state.
Background from is negligible because of the small to misidentification probability and the low branching ratio for this decay.

The three sources of background are shown as plots of against in Fig. 4, which also shows the simulated signal. The signal appears as a peak in at the kaon mass, , the region indicated by the vertical lines in Figs. 3 and 4. It is also apparent from Fig. 4, that the signal-to-background ratio will be best for high values of
Because the signal-to-background ratio becomes poor at low , it is difficult to extract significant information on form factors from the present experiment. Initially, therefore, we assumed form factors for in order to extrapolate the signal into regions where it is not observable, to extract the total branching ratio. To do so, the 2-dimensional plot, Fig. 3, was fitted with the sum of the signal and background contributions shown in Fig. 4. While the magnitude of the signal was a free parameter in the fit, the shape of the signal distribution was fixed by the form factors , and , whose values are taken from the E865 measurements on and Poblaguev et al. (2002):
| (2) | |||||
| (3) | |||||
| (4) | |||||
Since the contribution to the background is uncertain to about 10%, we allow the magnitude of it to float in the fitting.


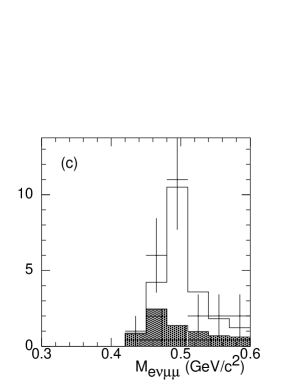
The fit is shown in Fig. 5 as a projection onto the axis of the fit and of the data from Fig. 3. The three contributions to the background are shown separately. Fig. 6 shows the same projection for events in three bands of as follows:
Fig. 6(a):
Fig. 6(b):
Fig. 6(c):
These regions are indicated by the horizontal lines in Figs. 3 and 4. Fig. 6(c) contains 24 data events with a fitted background of 6.9 events, and Fig. 6(b) has 176 events with a background of 1334 events for the reconstructed kaon mass range .
The fit resulted in a branching ratio, , of
| (5) | |||||
The decay was used as a normalisation channel for the analysis. Thus the systematic error arises predominantly from uncertainties in simulation of the muon detection efficiency since muons are not involved in . For this, we estimate . Additional errors arise from uncertainties in the form factors of Eqs. (2), (3) and (4), and also in the slopes of the and dependence of these form factors. For this contribution, we assume, as in Ref. Poblaguev et al. (2002), that these slopes are uncertain to . The fit gave for 112 degrees of freedom. The best fit resulted in a scaling factor for the background of which is consistent with the estimated uncertainty in the to misidentification probability of about . Combining the errors in quadrature gives
| (6) |
A study of the statistical significance of the background function shows that, in fitting the entire vs. distribution, the probability of a statistical fluctuation in the background simulating the signal is .
If , and are all allowed to vary in the fitting, the resulting values for , , and are consistent with Eqs. (2), (3), (4) and (5) but with substantially larger errors. This is the expected consequence of the variation of signal-to-background ratio across the range of phase space covered by our data. However, since is the dominant term, a fit was carried out with varied, with and constrained at the values of Eqs. (2) and (3). This fit gave
| (7) | |||||
This is consistent with Eq. (4) at the 1.7-standard-deviation level, and although our results cannot improve our knowledge of the form factors, they can at least demonstrate consistency with the values from the data.
The result for can be compared with the ChPT prediction of Bijnens et al. Bijnens et al. (1993) of . If the form factors of Eqs. (2), (3) and (4) are used in the theoretical calculation, the prediction becomes which is consistent with our result at the 1.5 standard-deviation level.
In summary, we have made a first observation of the decay and have determined the branching ratio to 25%. We find values for the form factors that are consistent with those for other decays but with less accuracy. The branching ratio is reasonably consistent with a ChPT prediction.
Acknowledgements.
We gratefully acknowledge the contributions to the success of this experiment by the staff and management of the AGS at the Brookhaven National Laboratory, and the technical staffs of the participating institutions. This work was supported in part by the U. S. Department of Energy, the National Science Foundations of the USA, Russia and Switzerland, and the Research Corporation.References
- (1) S. Weinberg, Physica A96, 327 (1979); J. Gasser and H. Leutwyler, Ann. Phys. 158, 142 (1984); Nucl. Phys. 250, 465 (1985).
- Eidelman et al. (2000) S. Eidelman et al., Phys. Lett. B 592, 1 (2004).
- Bardin et al. (1976) D. Bardin and E. Ivanov, Sov. J. Part. Nucl. 7, 286 (1976).
- Bijnens et al. (1993) J. Bijnens, G. Ecker and J. Gasser, Nucl. Phys. B396, 81 (1993).
- Adler et al. (2000) S. Adler et al., Phys. Rev. D58, 012003 (2003).
- Poblaguev et al. (2002) A. A. Poblaguev et al., Phys. Rev. Lett. 89, 061803 (2002).
- Appel et al. (2002) R. Appel et al., Nucl. Instrum. Methods Phys. Res., Sect. A 479, 349 (2002).
- Pislak et al. (2001) S. Pislak et al., Phys. Rev. Lett. 87, 221801 (2001).
- Pislak et al. (2003) S. Pislak et al., Phys. Rev. D67, 072004 (2003).
- Pislak et al. (2001) H. Ma et al., Phys. Rev. Lett. 84, 2580 (2000).
- (11) GEANT Detector description and simulation tool, CERN Program Library, Long Writeup W5013 (1994).