Measurement of production at Belle
Abstract
A high precision study of the process has been performed using a data sample of 89 fb-1 collected with the Belle detector at the KEKB collider. The cross section of production has been measured at two-photon center-of-mass (c.m.) energies between 2.025 and 4.0 GeV and in the c.m. angular range of . Production of is observed and the product of the two-photon width of the and its branching ratio to is determined.
PACS numbers: 12.38.Qk, 13.60.Rj, 14.40.Gx
![[Uncaptioned image]](/html/hep-ex/0503006/assets/x1.png)
| Belle Preprint 2005-5 |
| KEK Preprint 2004-101 |
, , , , , , , , , , , , , , , , , , , , , , , , , , , , , , , , , , , , , , , , , , , , , , , , , , , , , , , , , , , , , , , , , , , , , , , , , , , , , , , , , , , , , , , , , , , , , , , , , , , , , , , , , , , , , , , , , , , , , , , , , , , , , , , , , , , , , , , , , , , , , , , and
1 Introduction
Two-photon collisions provide a clean environment for baryon pair production and such events can be produced in great abundance at a high luminosity electron-positron collider. Accurate measurements of such processes, in particular , is important to test existing theoretical predictions.
General theories of hard exclusive processes in QCD [1, 2] (see also [3] for a review) predict that the differential cross section for at large energies and fixed c.m. angle () has the form
| (1) |
Here is the number of elementary constituents participating in the hard interaction, is a specific function expressed via definite integrals over hadron wave functions, is the square of the c.m. energy of the two-photon system, and is the square of the four-momentum transfer from a photon to hadron. The first estimate of the cross section for was obtained in the three-quark picture () [4, 5], using the proton wave function based on QCD sum rules [6]. Previous measurements [7, 8, 9, 10, 11] in the range between 2.5 and 3.0 GeV gave cross sections one order of magnitude larger than this expectation. To explain these experimental observations, various model-dependent approaches were suggested. For example, in the diquark model [12, 13, 14] the proton is considered to be a quark-diquark system. In this case and a diquark form factor is introduced, so that Eq. (1) becomes , where may depend on . Asymptotically, [12], and the behavior is recovered. These results exhibit better agreement with measurements of the absolute size of the cross section for - 3.0 GeV.
Other approaches have been developed recently. The handbag model [15] has been developed for large momentum transfers, and the calculations have been applied at medium energies ( GeV) with large uncertainty bands. In Ref. [16], the Veneziano model is applied in an unmodified form to the process, and fair agreement with data is obtained without adjustable parameters.
Recently, the measured energy range for has been extended to GeV and above [10, 11], but with very limited statistics for GeV. Furthermore, experiments give the cross section for the inverse process at - GeV [17]. To test QCD predictions, it is very important to improve the statistics at higher energies. Moreover, an accurate measurement with higher statistics for is crucial in the study of the interactions involved. This paper presents the Belle measurement of the cross section for between 2.025 to 4.0 GeV and , using a data sample corresponding to an integrated luminosity of 89 fb-1.
2 Experimental apparatus and event selection
Experimental data are recorded with the Belle detector [18] at KEKB [19], which is an asymmetric collider running at 10.58 GeV c.m. energy. In the laboratory frame, the direction of the positron beam is taken to define the direction. For the analyses in this paper, the following Belle subsystems are of importance: the central drift chamber (CDC), the aerogel Cherenkov counters (ACC), the time-of-flight scintillation counters (TOF) and the CsI electromagnetic calorimeter (ECL), all of which are located in a 1.5 T solenoidal magnetic field. The CDC measures the momenta of charged particles and provides particle identification information by precise () measurement, allowing separation of protons from other particles for momentum up to 1 GeV/. The TOF measures the time of flight of particles with a 0.1 ns timing resolution, which is powerful for separation for momentum up to 2 GeV/. The ECL detects photons and is used to reject electrons by measuring the deposited energy with a resolution of at 1 GeV (0.1 GeV). Using the number of photoelectrons observed, the ACC extends particle identification beyond that of the CDC and TOF and is effective in the suppression of highly relativistic and up to a momentum of 3.5 GeV/.
Through the process , exclusive pairs are produced in quasi-real two-photon collisions, where the scattered and are lost down the beam-pipe, and only the and can be detected. The axis thus approximates the beam direction in the c.m. frame. Candidate events are searched for in a data stream where the sum of the magnitudes of momentum of all charged tracks and the total ECL energy are restricted to 6 GeV/ and 6 GeV, respectively. Events are required to have exactly two tracks of opposite charge satisfying the following conditions in the laboratory frame: GeV/, cm and cm. Here is the transverse momentum and and are the radial and axial coordinates of the point of closest approach to the nominal collision point, respectively. Both tracks are required to hit the TOF counters. The invariant mass of the two tracks and the squared missing mass of the event, assuming the two tracks are massless, are required to be smaller than 4.5 GeV/ and larger than 2 GeV2/, respectively. A good transverse momentum balance in the c.m. frame is also required: GeV/, where and denote the transverse momenta of the two tracks in that frame, with respect to the beam-axis.
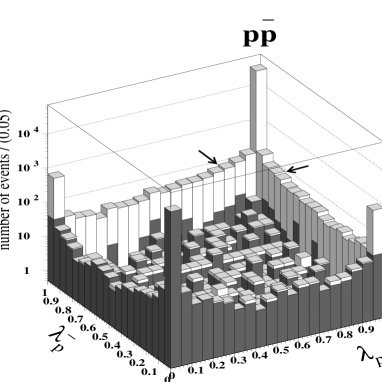
The selected events are dominated by , , and up to this stage. Events with are separated from the others by a particle identification (PID) algorithm, which is applied to each individual track under the following conditions: 1) the difference between the measured and the expected CDC is less than 4 times the resolution: ; 2) the ratio of the associated ECL energy to the momentum is less than 0.9, which is only applied to the positively charged track; 3) the number of the photoelectrons in ACC counters associated with the track is less than 4, and this condition removes a large part of high-momentum and ; 4) the likelihoods for each particle assignment are combined to determine the normalized likelihood, , which has to be larger than 0.8 (Fig. 1). In these likelihoods, is calculated using information from the CDC () and the TOF (time of flight ). Here , is the difference between the measured and the expected values for , and is the timing resolution. A combined use of CDC and TOF allows separation from other particles, in particular , for momentum up to 2 GeV/.


For - 4 GeV a total 36094 events survive all of the selection criteria. Their distribution in is shown in Fig. 2. A peak around 2.98 GeV can be identified as the resonance [20]. A much narrower peak at 3.08 - 3.10 GeV, corresponding to an excess of events relative to the continuum, could be attributed to backgrounds from radiative return to , and the enhancement is in agreement with expectations based on this assumption [21]. Fitting the data from 2.6 to 3.7 GeV with a smooth (exponential of a fifth-order polynomial) function for the continuum, a Breit-Wigner function for the and a Gaussian for the , a total yield of events is obtained. The statistical significance of the signal is , defined as , where and denote the maximum likelihoods of the fits with and without a signal component, respectively.
3 Monte Carlo simulation
Monte Carlo samples for the following channels have been generated: where is , , , , and . Hadron pair, lepton pair and events are generated by the codes TREPS [22], AAFH [23] and GGLU [24], respectively. Event generation is followed by a detector simulation based on GEANT3 [25] and a trigger simulation. The selection criteria described in Section 2 are then applied to these Monte Carlo events.
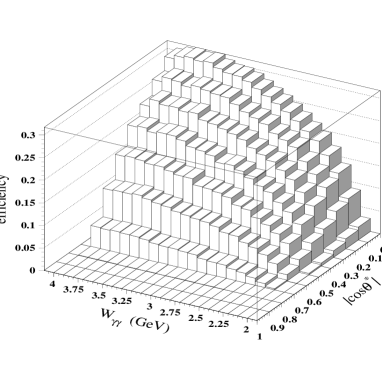
Because the acceptance depends on both and , the signal () efficiencies are determined for a number of two-dimensional bins of the two variables. Other channels are generated for the study of residual backgrounds. Similar to , the selection efficiencies for and are evaluated within each narrow bin. For the , and channels, realistic distributions are generated [23, 26, 27]. Events from those samples that survive the selection criteria are referred to as the expected residual backgrounds.
From Monte Carlo simulation, the overall efficiency of for ranges from at GeV to at GeV (Fig. 3).
4 Measurement of the cross sections for

Dividing into bins of 0.1, into bins of 25 MeV (for 2 - 3 GeV) and 100 MeV (for 3 - 4 GeV), the number of events selected from the data, , is determined for each of the two-dimensional bins. The efficiency is also evaluated from Monte Carlo simulation for each bin. The ratio of to is then converted to the differential cross section, according to the formula:
| (2) |
where is the fraction of residual background in the data, is the integrated luminosity and is the luminosity function. Here fb-1, with a systematic uncertainty of . The luminosity function , as a function of , is defined by
| (3) |
and is calculated by TREPS [22] using the equivalent photon approximation method [21]. For the calculation of the luminosity function, the effects from longitudinal photons are neglected. For simulation in TREPS, the maximum virtuality of each of the two photons, and , is limited to 1 GeV2. Moreover, a form factor term is introduced for the high- suppression effect, . The systematic uncertainty of the luminosity function is estimated by comparing the kinematic distributions of the two-photon system for the events generated with TREPS to those from a QED calculation that includes all order diagrams [23]. Within the range - 4 GeV agreement within - was reported [22, 28].
| (GeV) | (nb) | (GeV) | (nb) |
|---|---|---|---|
| 2.025 - 2.050 | 3.95 0.25 0.28 | 2.650 - 2.675 | 0.50 0.03 0.05 |
| 2.050 - 2.075 | 5.79 0.40 0.41 | 2.675 - 2.700 | 0.50 0.04 0.05 |
| 2.075 - 2.100 | 6.48 0.29 0.46 | 2.700 - 2.725 | 0.39 0.03 0.04 |
| 2.100 - 2.125 | 6.49 0.17 0.49 | 2.725 - 2.750 | 0.36 0.03 0.03 |
| 2.125 - 2.150 | 6.64 0.16 0.50 | 2.750 - 2.775 | 0.31 0.03 0.03 |
| 2.150 - 2.175 | 6.54 0.14 0.50 | 2.775 - 2.800 | 0.24 0.02 0.02 |
| 2.175 - 2.200 | 5.97 0.13 0.47 | 2.800 - 2.825 | 0.25 0.03 0.02 |
| 2.200 - 2.225 | 5.26 0.11 0.42 | 2.825 - 2.850 | 0.18 0.02 0.02 |
| 2.225 - 2.250 | 4.77 0.10 0.39 | 2.850 - 2.875 | 0.17 0.02 0.02 |
| 2.250 - 2.275 | 3.91 0.09 0.32 | 2.875 - 2.900 | 0.17 0.02 0.02 |
| 2.275 - 2.300 | 3.38 0.08 0.28 | 2.900 - 2.925 | 0.111 0.017 0.010 |
| 2.300 - 2.325 | 2.86 0.07 0.24 | 2.925 - 2.950 | 0.101 0.016 0.009 |
| 2.325 - 2.350 | 2.56 0.07 0.22 | 2.950 - 2.975 | 0.143 0.019 0.013 |
| 2.350 - 2.375 | 2.34 0.07 0.21 | 2.975 - 3.000 | 0.128 0.017 0.011 |
| 2.375 - 2.400 | 1.94 0.06 0.17 | 3.000 - 3.100 | 0.077 0.007 0.009 |
| 2.400 - 2.425 | 1.72 0.06 0.16 | 3.100 - 3.200 | 0.042 0.006 0.004 |
| 2.425 - 2.450 | 1.59 0.05 0.15 | 3.200 - 3.300 | 0.023 0.005 0.002 |
| 2.450 - 2.475 | 1.40 0.05 0.13 | 3.300 - 3.400 | 0.018 0.004 0.002 |
| 2.475 - 2.500 | 1.27 0.05 0.12 | 3.400 - 3.500 | 0.0092 0.0026 0.0009 |
| 2.500 - 2.525 | 1.21 0.05 0.11 | 3.500 - 3.600 | 0.0066 0.0021 0.0007 |
| 2.525 - 2.550 | 1.03 0.05 0.10 | 3.600 - 3.700 | 0.0090 0.0030 0.0010 |
| 2.550 - 2.575 | 0.88 0.05 0.08 | 3.700 - 3.800 | 0.0030 0.0019 0.0003 |
| 2.575 - 2.600 | 0.84 0.05 0.08 | 3.800 - 3.900 | 0.0045 0.0022 0.0005 |
| 2.600 - 2.625 | 0.74 0.04 0.07 | 3.900 - 4.000 | 0.0020 0.0012 0.0003 |
| 2.625 - 2.650 | 0.60 0.04 0.06 |
The cross section is obtained by a summation over : , with the restriction of , due to polar angular coverage limits of the TOF system. The results are summarized in Table 1 and Fig. 4. The contribution from is included in these results. For the two cross section measurements in the lowest bins (2.025 - 2.075 GeV), the efficiencies are extremely small at larger and data are only available up to and 0.5, respectively. We thus fit a second-order polynomial function of to these differential cross sections and arrive at a result by integrating the fit over up to 0.6. For comparison, we also show in Fig. 4 the results from previous measurements [8, 9, 10, 11].
Fig. 5 shows the angular dependence of the differential cross sections measured in 11 ranges of separately. The region (2.9 - 3.1 GeV) is skipped. For GeV, the differential cross sections decrease as increases; while for GeV, the opposite trend is observed. The transition occurs around GeV. Similar results are shown in Fig. 6 for three larger ranges of and are summarized in Table 2. For comparison, previous measurements [8, 10, 11] are also shown in Fig. 6. Further discussion is given in Section 6.


Based on studies from Monte Carlo and data, residual backgrounds due to particle misidentification and non-exclusive events are subtracted from the data. Corrections are based on multiplied by as shown in Eq.(2). Complete details are given in Section 5, and the systematic errors are shown in Table 3. All measured cross sections and differential cross sections shown in this paper have been corrected in this way. The excess caused by the background described at the end of Section 2 is estimated in each bin separately and subtracted from before the other corrections above. The systematic uncertainty due to this subtraction is for the measured cross section in the 3.0 - 3.1 GeV bin, taking into account the fluctuation of the estimated number of .


| (nb) | (nb) | (nb) | |
|---|---|---|---|
| 2.075 - 2.5 GeV | 2.5 - 3.0 GeV | 3 - 4 GeV | |
| 0.0 - 0.1 | 10.28 0.10 0.29 | 0.56 0.02 0.02 | 0.010 0.002 0.002 |
| 0.1 - 0.2 | 9.00 0.10 0.26 | 0.48 0.02 0.02 | 0.014 0.002 0.001 |
| 0.2 - 0.3 | 7.20 0.10 0.27 | 0.53 0.02 0.04 | 0.013 0.002 0.001 |
| 0.3 - 0.4 | 5.08 0.10 0.19 | 0.69 0.03 0.05 | 0.022 0.003 0.002 |
| 0.4 - 0.5 | 3.79 0.12 0.17 | 0.94 0.04 0.03 | 0.038 0.005 0.003 |
| 0.5 - 0.6 | 2.96 0.17 0.13 | 1.22 0.05 0.04 | 0.098 0.010 0.007 |
| Source | Systematic error (%) |
| Integrated luminosity | 1.4 |
| Luminosity function | 3 - 5 |
| Trigger efficiency | 5 |
| Particle identification efficiency | 1 - 6 |
| Monte Carlo statistics | 1 - 3 |
| Particle misidentification background subtraction | 0 - 1 |
| Non-exclusive () background subtraction | 2 - 12 |
| effect and residual non-exclusive backgrounds | 2 - 3 |
| subtraction ( - 3.1 GeV) | 8 |
| Possible backgrounds from radiative return | 1 |
| Total | 7 - 14 |
The total yield, , can be converted to the product of the two-photon width of and the branching fraction of : eV, using the luminosity function determined at the energy of the mass () and the efficiency from Monte Carlo. For the systematic error, effects from the uncertainties of the continuum background shape and the signal width are taken into account, in addition to all other sources listed in Table 3. The above result gives keV, where the last error comes from the branching fraction uncertainty [20]. Since observations of the in the channel are scarce and suffer from low statistics, current measurements for available in Ref. [20] are not very consistent with each other. Our result is the first measurement of in two-photon collisions and, together with the observation of the in collisions in its decay mode [29], will help to decrease the errors on both the two-photon width and branching fraction.
5 Corrections and major sources of systematic error
The accuracy of the Monte Carlo trigger efficiency has been checked from the two-track trigger, which requires at least two CDC tracks with an opening angle larger than , two or more TOF hits as well as the ECL timing signal, using experimental events passing the high energy trigger based on a 1 GeV threshold for an ECL total energy sum [18, 30]. The trigger efficiency depends on the average transverse momentum of the two tracks in the laboratory frame, , where the latter is the transverse momentum of in the c.m. frame. We determine the trigger efficiency as a function of , since each of the two-dimensional bins in and , where the number of events is measured, is associated with a value using the relation above. From the data, the trigger efficiency is at GeV/ and at GeV/. Corrections for the Monte Carlo trigger efficiency are implemented according to the data, with a systematic error within .
The accuracy of the PID efficiencies has been checked by comparing Monte Carlo estimates to those based on data. The efficiency associated with each of the four PID conditions (Section 2) is studied, using events passing all selection criteria except the condition in question. The overall PID efficiency is , and down to at , 3 and 4 GeV respectively, with a systematic error less than in the whole range. The fake rate is - for - 4 GeV, respectively.
Monte Carlo studies indicate that the PID requirements are very efficient in rejecting electrons and other relativistic particles, so that events from and do not survive the selection, leaving those from as the main residual background. From Monte Carlo simulation and the measured cross sections for [27, 31], the fraction of data that can be attributed to residual background, , is evaluated. Based on Monte Carlo studies, the dependence of on is negligible and , and at , 3.6 and 4.0 GeV, respectively. For GeV, is negligible. The values of have been checked in the data, using events passing all selection criteria except that on the normalized likelihood, . The number of signal events that would pass all selection criteria is estimated from the distribution of one of the two tracks, after requiring the other to satisfy . The values of inferred in this way are in good agreement with those above. The contribution from this source of background is subtracted from the data, using the expected from the Monte Carlo studies. The systematic uncertainty due to this source is or less in the whole range.
Possible non-exclusive backgrounds (), most of them from events, have been searched for in the data. Monte Carlo studies show that a high purity sample of such background can be derived from events with larger and smaller , the latter being the transverse momentum balance of the three particles. By comparing Monte Carlo and data distributions of these parameters we obtain the fraction of the data attributed to this background type, . We find that the dependence of on is negligible, and it ranges from to for from 2 to 4 GeV, respectively. Corrections are made using the obtained above, and in total of the selected data are subtracted. The systematic error from this source is 2 - for from 2 to 4 GeV, respectively. The fraction of the data attributed to events is also obtained as a function of . Before the correction, a comparison of the distribution between data and Monte Carlo exhibits a total difference of between the two samples, while it is reduced to less than for any range after the correction (Fig. 7). Since the residual excess in the distribution could be attributed to residual non-exclusive backgrounds and a broader nature of the signal distribution than the Monte Carlo, the systematic uncertainty due to other possible non-exclusive backgrounds is limited to after the correction.

6 Theoretical approaches


From the asymptotic QCD prediction of Eq.(1) and after integration over , the cross section for is proportional to for asymptotically large . All models based on this framework behave asymptotically as . For the diquark scenario, two curves are provided [14]: from the complete diquark model and from the same model with only helicity conserved amplitudes, where and are in opposite helicity states. The scale of the diquark predictions matches the data for - 3.0 GeV, but the deviation becomes larger as increases (Fig. 4). At higher energies, the data fall below the diquark predictions and exhibit a gradual approach to the three-quark model predictions [4]. At medium energies between 2.5 and 4.0 GeV, a steeper fall of the total cross section in is observed.
If we fit the data with a power law with floating (Fig. 8(a)), taking into account both statistical and systematic uncertainties as well as possible correlations between the latter, we obtain and in the range of - 2.9 GeV and 3.2 - 4.0 GeV, respectively (the charmonium region between 2.9 and 3.2 GeV is excluded). For completeness, we also show in Fig. 8(b) the results of the fits with fixed at 10 and 15. Although for both ranges a good fit to the data can be obtained at , a smaller power, , describes the data above 3.2 GeV reasonably well. This may imply that lower power terms become dominant at higher enegies, which is an indication for the transition to the asymptotic predictions.
The angular differential cross section in is another observable most important to the study of the nature of the interactions involved in the process . All existing models based on the constituent scattering picture [4, 5, 12, 13, 14, 15], as expected, predict an ascending trend, which is in agreement with the data for GeV. This is due to the factor contained in the hard scattering amplitudes. The same trend is obtained from naive QED [32] estimates: , in the massless limit. A simplified picture with diquarks would follow the naive QED expectation above [10, 12], if all quark masses are neglected and only scalar diquarks are considered. In Fig. 9 we plot the differential cross section normalized to that averaged within , and compare various predictions to the data. We observe that the data rise more sharply in at higher energy (see also Fig. 5). In comparison, all current models predict a flatter trend in .


The deviation of the leading term QCD calculations [4, 5] from the data at - 4.0 GeV implies that power corrections are still significant at these intermediate energies. It is not surprising since the very threshold of production corresponds to GeV. However, the diquark and handbag models [12, 13, 14, 15] were developed in order to describe the intermediate energy region at the price of introducing model form factors, etc.. The disagreement of the data at - 4.0 GeV with their predictions (see Fig. 4 and 9) obviously necessitates their improvement.
The descending trend of the differential cross section in observed at low energies ( GeV) cannot be understood within the hard scattering picture (Fig. 6(a)). In a recent study based on non-perturbative QCD sum rules [33], this trend was proposed as a general feature for hadron pair production from two-photon collisions. The behavior is very natural if low partial waves are involved. In Ref. [16] it was shown that even a simple model based on pole- and resonance-dynamics can reproduce this behavior.
7 Conclusion
Using the Belle detector at the high-luminosity KEKB collider, the cross sections for have been measured for from 2.025 to 4.0 GeV and , with systematic uncertainties ranging from 7% to 14%. These results represent a great improvement in precision compared to all previous measurements and allow more accurate tests of various theoretical models. We also observed the production of and determined the product of the two-photon width of the and its branching ratio to .
Fitting to a power law shows that the best fit value of decreases as energy increases, and cannot be rejected at energies above 3.2 GeV, implying the gradual transition to the expectation from asymptotic predictions. The ascending trend for the differential cross section in predicted by the hard scattering picture is in agreement with the data for GeV; however, the data rise more sharply in as increases. The descending trend in at lower energies GeV can be reproduced by non-perturbative approaches [16]. The descending trend of the differential cross section in changes to an ascending one with the increase of energy, which could be an indication for the transition from a soft resonance regime to the beginning of a hard regime. Existing models suggested for the intermediate energies [12, 13, 14, 15] can not provide satisfactory description of the observed energy and angular dependence in the studied energy range.
Acknowledgements
We thank the KEKB group for the excellent operation of the accelerator, the KEK cryogenics group for the efficient operation of the solenoid, and the KEK computer group and the NII for valuable computing and Super-SINET network support. We thank C. F. Berger, V. L. Chernyak, H.-N. Li and K. Odagiri for fruitful discussions. We acknowledge support from MEXT and JSPS (Japan); ARC and DEST (Australia); NSFC (contract No. 10175071, China); DST (India); the BK21 program of MOEHRD and the CHEP SRC program of KOSEF (Korea); KBN (contract No. 2P03B 01324, Poland); MIST (Russia); MESS (Slovenia); SNSF (Switzerland); NSC (under Grant No. NSC-92-2112-M-008-028) and MOE (Taiwan); and DOE (USA).
References
- [1] V. L. Chernyak and A. R. Zhitnitsky, JETP Lett. 25 (1977) 510 (Pis’ma v ZhETF 25 (1977) 544); V. L. Chernyak, V. G. Serbo, A. R. Zhitnitsky, JETP Lett. 26 (1977) 594 (Pis’ma v ZhETF 26 (1977) 760).
- [2] G. P. Lepage and S. J. Brodsky, Phys. Lett. B 87 (1979) 359; G. P. Lepage and S. J. Brodsky, Phys. Rev. D 22 (1980) 2157.
- [3] V. L. Chernyak and A. R. Zhitnitsky, Phys. Rept. 112 (1984) 173.
- [4] G. R. Farrar, E. Maina and F. Neri, Nucl. Phys. B 259 (1985) 702.
- [5] G. R. Farrar et al., Nucl. Phys. B 311 (1989) 585.
- [6] V. L. Chernyak and I. R. Zhitnitsky, Nucl. Phys. B 246 (1984) 52.
- [7] M. Althoff et al. (TASSO Collaboration), Phys. Lett. B 130 (1983) 449; W. Bartel et al. (JADE Collaboration), Phys. Lett. B 174 (1986) 350; H. Aihara et al. (TPC/Two-Gamma Collaboration), Phys. Rev. D 36 (1987) 3506; H. Albrecht et al. (ARGUS Collaboration), Z. Phys. C 42 (1989) 543.
- [8] M. Artuso et al. (CLEO Collaboration), Phys. Rev. D 50 (1994) 5484.
- [9] H. Hamasaki et al. (VENUS Collaboration), Phys. Lett. B 407 (1997) 185.
- [10] G. Abbiendi et al. (OPAL Collaboration), Eur. Phys. J. C 28 (2003) 45.
- [11] P. Achard et al. (L3 Collaboration), Phys. Lett. B 571 (2003) 11.
- [12] M. Anselmino, F. Caruso, P. Kroll and W. Schweiger, Int. J. Mod. Phys. A 4 (1989) 5213.
- [13] P. Kroll, Th. Pilsner, M. Schürmann and W. Schweiger, Phys. Lett. B 316 (1993) 546.
- [14] C. F. Berger and W. Schweiger, Eur. Phys. J. C 28 (2003) 249.
- [15] M. Diehl, P. Kroll and C. Vogt, Eur. Phys. J. C 26 (2003) 567.
- [16] K. Odagiri, Nucl. Phys. A 748 (2005) 168.
- [17] M. Ambrogiani et al. (Fermilab E835 Collaboration), Phys. Rev. D 62 (2000) 052002.
- [18] A. Abashian et al. (Belle Collaboration), Nucl. Instr. Meth. A 479 (2002) 117.
- [19] S. Kurokawa and E. Kikutani, Nucl. Instr. Meth. A 499 (2003) 1.
- [20] S. Eidelman et al. (Particle Data Group), Phys. Lett. B 592 (2004) 1.
- [21] V. M. Budnev, I. F. Ginzburg, G. V. Meledin and V. G. Serbo, Phys. Rep. 15 (1974) 182.
- [22] S. Uehara, KEK Report 96-11 (1996).
- [23] F. A. Berends, P. H. Daverveldt and R. Kleiss, Comp., Phys. Comm. 40 (1986) 285.
- [24] egpc v207, L3 program library, 1999, converted for the Belle configuration by S. Hou, 2000.
- [25] R. Brun et al., CERN DD/EE/84-1 (1987).
- [26] J. H. Boyer et al. (Mark II Collaboration), Phys. Rev. D 42 (1990) 1350; H. J. Behrend et al. (CELLO Collaboration), Z. Phys. C 56 (1992) 381; F. Yabuki et al. (VENUS Collaboration), Jour. Phys. Soc. Jpn. 64 (1995) 435.
- [27] H. Nakazawa et al. (Belle Collaboration), hep-ex/0412058.
- [28] K. Abe et al. (Belle Collaboration), Phys. Lett. B 540 (2002) 33.
- [29] C. Baglin et al., Phys. Lett. B 187 (1987) 191; T. A. Armstrong et al., Phys. Rev. D 52 (1995) 4839; M. Ambrogiani et al., Phys. Lett. B 566 (2003) 45.
- [30] B. G. Cheon et al., Nucl. Instr. Meth. A 494 (2002) 548.
- [31] K. Abe et al. (Belle Collaboration), Eur. Phys. J. C 32 (2004) 323.
- [32] F. M. Renard, Basics of electron positron collisions, Editions Frontières, 1981.
- [33] R.-C. Hsieh and H.-N. Li, Phys. Rev. D 70 (2004) 056002.