We present measurements of branching fractions and asymmetries of
several decays, with the decaying to
-even, -odd, and flavor eigenstates, that can constrain the angle
as well as the amplitude ratio , using
methods proposed by Gronau, London and Wyler or Atwood, Dunietz
and Sony[?]. We use data collected with the BABAR detector at
the PEP-II asymmetric energy collider at SLAC.
BABAR-PROC-04/154
SLAC-PUB-10865
UCHEP-04-06
November 2004
Department of Physics, University of Cincinnati
ML 11, Cincinnati, OH 45211, USA
Representing the BABAR Collaboration
1 Introduction
The unitarity of the Cabibbo-Kobayashi-Maskawa (CKM) matrix yields several
relationships for its components, such as
.
This describes the extent of violation in the Standard Model (SM) in
the meson system and
can be represented in the imaginary plane as a triangle, where the
angles (, and ) can be written in terms
of the couplings between quarks:
(1)
These angles can be extracted via asymmetries
measured in several decay modes of the meson. In particular
measurements can be made in modes which have
both and tree diagrams, which interfere.
The magnitude of the interference is determined by the
ratio of the two methods of decay. We report on
recent analyses which aim to measure the angle with data
collected with the BABAR detector[?]. All results are preliminary.
decaysaaaReference to the
charge-conjugate decays is implied
throughout the text, unless otherwise stated. can be used to constrain the
angle of the
Cabibbo-Kobayashi-Maskawa (CKM) matrix in a theoretically clean
way.
The small branching fractions of these modes demand high efficiency and
the exploitation of as many decay modes as possible.
Two quantities are used to discriminate between signal and background: the
beam-energy-substituted mass
and the energy difference ,
where the subscripts and refer to the initial
system and the candidate
respectively, the asterisk denotes the CM frame, and the kaon mass
hypothesis of the prompt track is used to calculate .
The continuum background is also suppressed using topological
variables which exploit the fact that events are isotropic while
continuum events are jet-like.
Whenever we need to separate and events,
we use measurements of the Cherenkov angle of the
prompt track[?]. At BABAR 3 standard deviation separations
between the kaon and pion hypotheses are
achieved for tracks up to 3.5 GeV/. is also useful for this
purpose, as it depends on the mass assigned to the
tracks forming the candidate.
Backgrounds are characterized using simulation and off-resonance data.
The best candidate in each event is selected using observables which are
not used as
inputs to the fits. Finally, unbinned
maximum likelihood fits are preformed to extract the signal yields.
The main systematic uncertainties are due to the characterization of the
probability density functions for signal and backgrounds and to the
particle identification, but many of these
(e.g the absolute efficiencies) cancel when measuring ratios
of branching fractions. For measurements of asymmetries, possible
detector charge asymmetries (all consistent with zero) are also taken into
account.
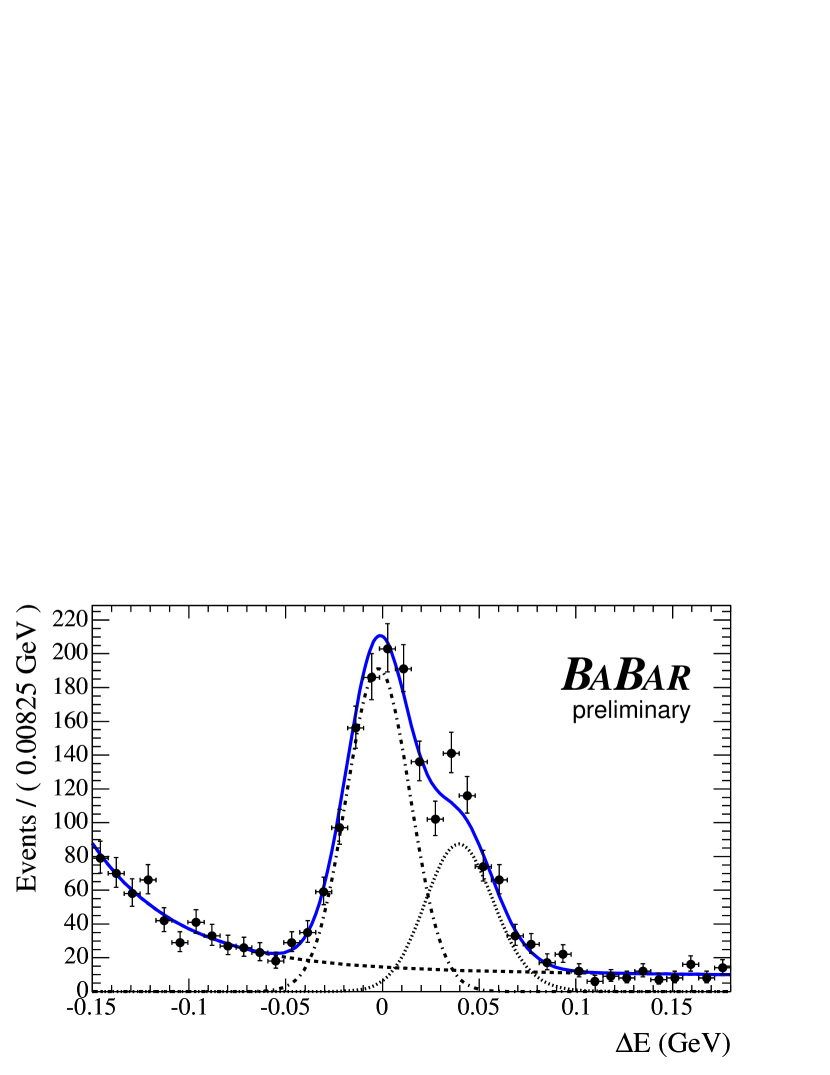
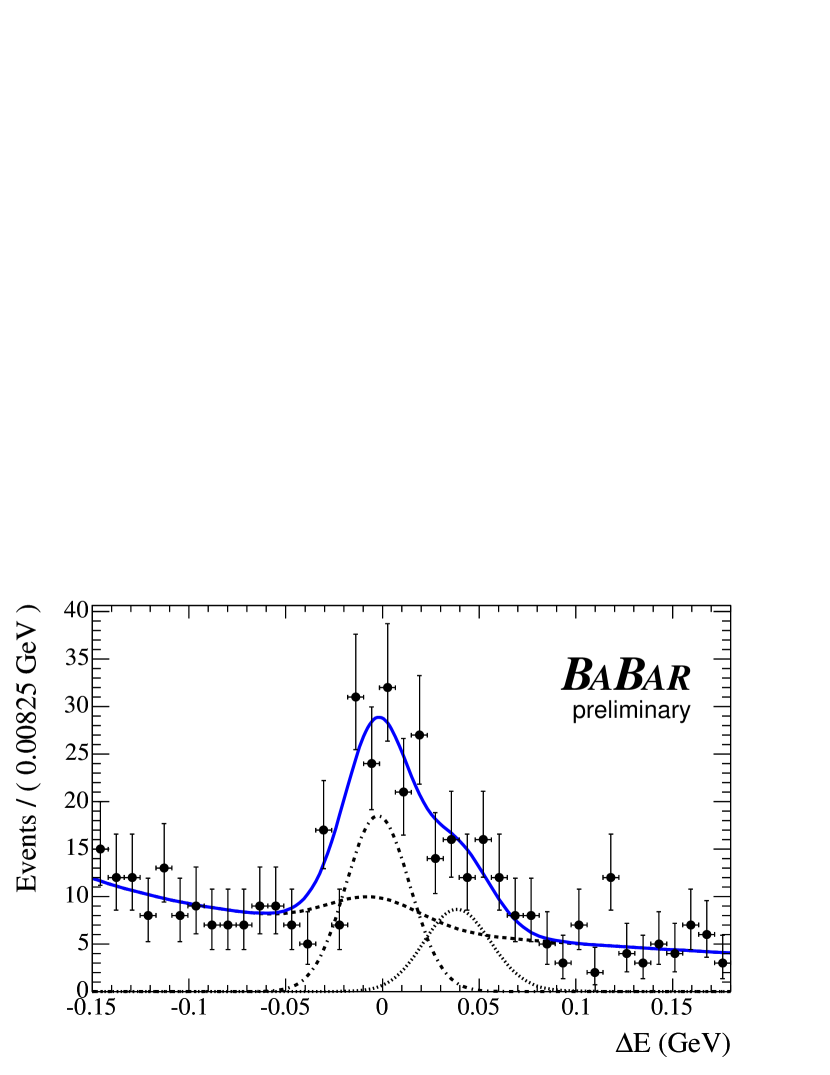
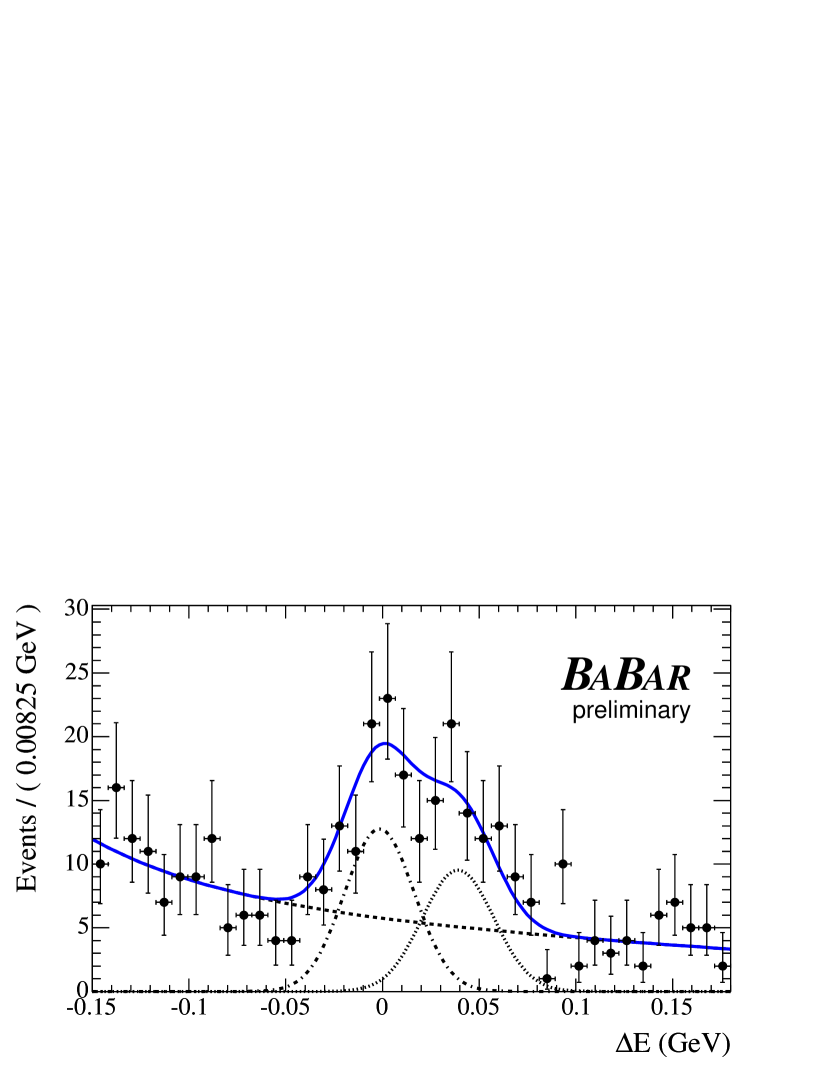
Figure 1: signal
after requiring that the prompt track be consistent with the
kaon hypothesis for the flavor (left), (center), and
(right) eigenstates. The
signal contribution on the right of each plot is shown as a
dotted line,
the signal on the left as a dashed-dotted line, and the background
as a dashed line. The total fit with all the contributions is
shown with a solid line.
Table 1: BABAR summary of results (GLW method). The first error is due to
statistical and the second to systematic uncertainties. The third, when
present, reflects possible interference effects in the final states with and resonances.
Observables
2 GLW related measurements
In the SM, for decays, we have:
(in the absence of
mixing) , where
(2)
is the ratio of the color suppressed and color
allowed amplitudes (), and is the
-conserving strong phase difference between these
amplitudes. Furthermore, defining the direct asymmetry
(3)
we have:
. Similar quantities and relationships exist for
the the modes and , where the
corresponding and might have different values from the ones
for the mode. The unknowns , , and
can be
constrained from the measurements of , , and
. The smaller
is, the more difficult is the measurement of with this
method.
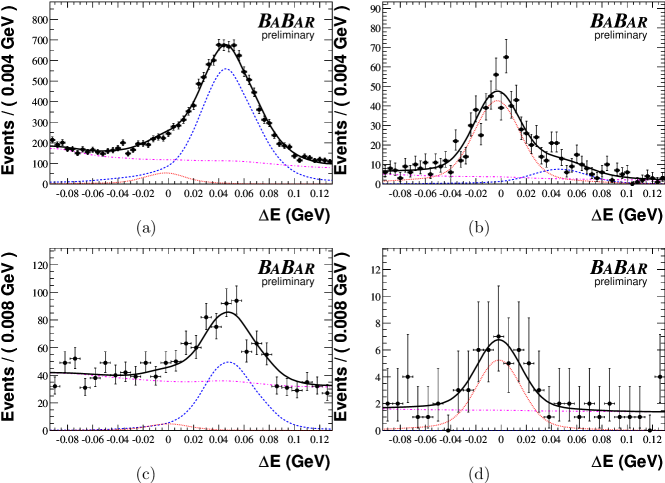
Figure 2: Distributions of in the sample, for
((a),
(b)) and ((c), (d)), before
((a), (c)) and after ((b), (d)) enhancing the component by requiring that the prompt track be consistent with the
kaon hypothesis and GeV/. The
signal contribution on the right of each
plot is shown as a
dashed line,
the signal on the left as a dotted line, and
the background
as a dashed-dotted line. The total fit with all the contributions is
shown with a thick solid line.
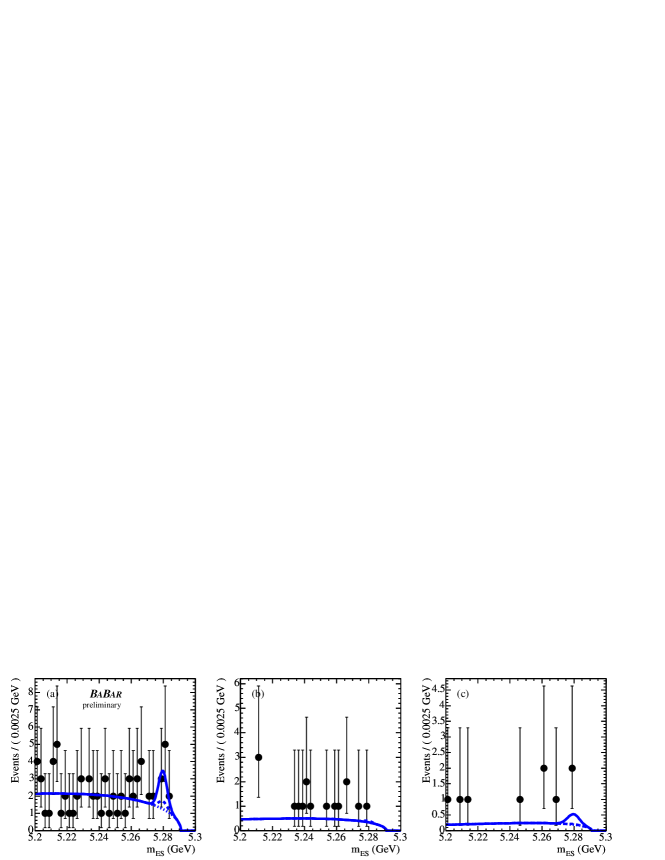
Figure 3: Signal for the three suppressed decay modes used for the ADS
method: (a) ( events), (b) ( events), and (c) ( events).
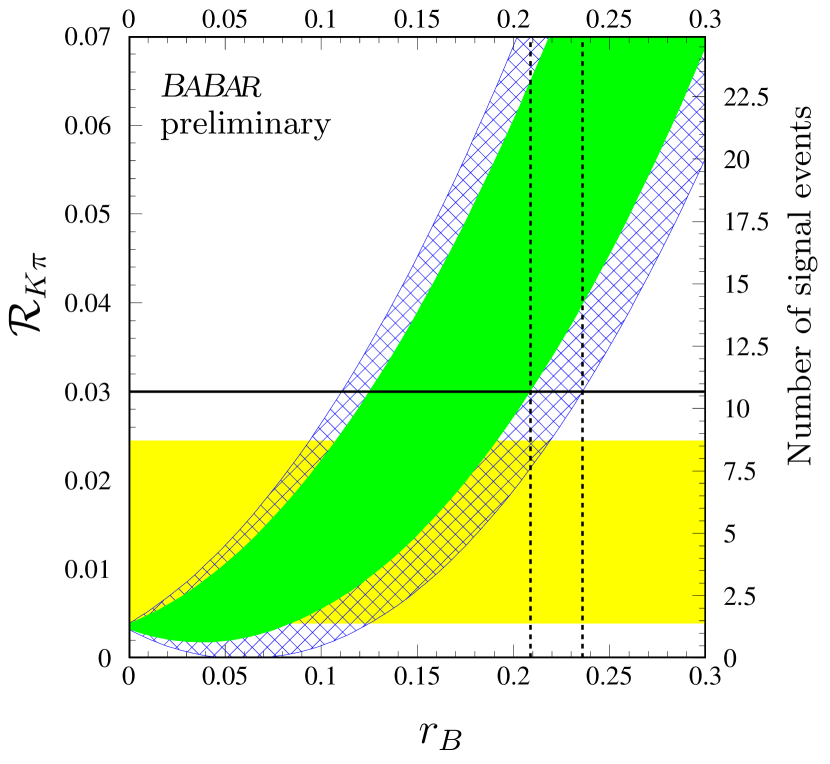
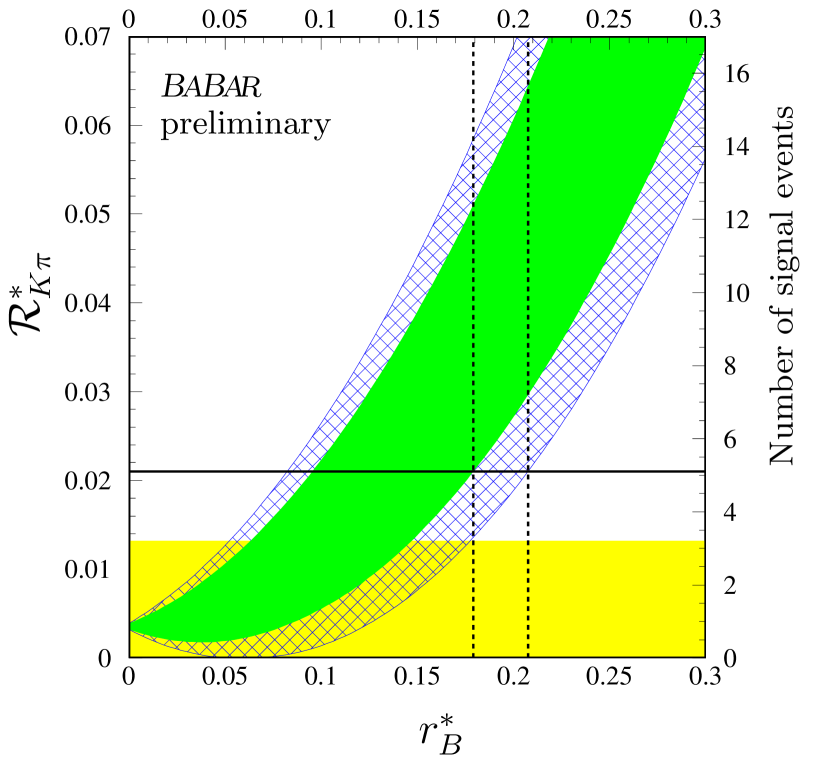
Figure 4: Dependence of on for the mode (left)
and for the mode (right) using
(hashed area) and the range
of from CKM fits ().
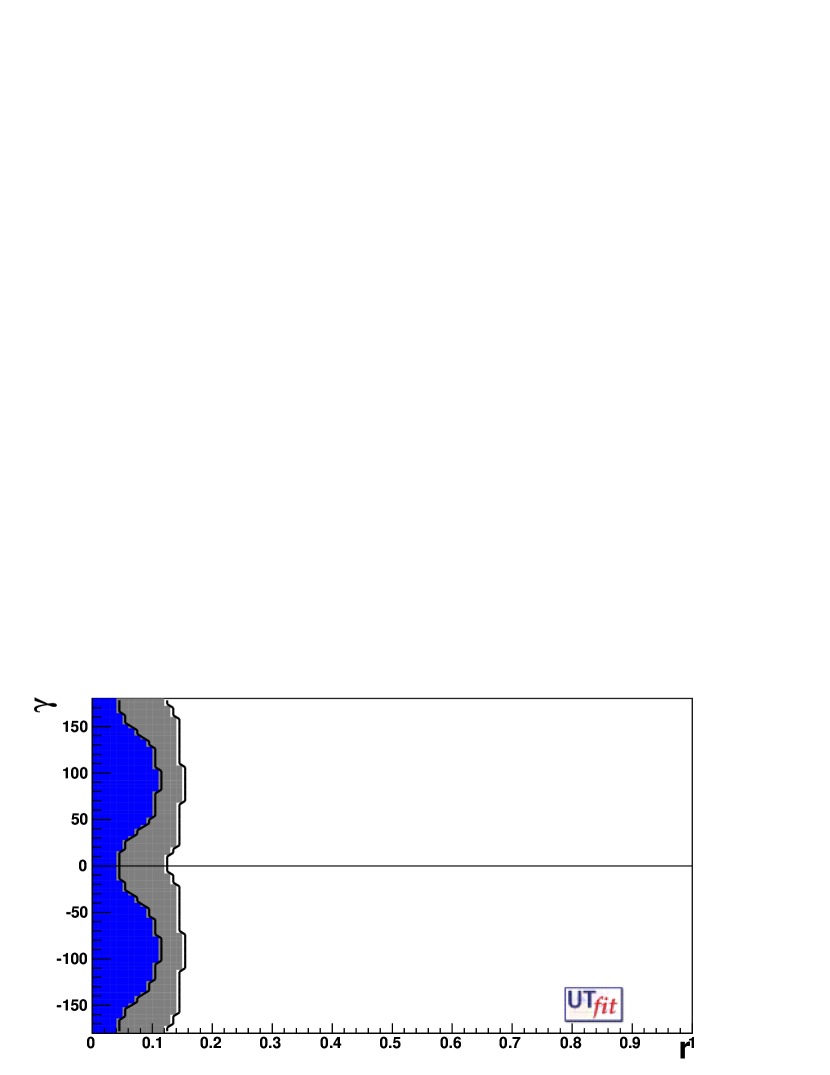
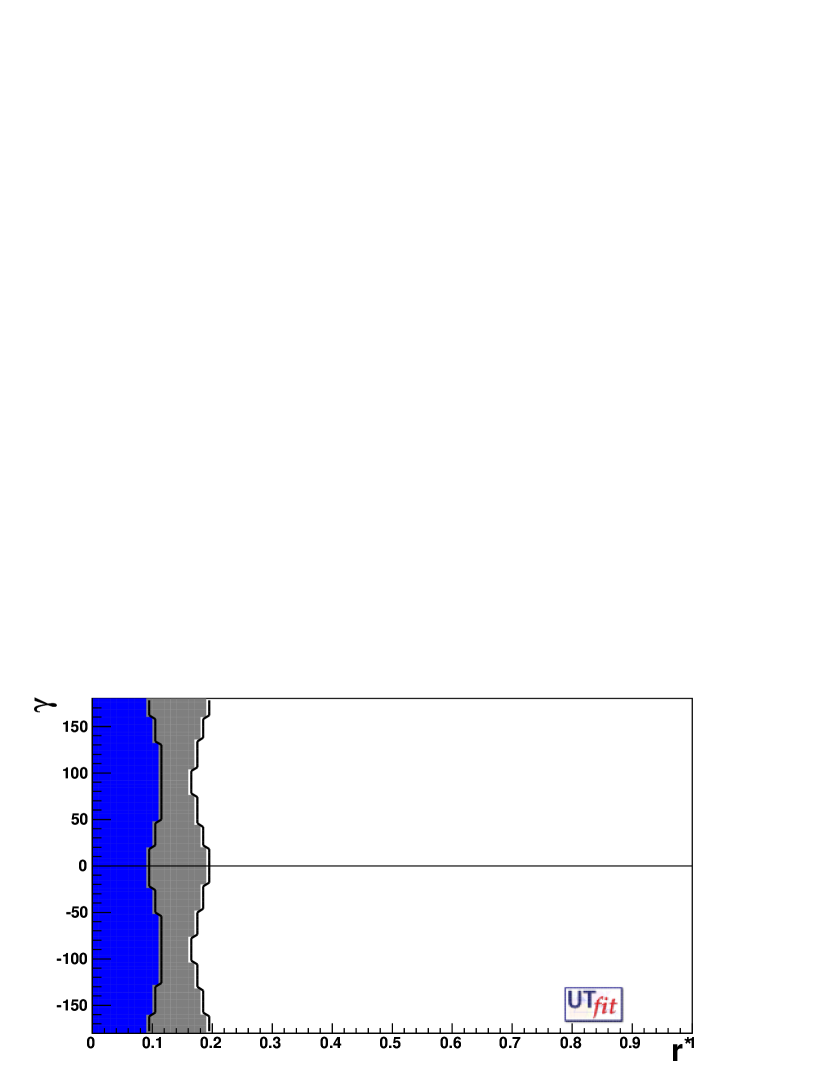
Figure 5: 68% and 95% C.L. as calculated by the UTfit group for for
the mode (left) and for the mode (right) vs. .
At BABAR we have studied the modes[?] in the
flavor (), ( and
), and () eigenstates.
Figure1 shows the signal
after requiring that the prompt track be consistent with the
kaon hypothesis for the flavor and eigenstates. In a dataset of
216 million pairs, we find 897 events in
the flavor, 93 in the , and 76 in the eigenstates.
The modes[?] have been studied, where the
decays into , with the reconstructed in the
even eigenstates and , and in the flavor
eigenstates , , and .
Figure 2 shows the distributions of for the
combined non- and modes before and after enhancing the component. This is accomplished by requiring that the prompt track be
consistent with the
kaon hypothesis and that GeV/. From a dataset of
123 million pairs, we select 360 events in the non- modes and 29 events in the modes. The projections of the fit results are also shown.
Finally we have studied the modes[?] in the
flavor (, , and ),
( and
), and (, , )
eigenstates, with .
After requiring that the prompt track be consistent with the
kaon hypothesis, from a dataset of 227 million
pairs, we find 498 events in flavor, 34 events in , and
15 events in eigenstates.
BABAR’s results for the modes used in the GLW method are reported in
Table 1.
3 ADS related measurements
We can also use the Atwood, Dunietz and Soni
method, which exploits the interference between the decay chain
combining the CKM and color
suppressed decay and the CKM allowed
decay and the one with a color allowed decay
and the doubly CKM suppressed decay. Using
this method we can measure:
(4)
where , is the sum of the strong phase difference of the s and
s decay amplitudes and is
the ratio of the suppressed decay to the dominant decay.
For this method we have studied both and decays.
Figure 3 shows the signal for the three suppressed decay modes.
BABAR’s results from a dataset of 227 million pairs
are consistent with no signal.
Using a Bayesian model, we measure: at 90%
C.L. for the mode, and at 90%
C.L. for the mode[?], as shown in
Figure 4, results which make a
measurement of quite difficult.
4 Constraints on and
The latest conference results by BABAR and Belle on the modes previoulsy
described have been combined by the UTfit[?] group, and some of
the results, derived using a Bayesian approach, are reported in
Figure 5.
5 Conclusions
Many decays and methods have been or are being investigated to
extract the angle , and tighter constraints on its value will be
found, once larger data sets become available from both BABAR and Belle,
though these measurements appear quite difficult given the latest BABAR measurements of a small for the and the modes.
References
[1] M. Gronau, D. Wyler, Phys. Lett. B 265, 172 (1991);
M. Gronau, D. London, Phys. Lett. B 253, 483 (1991); D. Atwood, I. Dunietz,
A. Soni, Phys. Rev. Lett. 78, 3257 (1997); A. Soffer, Phys. Rev. D 60, 054032 (1999);
M. Gronau, Phys. Rev. D 58, 037301 (1998); M. Gronau,
J.L. Rosner, Phys. Lett. B 439, 171 (1998).
[2] B. Aubert et al [BABAR Collaboration],
Nucl. Instr. and Methods A479, 1 (2002).
[3] B. Aubert et al [BABAR Collaboration],
hep-ex/0408082 (2004).
[4] B. Aubert et al [BABAR Collaboration],
hep-ex/0408060 (2004).
[5] B. Aubert et al [BABAR Collaboration],
hep-ex/0408069 (2004).
[6] B. Aubert et al [BABAR Collaboration],
hep-ex/0408028 (2004).