Kaons and Hyperons rare decays by the NA48 experiment at CERN
Massimo Lenti
INFN Sezione di Firenze,
Via G.Sansone 1, I-50019 Sesto F.(Firenze), ITALY
1 Introduction
Neutral Kaons were the place where CP violation was discovered for the first time [1]. Forty years after that discovery, kaons are still a privileged system where quarks coupling can be studied. The CKM quark mixing matrix [2] structure is usually addressed through the so-called unitarity triangle [3]. The very popular picture of this triangle based on measurements coming from B mesons decays and mixing can be replaced by an analogous one based on Kaons decays. It is evident that the possibility to compare the theoretical prediction in two independent system (the B system and the K system) with comparable experimental and theoretical uncertainties is very promising in the view of any signal of new physics or of the possible failure of the present Standard Model of particle interactions.
The Kaon version of the unitarity triangle is mainly identified by the branching ratio of the decay and of the (direct CP-violating) , which are theoretically very clean even if very demanding from an experimental point of view. The less theoretically clean and decays can be used in place of the decay, but the different physical contributions to the decay must be disentangled. The CP conserving part of can be calculated from the branching ratio of the decay measured by NA48 [4]:
| (1) |
| (2) |
The indirect CP violating part can be calculated using decays:
| (3) |
The and decays are very important to constrain the direct CP violation part of which is expected to be of the order of few .
The basis of the unitarity triangle can be fixed by the decay, but many information are neeeded to disentangle the short-range and long-range contributions. The and decays are very useful in this respect.
Hyperon decays are also very interesting for what concerns weak interactions. Hyperon decays can address parity violating modes like decay asymmetries, where some channels are very poorly known. The semileptonic hyperon decays can also measure the CKM parameter in an independent way from the most common method of using semileptonic Kaon decays.
2 The beam setup
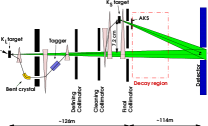
NA48 is an experiment dedicated to the precise study of CP violation in the neutral Kaon system: its beam setup is made of two neutral beams, one dominated by decays, the other by decays. A primary proton beam from the CERN Super Proton Syncroton impinges, with a nominal flux of 1.5 particles per spill, on a beryllium target (“Far Target”) 40 cm long and 2 mm wide; after a magnet sweeping sector and several stages of collimation, a neutral beam is formed. The exit face of the last collimator is located 126 m downstream of the target, at the entrance of the fiducial kaon decay region.
The primary protons which have not interacted in the target are deflected towards a bent silicon crystal: a small fraction of these protons is channeled by the crystal and form a secondary proton beam which is transported towards a second beryllium target (“Near Target”); after only 6 m of magnet sweeping and collimation another neutral beam is formed.
The two neutral beams can be present at the same time (“simultaneous beam runs”) or one per time (“Far Target run” or “Near Target run”) if only or decays have to be studied.
The secondary proton beam is usually at much lower intensity (about 3 particles per spill) with respect to the primary one. In some special runs (“High Intensity Near Target runs”) the primary proton beam is sent directly to the second target, removing the first target and by-passing the silicon crystal; the proton beam is attenuated and collimated to the desired intensity far upstream of the second target.
The neutral kaons beams can also be replaced by two opposite charged kaons beam.
3 The Detectors
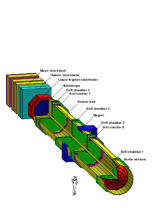
The detectors are located downstream of the kaon decay volume which lies inside a large, 90 m long, vacuum tank terminated by a 0.3% radiation lenghts thick Kevlar window; starting at the center of the Kevlar window, a 16 cm diameter vacuum beam pipe traverses all the detectors to let the neutral beam pass through vacuum.
Charged particles are detected using a high resolution magnetic spectrometer which consists of a dipole magnet with a horizontal transverse momentum kick of 265 MeV/c and a set of four drift chambers, two of them located upstream of the magnet and two downstream. The magnetic spectrometer is contained inside a tank filled with helium in order to reduce multiple scattering. The momentum resolution is:
| (4) |
A quasi-homogeneous liquid krypton (LKr) calorimeter is located downstream of the spectrometer. This detector has a 127 cm long projective tower structure which is made of copper-beryllium ribbons extending between the front and the back of the calorimeter with a 48 mrad accordion geometry. The 13212 readout cells each have a cross-section of 22 cm2. The energy resolution is:
| (5) |
Two planes of scintillators, segmented in horizontal and vertical slabs, form the charged hodoscope, located in between the magnetic spectrometer and the LKr calorimeter; it is used for triggering and measuring the time of charged particles.
Behind the LKr electromagnetic calorimeter, a 6.7 nuclear interaction lenght thick hadronic calorimeter is located, followed by a set of three planes of muon veto counters.
An electron (positron) is identified by a charged track, reconstructed by the magnetic spectrometer, whose extrapolation to the liquid krypton calorimeter matches a cluster in the LKr within 1.5 cm. The E/P ratio (ratio between the cluster energy measured by the LKr and the track momentum measured by the spectrometer) must be close to one; the usual cut is E/P0.9 (see Figure 3). An electron-positron couple is selected requiring that their separation at the first drift chamber is larger than 2 cm in order to reject photon conversions.
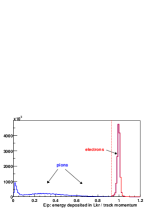
A proton or a charged pion is identified in a similar way as an electron but with an E/P0.8 cut. A muon is identified by a charged track whose extrapolation to the muon veto counters matches at least one hit in the first two muon counters, with a coincidence gate of 4 ns.
A photon is identified by a a cluster in the liquid krypton calorimeter not matched by any charged track extrapolation.
A is identified by its main decay , identifying two photons in the LKr. If the comes from a Kaon decay, the decay point is identified with the Kaon one, reconstructed from the energy or momentum and position at the LKr of all the particles coming from the Kaon decay, imposing the Kaon mass.
4 Data samples
Data were collected with the “simultaneous beams” setup in the years 1997, 1998, 1999 and 2001.
Data were collected in two days of 1999, in 40 days of 2000 and in all the 2002 run with the “High Intensity Near Target” setup. A 40 days long “Far Target run” was also used in 2000.
In the years 2003 and 2004 charged kaons beams were used.
5

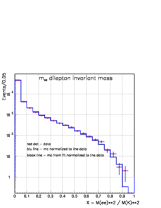
The decay was identified by the detection of one electron-positron couple and a photon. The main background was given by where the Dalitz decay is ; this background could mimic the signal if two photons were missed, but the invariant mass of the was anyway smaller than the Kaon mass. Figure 4, based on data collected in the year 1998, 1999 and 2001 shows the invariant mass versus the variable , defined as the squared ratio of the invariant mass and the Kaon mass.
Using data collected only in the year 1997, corresponding to about 7000 signal events, the branching ratio was measured [6]:
| (6) |
where the first error was statistical, the second systematic and the third one came from the uncertainty on the branching ratio of the normalization used ().
Using data collected in the year 1998, 1999 and 2001 with about 60000 candidates, it was possible to study the structure of the virtual photon producing the couple. In the BMS model [5] the form factor measures the relative strength of the intermediate pseudoscalar and vector contribution. The form factor can be fitted from the distribution of the signal events, as shown in Figure 5.
The result of the fit was:
| (7) |
6
The decays is clearly related to the decay, as also the second (virtual) photon gives rise to an couple. It was selected by identifying two electrons and two positrons and requiring that the four tracks must come from a common decay vertex. The main backgrounds were and , but they were suppressed by a 475 MeV/c 515 MeV/c2 cut to a level smaller than . Using data collected in the year 1998 and 1999, 200 signal events were selected, as can be seen in Figure 6.
The branching ratio was measured to be:
| (8) |
with the same meaning for the errors as in the previous section. The normalization channel used was .
7
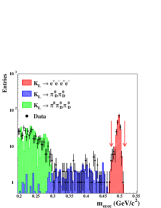
The year 2002 data taking period was dedicated to rare decay with a “High Intensity Near Target” beam setup; in this data sample, the decay was looked for. The decay with Dalitz decay of one of the s or with a photon conversion or with a decay could mimic the signal. A cut with GeV/c2 rejected most of the backgrounds. The was selected by a MeV/c2 cut. Finally a MeV/c2 cut was applied, where in this case the Kaon vertex was determined by the average position of closest distance of approach of the two charged tracks to the line joining the target and the Kaon center of gravity at the LKr.
were also present in the beam. The decay was a potentially dangerous background; Using 2001 data (rich in decays) rescaled to 2002 data, a background of 0.075 events was estimated in the signal region.
Another important possible source of backgrounds was given by the accidental overlap of fragments coming from two different decays. Tracks and clusters were required to be in time within 3 ns and the accidental background was estimated using a control region where the time between fragment was in a range between 3 and 50 ns.


Taking into account all the sources of backgrounds, events could mimic the signal. Using a blind analysis approach, 7 candidates were found, from which it was calculated [7]:
| (9) |
In order to extrapolate the result to any possible value, a vector interaction with a unit form factor was assumed:
| (10) |
where the last error came from the uncertainty on the theoretical model used for the extrapolation.
8
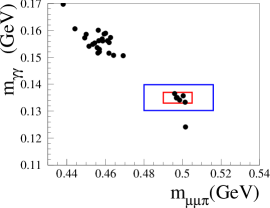
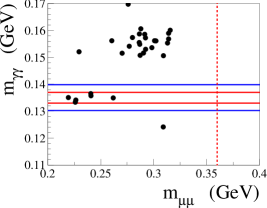
The is the same as the decay discussed in the previous section but with the replaced by two opposite charged muons. The was selected by a MeV/c2 cut and a MeV/c2 cut was applied (see the previous section for the definition of vertex position).
The main physical background was given by with pion decay in flight which was anyway suppressed by the total invariant mass cut. The decay was suppressed by its low branching ratio (of the order of ) and by the pion mass cut.
The background from accidental overlap of different decay was checked in a control region with time difference between 3 and 60 ns between fragments, extrapolated to the signal region of ns.
6 events were found with an expected background of events in the 2002 data sample, corresponding to [8]:
| (11) |
9 Comments on
Chiral perturbation theory can be used to predict the BR() as a function of two parameters, and [9]:
| (12) |
| (13) |
Within the VMD model [9], which predicts the value of can be derived: from and from .
The central value for the total branching ratio of (CP conserving part, indirect CP violating, direct CP violating and interference term) was estimated to be or , depending on the sign of the interference term. The central value of was estimated to be or for the same sign ambiguity.
10
Using the 1999 “High Intensity Near Target” run, 730 candidates were selected with . The selection was based on two opposite charged tracks with an invariant mass within 2.7 MeV/c2 from the mass and a cluster in the calorimeter with at least 15 GeV energy, separated by at least 25 cm from each track extrapolated point. The expected background was estimated from the sidebands in the invariant mass (see Figure 11) to be events and [10]
| (14) |
The decay asymmetry can be fitted from the distribution of the angle, defined in the rest frame as the angle between the incoming and the outgoing proton as can be seen in Figure 12.
The result of the fit was [10]:
| (15) |
11
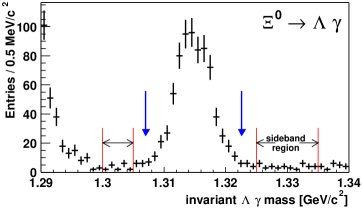
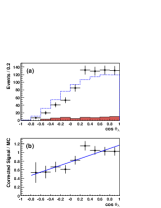
The decay was looked for in the 2002 “High Intensity Near Target” run. The was reconstructed by its decay. The beta decay was the only source of in the neutral beam of the 2002 NA48 beam setup. If an electron was found together with the , the beta decay was identified, as can be seen from Figure 13.
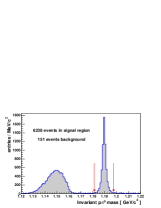
6238 signal candidates were found with a background of about 150 events estimated from the mass sidebands, from which the branching ratio was measured:
| (16) |
In order to derive the CKM element some assumption on the form factors must be used: we chose and [11] from which we calculated:
| (17) |
12 Conclusions
The NA48 experiment provided a lot of measurement concerning rare Kaon and Hyperon decays which allowed important constrains of the CKM paradigm in an indipendent way from the B meson system. Many other channels are presently under investigation by the NA48 collaboration and their measurement is foreseen in the near future.
It is a pleasure to thanks the organizers and the speakers of the HEP-MAD04 conference held in Antananarivo from 27th September to 3rd October 2004 for the friendly atmosphere and the fruitful discussions.
References
- [1] J. H. Christenson, J. W. Cronin, V. L. Fitch and R. Turlay, Phys. Rev. Lett. 13, 138 (1964).
- [2] M. Kobayashi and T. Maskawa, Prog. Theor. Phys. 49, 652 (1973).
- [3] L. Wolfenstein, Phys. Rev. Lett. 51, 1945 (1983).
- [4] A. Lai et al. [NA48 Collaboration], Phys. Lett. B 536, 229 (2002) [arXiv:hep-ex/0205010].
- [5] L. Bergstrom, E. Masso and P. Singer, Phys. Lett. B 131, 229 (1983).
- [6] V. Fanti et al. [NA48 Collaboration], Phys. Lett. B 458, 553 (1999).
- [7] J. R. Batley et al. [NA48/1 Collaboration], Phys. Lett. B 576, 43 (2003) [arXiv:hep-ex/0309075].
- [8] J. R. Batley et al. [NA48/1 Collaboration], Phys. Lett. B 599, 197 (2004) [arXiv:hep-ex/0409011].
- [9] G. D’Ambrosio, G. Ecker, G. Isidori and J. Portoles, JHEP 9808, 004 (1998) [arXiv:hep-ph/9808289].
- [10] A. Lai et al. [NA48 Collaboration], Phys. Lett. B 584, 251 (2004) [arXiv:hep-ex/0401027].
- [11] A. Alavi-Harati et al. [KTeV Collaboration], Phys. Rev. Lett. 87, 132001 (2001) [arXiv:hep-ex/0105016].