BABAR-PROC-04/138
SLAC-PUB-10874
Measurements of from , and modes.
Department of Physics
Liverpool University
Liverpool, United Kingdom
(from the BABAR Collaboration.)
Talk given at Flavor Physics and Violation, October 2004, Daegu, Korea.
B meson decays involving transitions are sensitive to the unitarity triangle angle (or ). The BABAR and Belle experiments have studied B-meson decays to , and final states. It is possible to combine these measurements to constrain with a precision of and a central value of approximately 100 degrees. These results are consistent with Standard Model expectations.
1 Introduction
This is a summary of the experimental constraint on obtained by the B-factories from B meson decays involving transitions. The final states of interest for these studies are , where . Violation (CPV) in the Standard Model of particle physics (SM) is described by a single complex phase. Interference between direct decay and decay after - mixing results in a time-dependent decay-rate asymmetry between and decaying to that is sensitive to the CKM [1] angle . The presence of loop (penguin) contributions introduces additional phases that can shift the experimentally measurable parameter away from the value of . In the presence of penguin contributions . The CKM angle is well known and consistent with SM predictions. Any constraint on constitutes a new test of the SM description of quark mixing and CPV in B-meson decays. Any significant deviation from SM expectation would be a clear indication of new physics. The SM prediction for are from [2] and [3].
There are two classes of measurement that the B-factories are pursuing, the main goal is to use SU(2) relations to relate different final states and limit in each of the modes , and . In some cases only weak constraints on are obtained when using SU(2) analysis and one must use a model dependent approach to obtain a significant result.
Experimental results are quoted with statistical errors preceding systematic errors unless otherwise stated.
2 Isospin analysis of
One can relate the amplitudes of decays to final states by noting that and [4]. These two relations correspond to triangles in a complex plane. In the absence of Electroweak penguin contributions, , i.e. the two triangles have a common base. The phase difference between and is related to . Thus, in order to measure one must measure the branching fractions ( ) and charge asymmetries () of decays to , , . The decays of and are more complicated. In the case of the former decays one has up to three isospin triangle analyses to perform to extract maximal information from data. The final state of decays to is not a eigenstate, which results in the need either for a pentagon isospin analysis [5] or a Dalitz Plot (DP) analysis [6].
3 Experimental techniques
Continuum () events are the dominant background. To discriminate signal from continuum one uses either a neural network, Fisher discriminant or likelihood ratio of event shape variables. Signal candidates () are identified kinematically using two variables, the difference between the CM energy of the candidate and , and the beam-energy substituted mass , where is the total CM energy. The momentum and four-momentum of the initial state are defined in the laboratory frame. The signal is extracted using an extended unbinned maximum likelihood fit.
To study the time-dependent asymmetry one needs to measure the proper time difference, , between the two decays in the event, and to determine the flavor tag of the other -meson (). The time difference between the decays of the two neutral mesons in the event (, ) is calculated from the measured separation between the and decay vertices. The vertex is determined from the two charged-pion tracks in its decay. The decay vertex is obtained by fitting the other tracks in the event.
The signal decay-rate distribution for = () is given by:
where is the mean lifetime, is the - mixing frequency. For decays to , = or and = or are the asymmetry parameters for the longitudinal and transversely polarized signal. The decay-rate distribution for decays to the final state is described below. The fitting function takes into account mistag dilution and is convoluted with the resolution function.
CPV is probed by studying the time-dependent decay-rate asymmetry , where () is the decay-rate for () tagged events. This asymmetry has the form 111Belle use a different convention with . In the case of charged B meson decays (and as there is no vertex information) one can study a time integrated charge asymmetry, , where () is the number of B () decays to the final state. A non-zero measurement of , or for any of the decays understudy would be a clear indication of violation.
4
The simplest decays to study in the pursuit of are . Both experiments have measurements for , and decays [9, 10]. These results are summarised in Table 1. All of these modes are now well established experimentally and so it is possible to perform an isospin analysis.
| mode | Expt | |||
|---|---|---|---|---|
| BABAR | ||||
| Belle |
| mode | Expt | ||
|---|---|---|---|
| BABAR | |||
| Belle | |||
| BABAR | |||
| Belle |
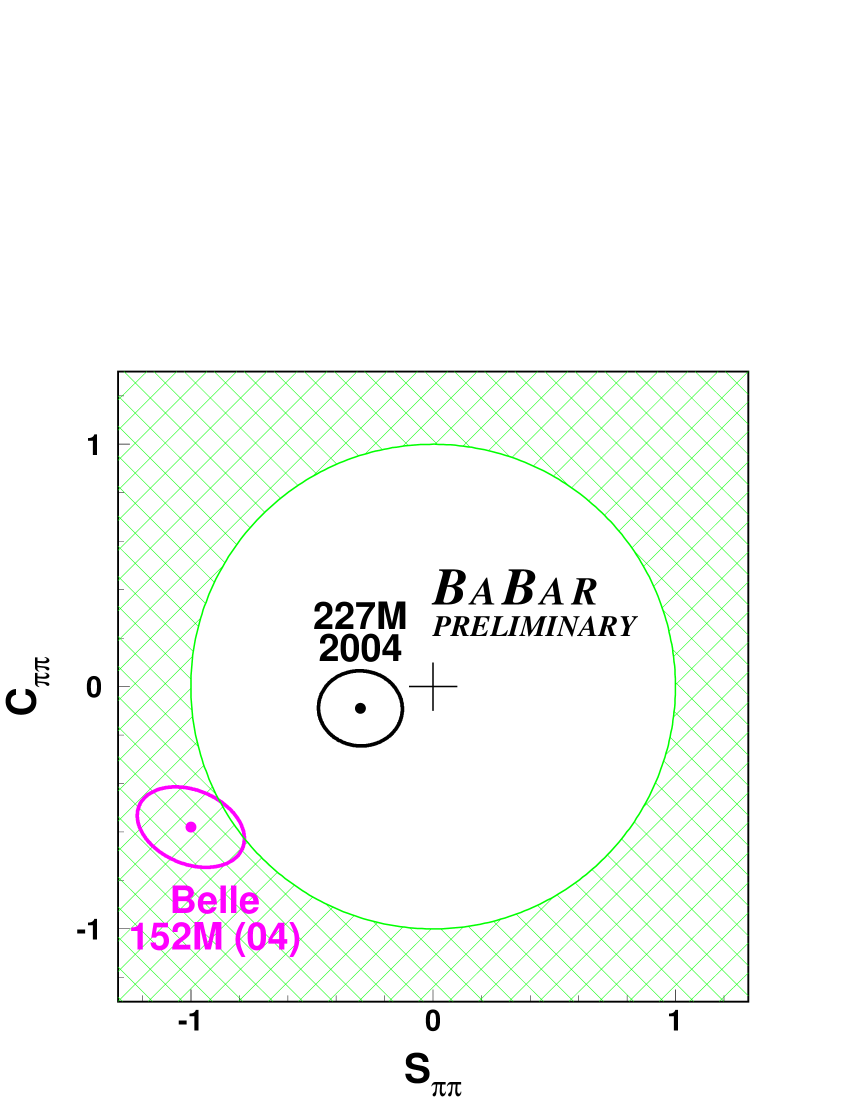
One should note that the Belle measurement of constitutes an observation of mixing-induced CPV in this decay at a level of , and evidence for direct CPV at a level of . This is the second observation of CPV in B-meson decays and is illustrated in Figure 1 . The BABAR data do not support this conclusion, and the discrepancy between the two experiments is more than . One must wait for a significant increase in statistics from both experiments to see if the results of the experiments become more compatible.
The isospin analysis is limited by the value of . Unfortunately this is neither large enough to provide sufficient statistics with the current data set to perform a precision measurement of , nor small enough to enable a strong bound on this quantity. BABAR have performed an isospin analysis resulting in (90% C.L.). It is possible to derive model dependent constraints on , as done by the Belle Collaboration; [10] (90% C.L.) using [11].
5
The decays of correspond to a spin zero particle decaying into two spin one, vector (V), particles. As a result, the analysis of decays to is complicated by the presence of three helicity states (). The state corresponds to longitudinal polarization and is -even, while neither the nor the state is an eigenstate of . The longitudinal polarization fraction is defined as the fraction of the helicity zero state in the decay. The angular distribution is
| (1) |
where is defined for each meson as the angle between the momentum in the rest frame and the flight direction of the in this frame. The angle between the -decay planes is integrated over to simplify the analysis. A full angular analysis of the decays is needed in order to separate the definite contributions; if however a single channel dominates the decay (which has been experimentally verified), this is not necessary [12]. The longitudinal polarization dominates this decay [13, 14]. Not all of the final states have been observed, however as is small, one can conservatively assume that is longitudinally dominated when performing an isospin analysis. There are assumptions in addition to SU(2) that are made when performing a isospin analysis. These are (i) neglect Electroweak penguin contributions [a few effect] (ii) ignore possible components in the decay [15]222This is a reasonable assumption given available statistics.. The measured branching fractions, , and for are summarised in Table 2.
| mode | ||||
|---|---|---|---|---|
| mode | Expt | |||
|---|---|---|---|---|
| BABAR | ||||
| Belle | ||||
| BABAR | (90% C.L.) | - | - |
Recent measurements of the branching fraction and upper limit for [16] indicate small penguin contributions in , as has been found in some calculations [17]. The decay mode has only been studied using a small fraction of the available data of the B-factories. As has been remarked, it is important to see this mode updated in the near future [2, 3].
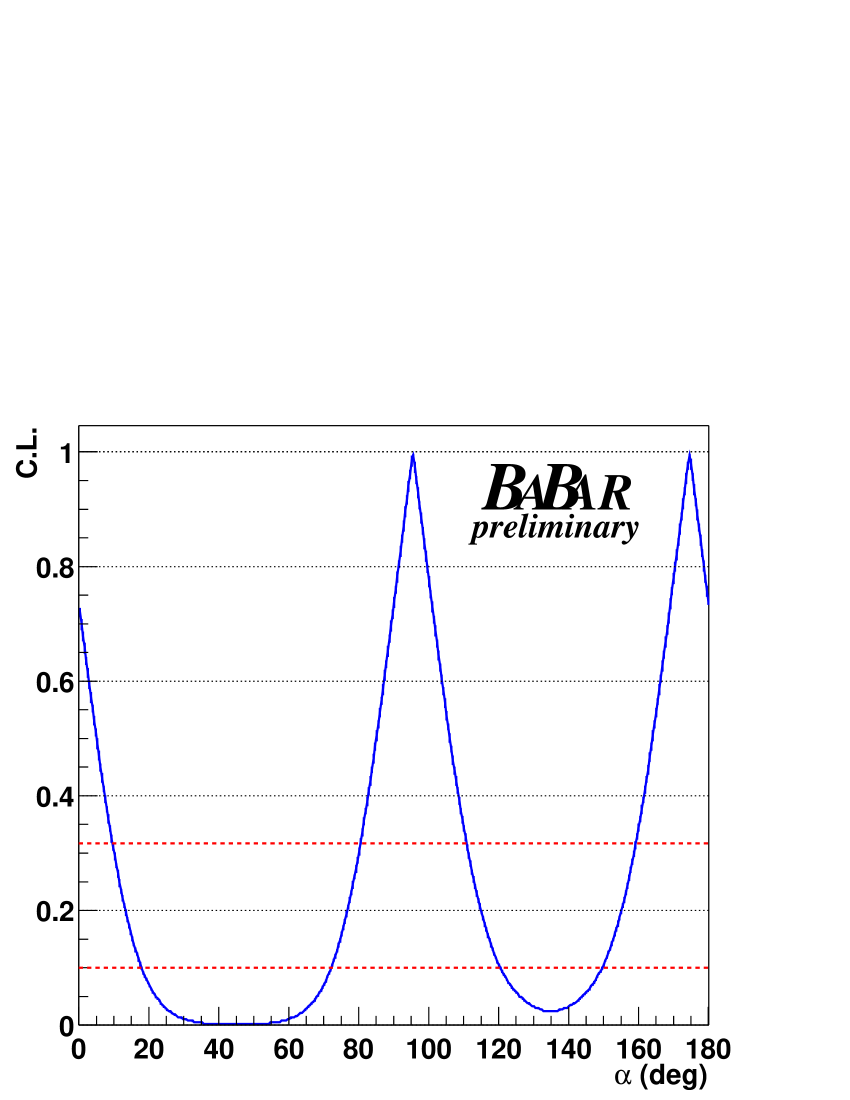
Given that penguin pollution is small, it is possible to perform an isospin analysis of the longitudinal polarisation of the decays, and use the results of BABAR’s time-dependent analysis of [14] to constrain . If one does this, using the afforementioned assumptions, one obtains . The ”penguin” error is determined primarily from the experimental knowledge of the and branching ratios. Figure 2 shows the confidence level plot of corresponding to the isospin analysis of the longitudinally polarized data.
6
The decays can be analysed in two different ways. The more straight forward approach is to cut away interference regions of the DP and analyse the regions in the vicinity of resonances. This is called the Quasi-2-body approach (Q2B) and it avoids the need to understand the interference regions. The drawback of the Q2B method is that one looses statistical power by cutting on the DP. A corollory of this is that one requires more statistics than the B-factories currently have in order to get a significant constraint from the pentagon isospin analysis. The alternative is to perform an analysis of the DP, accounting for the interference between intersecting resonance bands and other resonant structure. Both of these approaches have been studied by BABAR [18]. Belle has performed a Q2B analysis of [19], and the first time-dependent DP analysis has been performed by BABAR [20].
In the Q2B approach, one fits a time-dependence of
where there are three additional parameters, a charged asymmetry, , between decays to and final states, and two dilution parameters; and . The details of the DP analysis can be found in [20], where one varies a larger number of parameters in the nominal fit, and converts these to the same observables as the Q2B approach. Table 3 summarises the experimental constraints on (DP analysis from BABAR and Q2B analysis from Belle).
| mode | Expt | |||
|---|---|---|---|---|
| BABAR | ||||
| Belle |
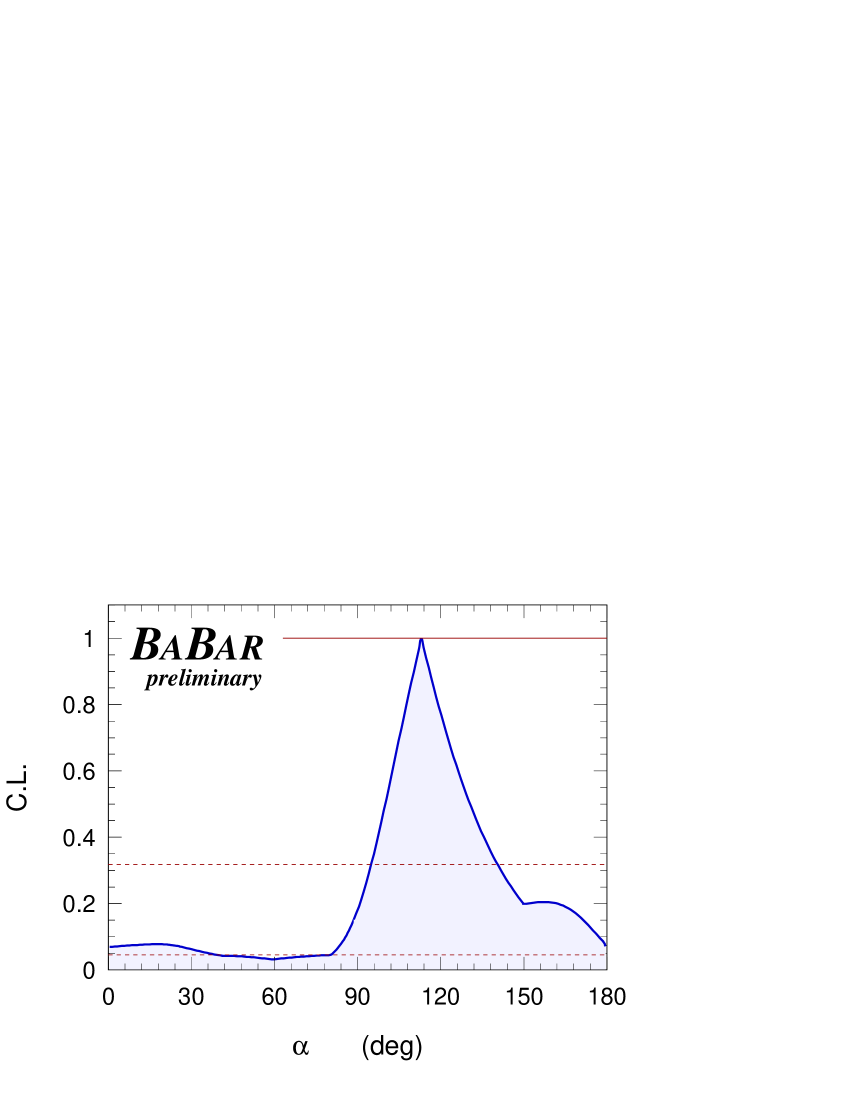
Using SU(2) with BABAR’s DP result, one obtains the following constraint; (Figure 3 shows the corresponding confidence level plot for ). This result is self consistent as the strong phase differences and amplitudes are determined solely from the structure of the DP. The unique aspect of this result is that there is only a single solution between 0 and , thus a two fold ambiguity in the plane. As a result this measurement is an important constraint on alpha, ancillary to that of the BABAR analysis.
It is possible to derive a model dependent constraint on alpha from these data. As shown by Gronau and Zupan [21]. One can make several assumptions, including (i) the relative strong phase differences between tree level contributions for and being less than (ii) SU(3) being exact for penguin amplitudes (iii) neglecting Electroweak penguins (iv) neglecting annihilation and exchange diagrams to derive a constraint on . SU(3) breaking effects are estimated in this model using CLEO, BABAR and Belle data. When doing this Belle obtain . Gronau and Zupan compute the corresponding result for the BABAR analysis as . There are other models proposed in the literature, for example [22].
7 Comparison with the Standard Model
The indirect measurements of from the SM are [2] and [3] from the UT Fit and CKM Fitter groups, respectively. Direct measurements from the B-factories are in good agreement with these predictions, where the average of from decays, using isospin, is known to . The precision of this result is dominated by , with an important contribution from , where the latter reduces this constraint from four-fold to a two-fold ambiguity in the plane. In the next few years should be known to and the B-factories will be able to cleanly test the closure of unitarity triangle with precision for the first time. A significant isospin analysis result from is still some way off. Similarly, the model dependent calculations of are in agreement with the SM.
8 Summary
In the past year the B-factories have made significant progress towards a precision measurement of the unitarity triangle angle , only relying on SU(2) symmetry. The dominant constraint comes from decays [14], which has a four-fold ambiguity in the plane. The BABAR analysis of decays represents the first time-dependent analysis. Inclusion of the interference regions of the DP enables one to measure strong phase differences between amplitudes contributing to the final state; In turn this enables one to derive a self consistent constraint of with a two fold ambiguity in the plane. One can also employ models to further constrain as has been discussed herein.
8.1 Bibliography
Acknowledgments
The author wishes to thank M. Bona, A. Hcker, M. Perini and J. Zupan for illuminating discussions in the preparation of this work. This work is supported in part by the U.S. Department of Energy under contract number DE-AC02-76SF00515 and by PPARC, UK.
References
- [1] N. Cabibbo, Phys. Rev. Lett. 10, 531 (1963); M. Kobayashi and T. Maskawa, Prog. Th. Phys. 49, 652 (1973).
- [2] M. Bona et al., hep-ph/0408079.
- [3] J. Charles et al., hep-ph/0406184.
- [4] M. Gronau, D. London, Phys. Rev. Lett. 65, 3381 (1990).
- [5] H. Lipkin et al., Phys. Rev. D 44, 1454 (1991).
- [6] A. Snider and H. Quinn, Phys. Rev. D 48, 2139 (1993).
- [7] e.g. see p73 of Ref [3]
- [8] S. Gardner, hep-ph/9906269, also see M. Ciuchini’s talk at the CKM Angles workshop http://www.slac.stanford.edu/BFROOT/www/Organization/CollabMtgs/2003/ workshops/ckm2003/agenda-day2-v1.html.
- [9] BABAR hep-ex/0408081, hep-ex/0408089, Phys. Rev. Lett. 89 281802 (2001).
- [10] Belle Collaboration, hep-ex/0408101, Phys. Rev. Lett. 93 021601 (2004), Phys. Rev. D 69 111102 (2004).
- [11] M. Gronau and J. Rosner Phys. Rev. D 65 093012 (2002).
- [12] I. Dunietz et al., Phys. Rev. D 43, 2193 (1991).
- [13] G. Kramer and W. Palmer, Phys. Rev. D 45, 193 (1992); D. Ebert et al., Phys. Rev. D 56, 312 (1997); A. Ali et al., Phys. Rev. D 58, 094009 (1998); Y.-H. Chen et al., Phys. Rev. D 60, 094014 (1999).
- [14] BABAR Collaboration, B. Aubert et al., hep-ex/0404029.
- [15] A. Falk et al., Phys. Rev. D 69, 011502 (2004).
- [16] BABAR Collaboration, B. Aubert et al., Phys. Rev. Lett. 91, 171802 (2003). Belle Collaboration, J. Zhang et al., Phys. Rev. Lett. 91, 221801 (2003).
- [17] R. Aleksan et al., Phys. Lett. B 356, 95 (1995).
- [18] BABAR Collaboration, B. Aubert et al., Phys. Rev. Lett. 91 201802 (2003).
- [19] Belle Collaboration, C. C. Wang et al., hep-ex/0408003.
- [20] BABAR Collaboration, B. Aubert et al., hep-ex/0408099.
- [21] M. Gronau and J. Zupan, hep-ph/0407002.
- [22] M. Gronau et al., hep-ph/0410170.