April 15, 2003 BNL-71228-2003-IR
The AGS-Based Super Neutrino Beam Facility
The BNL Neutrino Working Group Report-II
Coordinators: M. Diwan, W. Marciano, W. Weng
Editor: D. Raparia
![[Uncaptioned image]](/html/hep-ex/0305105/assets/x1.png)
![[Uncaptioned image]](/html/hep-ex/0305105/assets/x2.png)
Brookhaven National Laboratory
April 15, 2003
April 15, 2003 BNL-71228-2003-IR
AGS Super Neutrino Beam Facility
Accelerator and Target System Design
(Neutrino Working Group Report-II)
Coordinators: M. Diwan, W. Marciano, W. T. Weng
Editor: D. Raparia
Contributors and Participants
J. Alessi, D. Barton, D. Beavis, S. Bellavia, J. Brennan, B. Bromley, M. C. Chen, M. Diwan,
R. Fernow, J. Gallardo, R. Hahn, S.Kahn, H. Kirk, Y. Y. Lee, D. Lowenstein, H. Ludewig,
W. Marciano, I. Marneris, R. Palmer, Z. Parsa, A. Pendzick, C. Pearson, D. Raparia,
T. Roser, A. Ruggiero, J. Sandberg, N. P. Samios, C. Scarlet, N. Simos, N. Tsoupas,
J. Tuozzolo, J. Beebe-Wang, W. T. Weng, B. Viren, P. Yamin, M. Yeh, Wu Zhang
Brookhaven National Laboratory, P. O. Box 5000, Upton, NY 11973-5000
W. Frati, J. R.Klein, K. Lande, A. K. Mann, R. Van Berg, and P. Wildenhain
University of Pennsylvania Philadelphia, PA 19104-6396
R. Corey
South Dakota School of Mines and Technology, Rapid City, S. D. 57701
D. B. Cline, K. Lee, B. Lisowski, P. F. Smith
Department of Physics and Astronomy, University of California, Los Angeles, CA 90095
I. Mocioiu, R. Shrock
C. N. Yang Institute for Theoretical Physics State University of New York,
Stony Brook, NY 11974
C. Lu and K. T. McDonald
Joseph Henrry Laboratories, Princeton University, Princeton, NJ 08544, USA
R. Potenza
Instituto Nazionale di Fisica Nucleare,Dipartimento de Fisica e Astronomia,
Universita di Catania, 64, Via s. Sofia, I-95123 Catania, Italy
G. Evangelakis
Physics Department, University of Ioannina, Greece
This document contains figures in color. The figures should be viewed in color.
This work was performed under the auspices of the U. S. Department of Energy, Contract No. DE-AC02-98CH10886.
Preface
This document describes the design of the accelerator and target systems for the AGS Super Neutrino Beam Facility. Under the direction of the Associate Laboratory Director Tom Kirk, BNL has established a Neutrino Working Group to explore the scientific case and facility requirements for a very long baseline neutrino experiment. Results of a study of the physics merit and detector performance was published in BNL-69395 in October 2002[1][2], where it was shown that a wide-band neutrino beam generated by a 1 MW proton beam from the AGS, coupled with a half megaton water Cerenkov detector located deep underground in the former Homestake mine in South Dakota would be able to measure the complete set of neutrino oscillation parameters:
-
•
precise determination of the oscillation parameters m and sin22
-
•
detection of the oscillation of and measurement of sin2 2
-
•
measurement of m sin2 in a appearance mode, independent of the value of
-
•
verification of matter enhancement and the sign of m
-
•
determination of the CP-violation parameter in the neutrino sector
This report details the performance requirements and conceptual design of the accelerator and the target systems for the production of a neutrino beam by a 1.0 MW proton beam from the AGS. The major components of this facility include a new 1.2 GeV superconducting linac, ramping the AGS at 2.5 Hz, and the new target station for 1.0 MW beam. It also calls for moderate increase, about 30%, of the AGS intensity per pulse. Special care is taken to account for all sources of proton beam loss plus shielding and collimation of stray beam halo particles to ensure equipment reliability and personal safety. A preliminary cost estimate and schedule for the accelerator upgrade and target system are also included.
1 Introduction and Accelerator Performance
After more than 40 years of operation, the AGS is still at the heart of the Brookhaven hadron accelerator complex. This system of accelerators presently comprises a 200 MeV linac for the pre-acceleration of high intensity and polarized protons, two Tandem Van der Graaffs for the pre-acceleration of heavy ion beams, a versatile Booster that allows for efficient injection of all three types of beams into the AGS and, most recently, the two RHIC collider rings that produce high luminosity heavy ion and polarized proton collisions. For several years now, the AGS has held the world intensity record with more than protons accelerated in a single pulse [3].
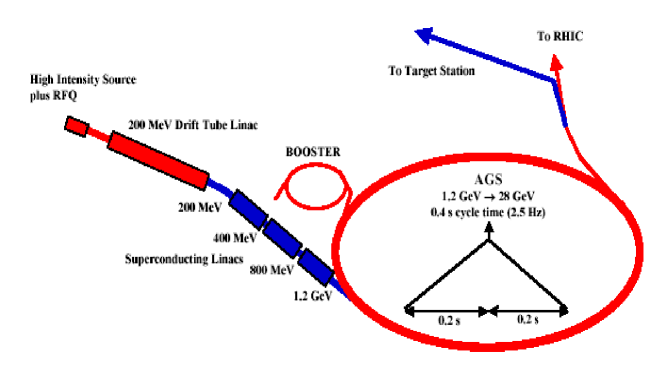
The requirements for the proton beam for the super neutrino beam are summarized in Table 1.1 and a layout of the upgraded AGS is shown in Figure 1.1. Since the present number of protons per fill is already close to the required number, the upgrade focuses on increasing the repetition rate and reducing beam losses (to avoid excessive shielding requirements and to maintain activation of the machine components at workable level). It is also important to preserve all the present capabilities of the AGS, in particular its role as injector to RHIC.
| Present | Upgrade | |
| Average Beam Power | 0.14 MW | 1.0 MW |
| Beam Energy | 24 GeV | 28 GeV |
| Average Beam Current | 6 A | 36 A |
| Cycle Time | 2 sec | 400 ms |
| Number of Protons per Fill | ||
| Number of Bunches per Fill | 12 | 23 |
| Protons per Bunch | ||
| Number of Injected Turns | 190 | 240 |
| Repetition Rate | 0.5 Hz | 2.5 Hz |
| Pulse Length | 0.35 ms | 0.72 ms |
| Chopping Rate | 0.75 | 0.75 |
| Linac Average/Peak Current | 26/35 mA | 21/28 mA |
The AGS Booster was built not only to allow the injection of any species of heavy ion into the AGS but to allow a fourfold increase of the AGS intensity. It is one-quarter the circumference of the AGS with the same aperture. However, the accumulation of four Booster loads in the AGS takes about 0.6 sec, and is therefore not well suited for high average beam power operation. To minimize the injection time to about 1 msec, a 1.2 GeV linac will be used instead. This linac is consists the existing warm linac of 200 MeV and a new superconducting linac of 1.0 GeV. The multi-turn H- injection from a source of 30 mA and 720 sec pulse width is sufficient to accumulate 9 x 10¹³ particle per pulse in the AGS[4].
The minimum ramp time of the AGS to full energy is presently 0.5 s; this must be upgraded to 0.2 s to reach the required repetition rate of 2.5 Hz. The required upgrade of the AGS power supply, The RF system, and other rate dependent accelerator issues will be discussed in Chapter 3.
The design of the target/horn configuration is shown in Figure 1.2 The material selected for the proton target is a Carbon-Carbon composite. It is a 3-dimensional woven material that exhibits extremely low thermal expansion for temperatures up to 10000C; for higher temperatures it responds like graphite. This property is important for greatly reducing the thermo-elastic stresses induced by the beam, thereby extending the life of the target.
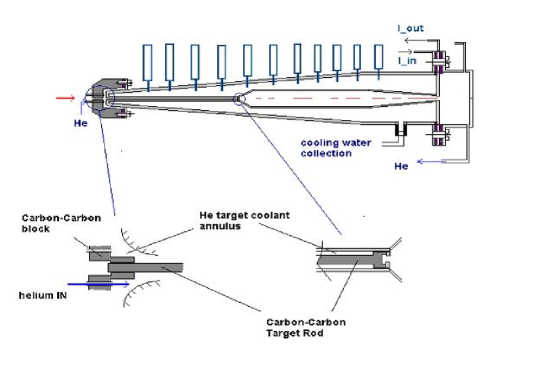
The target consists of an 80 cm long cylindrical rod of 12 mm diameter. The target intercepts a 2 mm rms proton beam of 1014 protons/pulse. The total energy deposited as heat in the target is 7.3 kJ with peak temperature rise of about 2800C. Heat will be removed from the target through forced convection of helium gas across its outside surface.
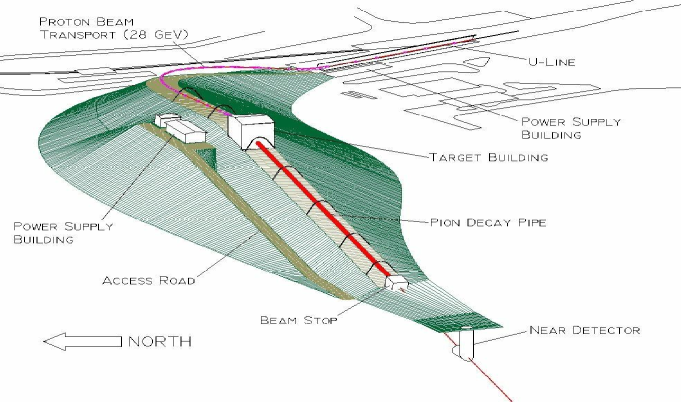
The extracted proton beam uses an existing beamline at the AGS, but is then directed to a target station atop a constructed earthen hill. The target is followed by a downward sloping pion decay channel. This vertical arrangement keeps the target and decay pipe well above the water table in this area. The 11 degrees slope aims the neutrino beam at a water Cerenkov neutrino detector to be located in the Homestake mine at Lead, South Dakota. A plan view of the AGS facility is shown in Figure 5.2. A 3-dimensional view of the neutrino beam is provided in Figure 1.3.
To assist the reading of this report and enforce consistency across chapters, the design parameters of each subsystem are provided in Appendix A.
As explained in Chapter 8, the resultant total direct cost of the 1 MW AGS Super Neutrino Beam Facility, not including both near and main detectors, is $218.5 M. The preliminary total estimated cost (TEC) is $369 M in FY03 dollars, including EDIA 15%; contingency 30%; BNL project overhead 13%. Escalation cannot be estimated without a project start year.
It is estimated that three years of R & D are needed to build prototypes and complete a detailed engineering design that will reduce cost and improve operational reliability. This will be followed by 4.5 years of construction and 0.5 year of commissioning to prepare the facility for physics research operations.
2 Injector Linac
To provide 1 MW proton beam power, the AGS has to operate at 2.5 Hz with little time allowed for injection. The present injector consists of the 200 MeV room temperature linac and 1.5 GeV Booster. It takes about 0.6 seconds to inject four Booster pulses to fill the AGS, which is not suitable for the upgrade operation. If a 1.2 GeV linac is used instead, the injection time can be reduced to less than 1 ms, allowing the AGS to cycle at the desired rate of 2.5 Hz. A 1.2 GeV linac injection can simultaneously fulfill the requirements of keeping the space charge tune shift in the AGS to be less than 0.25 and the injection losses down for reliable operation.
The distance between the exit of the 200 MeV linac and the AGS injection point is about 120 m. Only a superconducting linac (SCL) with sufficiently high gradient can meet the requirement of acceleration to 1.2 GeV within that distance. The superconducting linac technology has been used in many electron accelerators, such as LEP, CEBAF, and Tesla. The SNS project has successfully designed a 1.0 GeV proton SCL system with an accelerating gradient of about 18 MeV/m. The design of the new AGS injector linac follows closely that developed at SNS. This will substantially reduce the design cost and increase confidence in the design.
The project described corresponds to an average SCL beam current of 37.6 A, that yields the required average beam power of 1 MW at the top energy of 28 GeV, including also a controlled beam loss of about 5% during multi-turn injection into the AGS. The average beam power in exit is 45 kW, considerably less than the 1-MW level of the equivalent 1.0-GeV SCL for the Spallation Neutron Source (SNS) [5]. Thus the concern about component activation by the induced radiation from uncontrolled beam losses is greatly reduced. The repetition rate of 2.5 beam pulses per second gives a beam intensity of 0.89 x 10¹⁴ protons accelerated per AGS cycle; this is about 30% higher than the intensity routinely obtained with the present injector. At the end of an injection phase that takes about 240 turns, the space-charge tune depression is = 0.2, assuming a bunching factor (the ratio of beam peak current to average current), of 3. Also, with the normalized beam emittance of 100 mm-mrad, the actual beam emittance at 1.2 GeV is = 50 mm-mrad. Obviously, the effective vertical acceptance of the AGS at injection is to match the final beam emittance value. The SCL beam pulse length is 0.72 ms, and the beam duty cycle 0.18%.
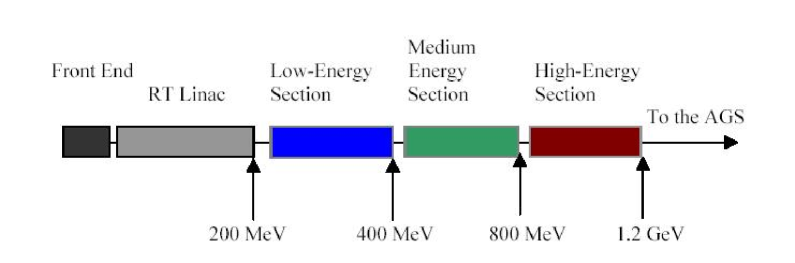
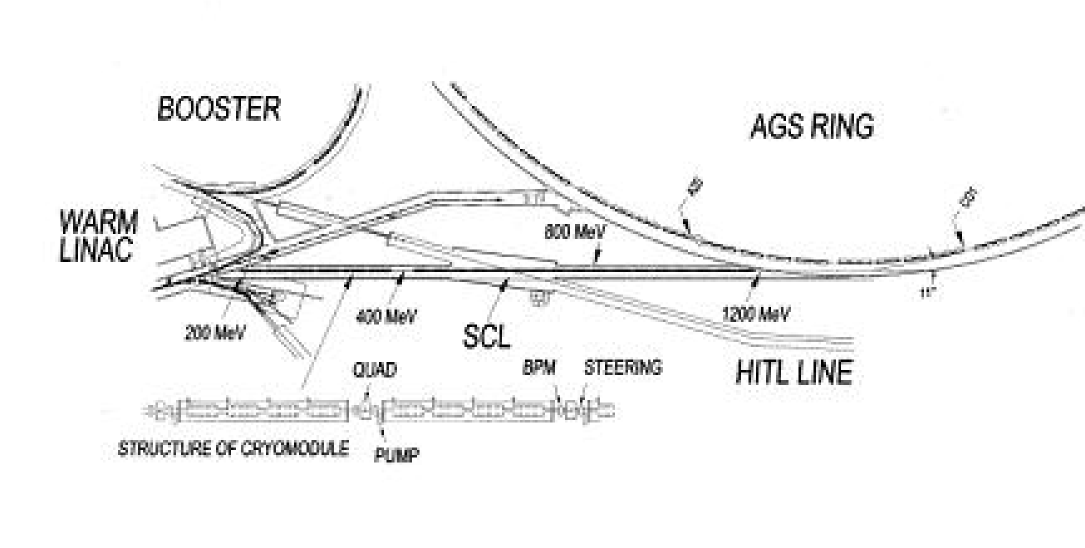
The preliminary design of the SCL consists of three parts: (i) Low-Energy (LE), (ii) Medium Energy (ME), and (iii) High Energy (HE). A schematic view of the new injector is given in Figure 2.1. The actual location of the SCL on the BNL site is shown in Figure 2.2. The beam leaves the present room temperature linac at the energy of 200 MeV and, after a bend of 17.5 degrees, enters a new 120 m long tunnel, where the SCL is located, and joins the AGS beamline at the location of magnet C01. The design parameters of the SCL and the AGS are given in Table 2.1.
| Increm. Linac Ave. Power, kW | 37.5 |
|---|---|
| Kinetic Energy, GeV | 1.2 |
| 0.8986 | |
| Momentum, GeV/c | 1.92 |
| Magnetic Rigidity, T-m | 6.41 |
| Repetition Rate, Hz | 2.5 |
| Linac No. of Protons / pulse | 9.38 x 10¹³ |
| Linac Duty Cycle, % | 0.179 |
| AGS Circumference, m | 807.076 |
| Revol. Frequency, MHz | 0.3338 |
| Revolution Period, s | 2.996 |
| Bending Radius, m | 85.378 |
| Injection Field, kG | 0.7507 |
| Injection Loss, % | 5.0 |
| Injected Protons per Turn | 3.74 x 10¹¹ |
| Norm. Emitt., mm-mrad | 100 |
| Emittance, mm-mrad | 48.8 |
| Space-Charge | 0.187 |
2.1 Room Temperature Linac Upgrade
The Brookhaven 200 MeV H- linac typically operates 5000 hours/year in support of high intensity proton operation of the AGS, polarized protons for RHIC, and medical isotope production. Some nominal operating parameters of the linac are given in Table 2.2. A detailed description of the linac can be found in references [6] and [7]. One can see from this table that the present linac can meet the requirements for beam current and repetition rate, and the required duty factor is less than the typical operating value. As will be discussed below, upgraded power supplies will be required for several systems to achieve the desired beam pulse width. However, since this upgrade is straightforward, the linac operation remains reliable, and there is room following this linac for the addition of a SCL; it was most cost effective to continue to use the full 200 MeV warm linac.
| Output Energy | 200 MeV |
|---|---|
| Frequency | 201.25 MHz |
| Repetition Rate | Hz |
| Beam Pulse Width | s |
| Nominal Duty Factor | |
| Output Beam Current | mA |
| Output Emittance (rms, Normalized) | 2 mm mrad |
| Output Energy Spread (rms) | 0.2% |
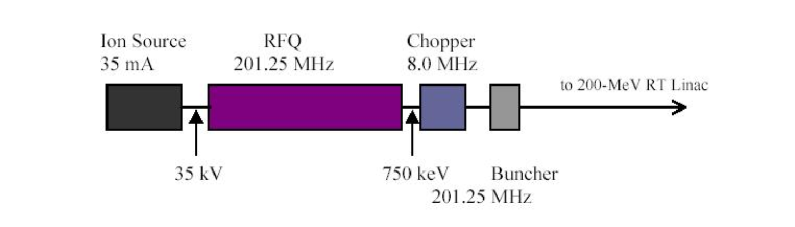
The front end of the linac is shown schematically in Figure 2.3. It starts with a magnetron H- ion source, which produces in excess of 80 mA H- beam at 35 keV. Following this, two magnetic solenoids are used to transport the H- beam 1 m and match it into an RFQ. The RFQ, operating at the linac frequency of 201.25 MHz, accelerates the beam from 35 keV to 750 keV. After the RFQ, the beam is transported 6 m to the linac. This 750 keV transport includes 10 quadrupoles and 3 bunchers for beam matching into the linac, and a fast beam chopper which allows beam chopping with 10 ns rise and fall times. This chopper is a travelling wave structure, and the beam is chopped at a frequency to match into the Booster RF accelerating bucket at injection energy. A 201.25 MHz drift tube linac (DTL) accelerates the beam from 750 keV to 200 MeV. This linac has 9 cavities, each powered by a 5 MW peak power RF system. There are a total of 286 drift tubes, with a focusing electromagnetic quadrupole in each drift tube.
As mentioned above, except for the beam pulse width, the present operation fulfills all requirements. In the future, we may consider the advantages of eliminating the long transport line from the RFQ to linac, in order to reduce the linac output emittance, but the present design assumes that this line is unchanged. Limitations in beam pulse width exist not due to mechanical limits on the ion source or linac, but rather as a result of limits in ion source power supplies, RF system power supplies, and pulsed transport line and tank quadrupole power supplies. Therefore, in order to serve as the injector to the SCL, the following improvements will be required:
-
1.
The magnetron ion source discharge, extractor, and pulsed gas power supplies must be replaced by components with wider pulse capability.
-
2.
On the 400 kW driver stage amplifier RF systems, one must increase the 4616 plate capacitor bank. This entails the purchase and installation of new 35 kV capacitors in the existing frame. The the crowbar ignitrons and sockets must be replaced. Finally, we need to increase the size of the capacitors on grid power supplies.
-
3.
In the RF modulator system, the capacitor bank has to be increased for the 4cw25000 anode supply, and the 8618 grid and cathode deck power supplies will need to be reworked.
-
4.
On the 5 MW RF system, we need to replace the 60 kV capacitor banks with banks having more capacity; again these can be installed within existing frames. The crowbar ignitrons and sockets have to be replaced for 100 kA tubes.
-
5.
On the low level RF systems, all 400 watt solid state amplifiers will need replacement.
-
6.
All pulsed transport line and tank quadrupoles will have to be replaced with solid state units having wider pulse capabilities.
The above upgrades are all straightforward, and we are confident that the required performance can be achieved.
2.2 The Superconducting Linac(SCL)
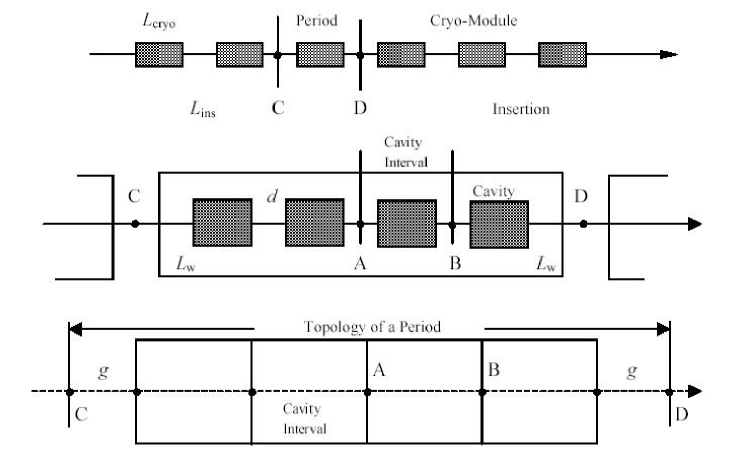
The SCL accelerates the proton beam from 200 MeV to 1.2 GeV. The configuration and the design procedure of the SCL are described in detail in reference [8]. A typical sequence of identical periods is shown in Figure 2.4. Each period consists of a cryo-module of length with an insertion of length . The insertion is needed for the placement of focusing quadrupoles, vacuum pumps and valves, steering magnets, beam diagnostic devices, bellows, and flanges. It can be either at room temperature or in a cryostat. Here we assume that the insertions are at room temperature. The cryo-module includes identical cavities, each of identical cells, and each having a length NLcell, where is the length of a cell. To avoid coupling by the leakage of the field, cavities are separated from each other by a sufficiently long drift space, . An extra drift of length may be added internally on both sides of the cryo-module to provide a transition between cold and warm regions. Thus, the length of a cryo-module is
| (2.1) |
There are two symmetric intervals: a minor one, between the two middle points A and B, as shown in Figure 2.4, that is the interval of a cavity of length ; and a major one, between the two middle points C and D, that defines the range of a period of total length . Thus, the topology of a period can be represented as a drift of length , followed by cavity intervals, and a final drift of length , where
| (2.2) |
The choice of cryo-modules with identical geometry and with the same cavity/cell configuration is economical and convenient for construction. There is, nonetheless, a penalty due to the reduced transit-time-factors when a particle crosses cavity cells with length adjusted to a common central value that does not correspond to the particle’s instantaneous velocity. To minimize this affect the SCL is divided into three sections, each designed around a different central value , and with a different cavity/cell configuration. The cell length in a section is fixed to be
| (2.3) |
where is the RF wavelength. We adopted an operating frequency of 805 MHz for the LE-section of the SCL, and 1,610 MHz for the subsequent two sections, ME and HE. The choice of the large RF frequency in the last two sections has been dictated by the need to achieve as a large accelerating gradient as possible so the SCL would fit entirely within the available space. The major parameters of the three sections of the SCL are given in Tables 2.3 and 2.4.
The length of the SCL depends on the average accelerating gradient. The local gradient has a maximum value that is limited by three causes: (1) The surface field limit, in the frequency range of interest between 805 and 1,610MHz, is around 40 MV/m. For a realistic cell shape, we set a limit on the axial electric field to 15 MV/m at 805 MHz, and 30 MV/m at 1,610 MHz. (2) There is a limit on the peak power provided by RF couplers that we take here not to exceed 400 kW, including a contingency of 50% to avoid saturation effects. (3) To make the longitudinal motion stable, we can only apply an energy gain per cryo-module that is a relatively small fraction of the beam energy at the exit of the cryo-module. The conditions for stability of motion have been derived in reference [8].
The proposed mode of operation is to operate each section of the SCL with the same energy increment. This requires the same axial field from one cryo-module to the next. To achieve this, and to compensate for the transit time variation from one cryo-module to next, it may be necessary to adjust locally the RF phase, taken here to be 30∘. Also the coupling power may have to be adjusted according to the local transit time factor. The number of cells and cavities may vary from section to section, but we have found convenient here to adopt the same distribution in all sections. There is one klystron feeding a single coupler to a single cavity. The total length of the SCL injector proper from end to end is about 130 meters, including a 4.5-m long matching section between LE and ME sections. When averaged over the real estate, the actual acceleration rate is about 5 MeV/m in the LE section and 10 MeV/m in the ME and HE sections. Efficiencies, defined as the ratio of beam power to required total AC power, is relatively high for a pulsed linac, ranging between 9 and 15%.
| Linac Section | LE | ME | HE |
|---|---|---|---|
| Ave. Incremental Beam Power, kW | 7.52 | 15.0 | 15.0 |
| Average Beam Current, A | 37.6 | 37.6 | 37.6 |
| Initial Kinetic Energy, MeV | 200 | 400 | 800 |
| Final Kinetic Energy, MeV | 400 | 800 | 1200 |
| Frequency, MHz | 805 | 1610 | 1610 |
| No. of Protons / Bunch x 108 | 8.70 | 8.70 | 8.70 |
| Temperature, oK | 2.1 | 2.1 | 2.1 |
| Cells / Cavity | 8 | 8 | 8 |
| Cavities / Cryo-Module | 4 | 4 | 4 |
| Cavity Separation, cm | 32.0 | 16.0 | 16.0 |
| Cold-Warm Transition, cm | 30 | 30 | 30 |
| Cavity Internal Diameter, cm | 10 | 5 | 5 |
| Length of Warm Insertion, m | 1.079 | 1.379 | 1.379 |
| Accelerating Gradient, MeV/m | 10.5 | 22.9 | 22.8 |
| Ave. (real-estate) Gradient, MeV/m | 5.29 | 9.44 | 10.01 |
| Cavities / Klystron | 1 | 1 | 1 |
| No. of RF Couplers / Cavity | 1 | 1 | 1 |
| RF Phase Angle | 30o | 30o | 30o |
| Method for Transverse Focusing | FODO | Doublets | Doublets |
| Betatron Phase Advance / FODO cell | 90o | 90o | 90o |
| Norm. rms Emittance, mm-mrad | 2.0 | 2.0 | 2.0 |
| Rms Bunch Area, MeV (805 MHz) | 0.5 | 0.5 | 0.5 |
Negative ion stripping during transport along the SCL has been found to be very negligible, never exceeding a rate of 2x10⁻⁸ per ion. But the final 11o bend, before injection into the AGS, could be a concern [9]. To control the rate of beam loss by stripping to a 10-5 level or less, the bending field should not exceed 1.25 kGauss over a total integrated bending length of 12 m.
A superconducting linac is most advantageous for a continuous mode of operation (CW). There are two problems in the case of the pulsed-mode of operation. First, the pulsed thermal cycle introduces Lorentz forces that deform the cavity cells out of resonance. This can be controlled with a thick cavity wall strengthened on the outside by mechanical supports. The actual design of a cavity cell is described in detail in reference [10]. Second, there is an appreciable period of time to fill the cavities with RF power before the maximum gradient is reached [8]. During the filling time, extra power is dissipated before the beam is injected into the linac. The extra amount of power required is the ratio of the filling time to the beam pulse length. The filling times are also shown in Table 2.4.
| Linac Section | LE | ME | HE |
|---|---|---|---|
| Velocity, : In Out | 0.5662 0.7131 | 0.7131 0.8418 | 0.8418 0.8986 |
| Cell Reference 0 | 0.615 | 0.755 | 0.851 |
| Cell Length, cm | 11.45 | 7.03 | 7.92 |
| Total No. of Periods | 6 | 9 | 8 |
| Length of a Period, m | 6.304 | 4.708 | 4.994 |
| FODO-Cell Ampl. Func., , m | 21.52 | 8.855 | 8.518 |
| Total Length, m | |||
| Coupler RF Power, kW (*) | 263 | 351 | 395 |
| Energy Gain/Period, MeV | 33.33 | 44.57 | 50.10 |
| Total No. of Klystrons | 24 | 36 | 32 |
| Klystron Power, kW (*) | 263 | 351 | 395 |
| Z0T, ohm/m | 378.2 | 570.0 | 724.2 |
| Q0 x 1010 | 0.97 | 0.57 | 0.64 |
| Transit Time Factor, T0 | 0.785 | 0.785 | 0.785 |
| Ave. Axial Field, Ea, MV/m | 13.4 | 29.1 | 29.0 |
| Filling Time, ms | 0.337 | 0.273 | 0.239 |
| Ave. Dissipated Power, W | 2 | 11 | 8 |
| Ave. HOM-Power, W | 0.2 | 0.5 | 0.4 |
| Ave. Cryogenic Power, W | 65 | 42 | 38 |
| Ave. Beam Power, kW | 7.52 | 15 | 15 |
| Total Ave. RF Power, kW (*) | 17 | 31 | 30 |
| Ave. AC Power for rf, kW (*) | 37 | 69 | 67 |
| Ave. AC Power for Cryo., kW | 46 | 30 | 27 |
| Total Ave. AC Power, kW (*) | 83 | 99 | 94 |
| Efficiency, % (*) | 9.05 | 15.21 | 16.08 |
| (*) Including 50% RF power contingency. | |||
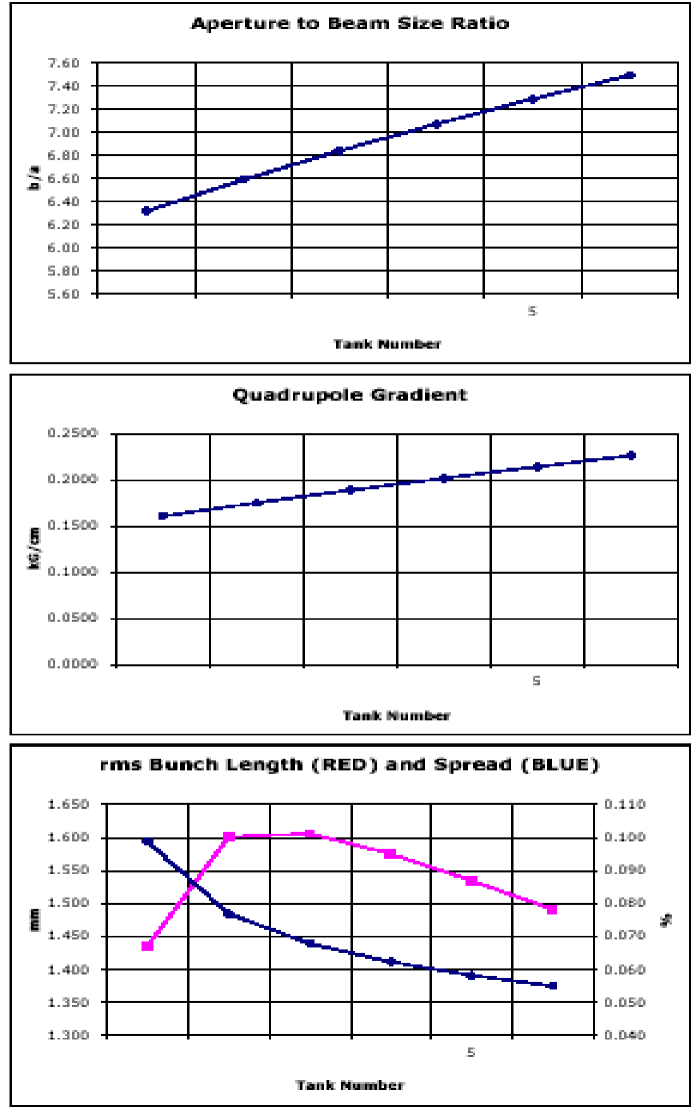
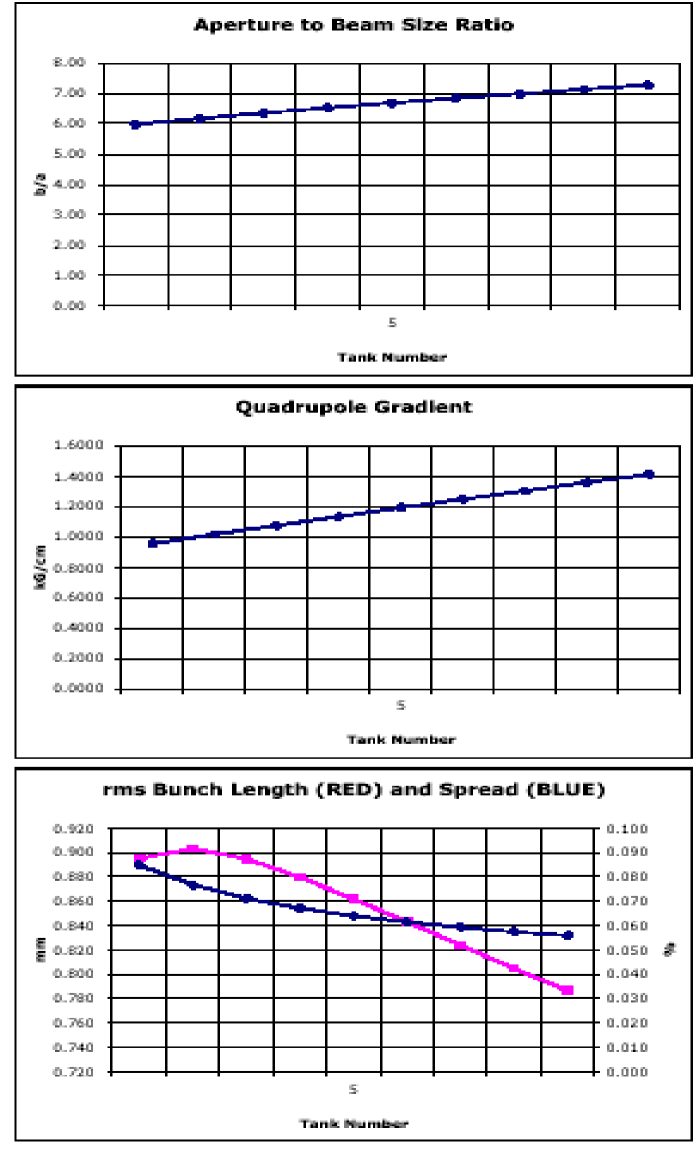
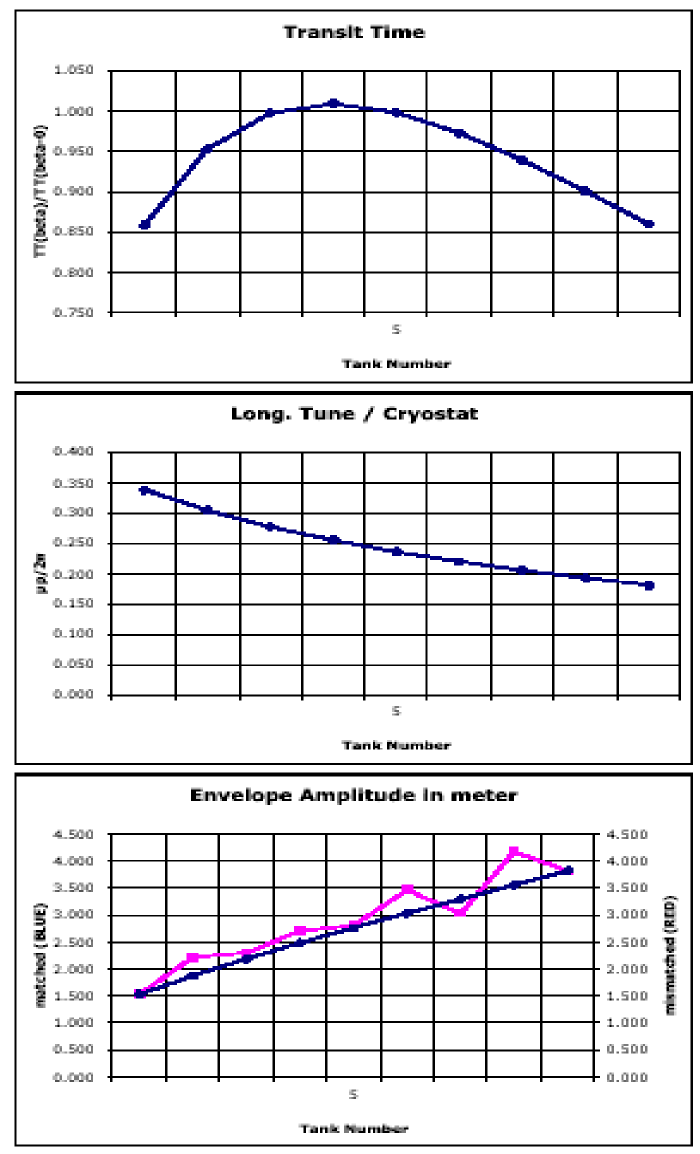
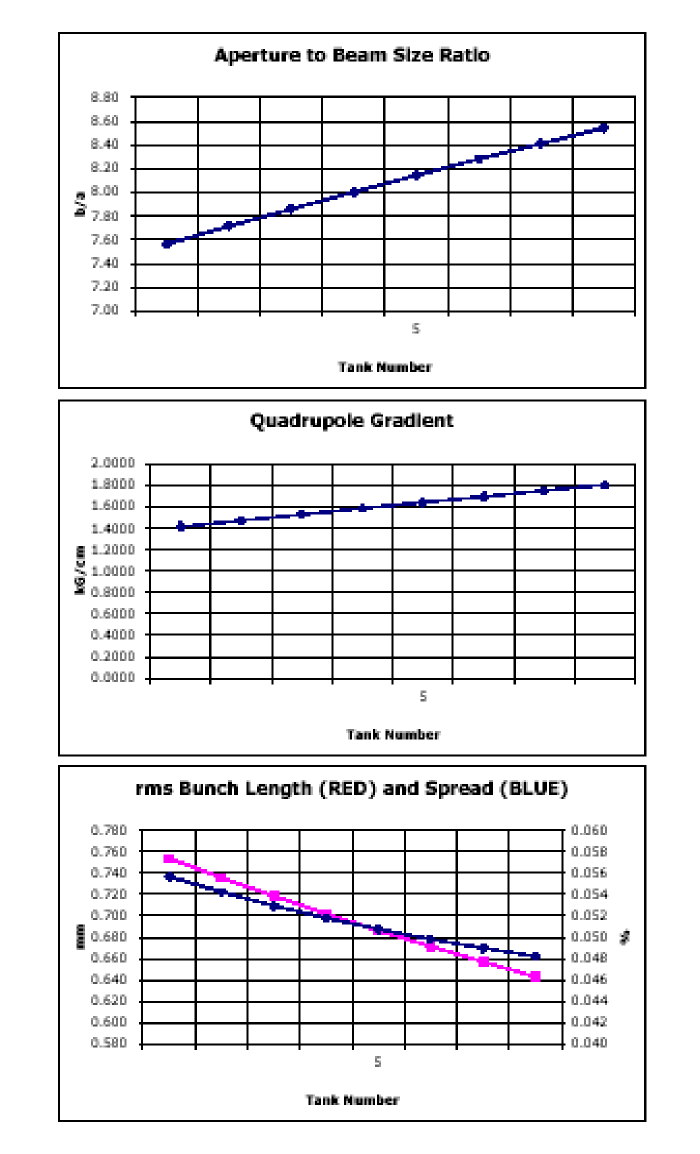
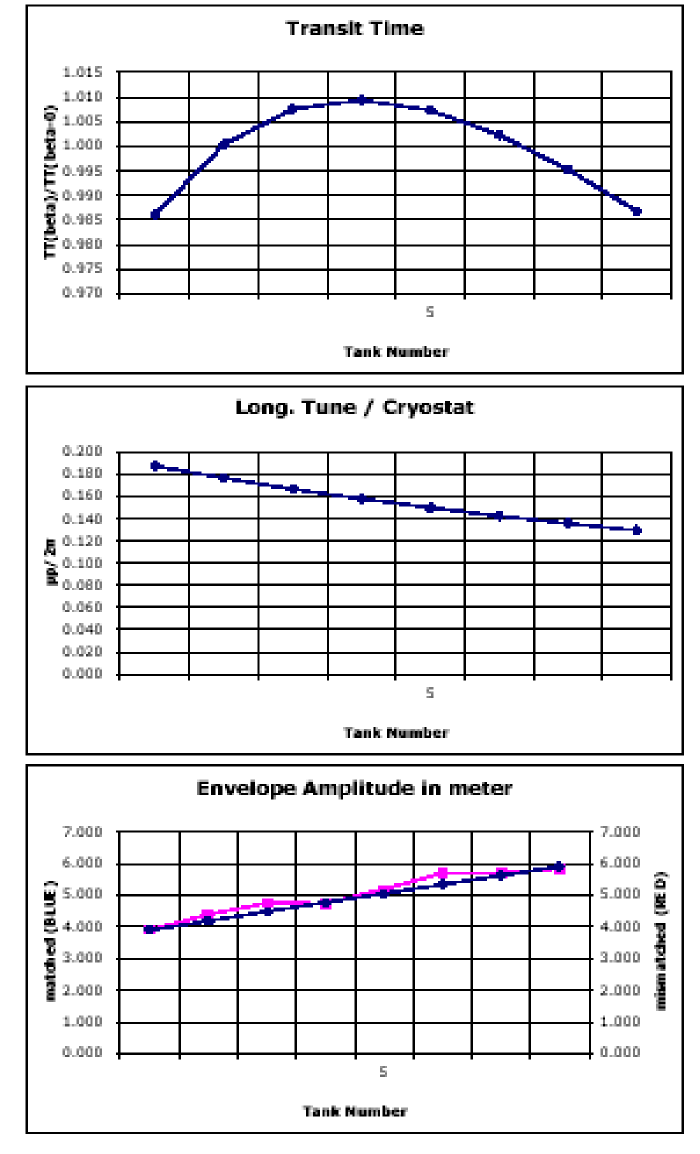
A program [11] was written in Visual Basic ( included with the MS Excel application), to calculate the beam and RF dynamics during acceleration in each of the three sections of the SCL. The results are displayed in Figures 2.5 to 2.10.

2.2.1 Transverse Focusing
The upgrade makes use of the present 200 MeV room temperature linac, with proper modifications as described. This linac provides a negative ion beam with an emittance of 2.0 mm-mrad. To avoid uncontrolled beam losses that may cause radiation activation, we require that the ratio of inner cavity radius to rms beam size is at least a factor of 6 over the length of the SCL. This is difficult to achieve in the ME and HE section where the inner aperture is of only 5 cm because of the larger RF frequency. We have thus adopted in these two sections transverse focusing with doublets of quadrupoles, whereas a FODO singlet sequence was found to be adequate in the LE section.
3 AGS Upgrade
As explained in the introduction, a 1.2 GeV linac will be used for the injection into the AGS directly to reduce the injection time to about 1.0 msec. The results of the study of the multi-turn direct injection are presented in Section 3.1. The approache to increase the AGS repetition rate from current 0.5 Hz to 2.5 Hz is discussed in Section 3.2. In parallel with improvement to the power supply system is the upgrade of the RF system to raise the accelerating voltage from 400 kV to 1.0 MV. Finally, the eddy current effects due to increased repetition rate are covered in section 3.4.
All the above improvements employ proven technology and a successful implementation of this design can be assured.
3.1 Multi-Turn Injection into the AGS
The front end ion source has to operate with a 1% duty cycle at the repetition rate of 2.5 Hz as explained in Chapter 2. The combination of the chopper and of the RFQ pre bunches the beam with a sufficiently small bunch length so that each beam bunch fits in the accelerating RF buckets of the downstream DTL, which operates at 201.25 MHz. The DTL is a room-temperature conventional linac that accelerates to 200 MeV. The proposed new injector for the AGS adds a 1.2 GeV SCL with an average output beam power of about 45 kW. The injection energy is still low enough to control beam losses due to stripping of the negative ions that are used for multi turn injection into the AGS. The duty cycle is about 0.5%. Injection into the AGS is modeled after the SNS scheme [5]. However, the repetition rate, and consequently the average beam power, is much lower here. The larger circumference of the AGS also reduces the number of foil traversals. Beam losses at injection into AGS are estimated to be about 3% controlled losses and 0.3% uncontrolled losses. This is based on a comparison with the actual experience in the AGS Booster and the LANL PSR and the predicted losses at the SNS using the quantity (NP / A), which is proportional to the Laslett tune shift, as a scaling factor. This is summarized in Table 3.1. As can be seen, the predicted 3% beam loss is consistent with both the AGS Booster and the PSR experience and the SNS prediction.
| Injection Parameters | AGS Booster | SNS | PSR | 1 MW AGS |
| Beam Power,Linac Exit (kW) | 3 | 1000 | 80 | 45 |
| Kinetic Energy (MeV) | 200 | 1000 | 800 | 1200 |
| No.of Protons NP | 15 | 100 | 31 | 100 |
| Vertical Acceptance, A | 89 | 480 | 140 | 55 |
| 0.57 | 6.75 | 4.50 | 9.56 | |
| 0.296 | 0.031 | 0.049 | 0.190 | |
| Total Beam Losses % | 5 | 0.1 | 0.3 | 3 |
| Total Lost Beam Power W | 150 | 1000 | 240 | 1440 |
| Circumference m | 202 | 248 | 90 | 807 |
| Lost Beam Power per Meter W/m | 0.8 | 4.0 | 2.7 | 1.8 |
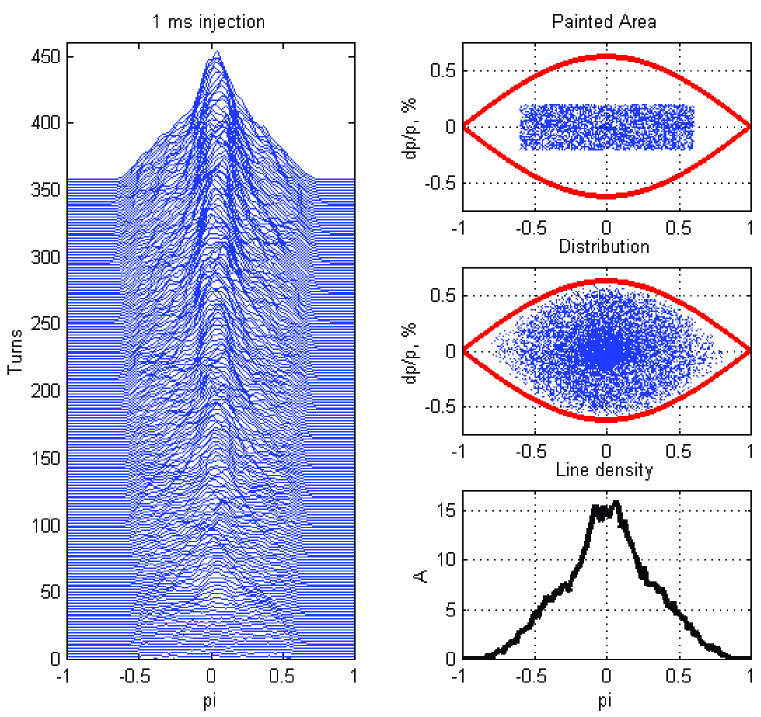
The AGS injection parameters are summarized in Table 3.2. A relatively low RF voltage of 450 kV at the injection is necessary to limit the beam momentum spread at the multi-turn injection to be about 0.48 %, and the longitudinal emittance to be about 1.2 eVs per bunch. Such a small emittance is important to limit beam losses during transition crossing in the AGS.
A preliminary simulation of the 360 turns injection process is shown in Figure 3.1. Without the second harmonic RF, some dilution of the injected particles in the phase space is inevitable. The bunch shape is similar to the one at the PSR of Los Alamos, with a noticeable sharp peak, however, a possible linac beam momentum ramping could improve this.
| Injected Turns | 360 |
|---|---|
| Repetition Rate (Hz) | 2.5 |
| Pulse Length (ms) | 1.08 |
| Chopping Rate % | 0.65 |
| Linac Average/Peak Current (mA) | 20/30 |
| Momentum Spread | |
| Norm. 95% Emittance | 12 |
| RF Voltage (kV) | 450 |
| Bunch Length (ns) | 85 |
| Longitudinal Emittance (eVs) | 1.2 |
| Momentum Spread | |
| Norm. 95% Emittance | 100 |
The beam instability consideration is focused on two aspects. These are, as usual for the AGS, at high energy, the longitudinal instability around transition, and the transverse instability above transition.
The fractional beam momentum spread at transition has to be less than 0.0075 because of the limited momentum aperture during the transition energy jump. With the transition jump, the slippage factor can be controlled to be greater than 0.002. With a bunch rms length of 4.25 ns and the peak current of 85 A at transition, the longitudinal impedance needs to be less than to avoid longitudinal microwave instabilities.
The measured AGS broadband impedance is about . The broadband impedance mainly comes from the unshielded bellows, the vacuum chamber connections and steps and cavities, and also with possible contribution from BPMs and ferrite kickers. With a modest effort, this impedance can be reduced to be less than , which is consistent with newly designed proton machines.
In fact, if only the longitudinal microwave instability were of concern, a larger broadband impedance could be tolerated since the longitudinal space charge impedance of about at transition, which is capacitive, has the effect of cancelling the inductive broadband impedance. However, the transverse instability at the high energy is more serious, even with a broadband impedance of . In summary, since the intensity of is only marginally higher than the present intensity of , the beam instability during acceleration and transition crossing can be avoided.
3.2 AGS Main Power Supply Upgrade
3.2.1 Present Mode of Operation
The present AGS Main Magnet Power Supply (MMPS) is a fully programmable 6000 A, 9000 V SCR power supply. A 9 MW Motor Generator (MG), made by Siemens, is a part of the main magnet power supply of the accelerator. The MG permits pulsing the main magnets up to 50 MW peak power, while the input power of the MG itself remains constant. The highest power into the MG ever utilized is 7 MW, that is, the maximum average power dissipated in the AGS magnets has never exceeded 5 MW.
The AGS ring comprises 240 magnets connected in series. The total resistance, R, is and the total inductance, L, is 0.75 H. There are 12 superperiods, designed A through L, of 20 magnets each, divided in two identical sets of 10 magnets per superperiod.
Two stations of power supplies are each capable of delivering up to 4500 V and 6000 A. Every station consists of two power supplies connected in parallel. One power supply is a 12 pulse SCR rated at +/-5000 V, 6000 A unit (P type) that is typically used for fast ramping during acceleration and energy recovery. The other is a lower voltage 24 pulse unit (F type), rated at +/-1000 V, 6000 A, that is used for flattop or slow ramping operation. The two stations are connected in series, with the magnet coils arranged to have a total resistance R/2 and a total inductance of L/2. The grounding of the power supply is done only in one place, in the middle of station 1 or 2, through a resistive network. With this grounding configuration, the maximum voltage to ground in the magnets does not exceed 2500 V. The magnets are tested at 3 kV to ground prior to each startup of the AGS MMPS after long maintenance periods.
3.2.2 Super Neutrino Beam Mode of Operation
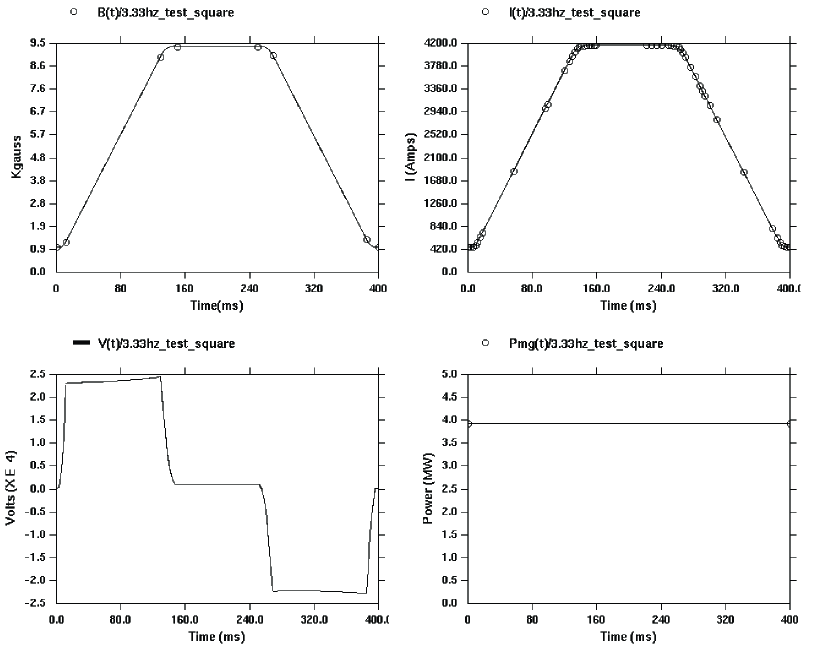
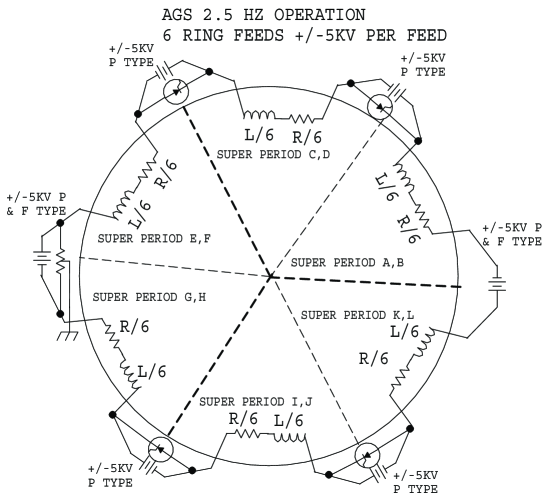
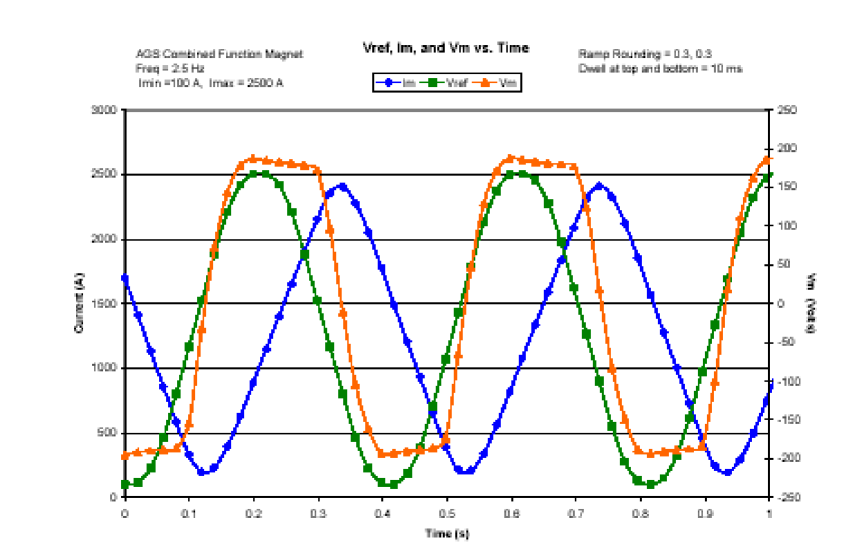
To cycle the AGS ring to 28 GeV at 2.5 Hz and with a ramp time of 200 ms, the magnet peak current is 4300 A and the peak voltage is 25 kV. Figure 3.2 displays the magnet current and voltage of a 2.5 Hz cycle. The total average power dissipated in the AGS magnets is estimated to be 3.7 MW. To limit the AGS coil voltage to ground to 2.5 kV, the AGS magnets must be divided into three identical sections, each powered similarly to the present AGS except that now the magnet loads represent only 1/6 of the total resistance and inductance. Every section will be powered separately with its own feed to the ring magnets and an identical system of power supplies, as shown in Figure 3.3. Bypass SCR’s will be used across the four new P type stations, to bypass these units during the flattop, and ensure minimum ripple. Note that only station 1 will be grounded as it is done presently.
Although the average power will not be higher than now, the peak power required is approximately 110 MW, exceeding the 50 MW rating of the existing MG. A new MG capable of providing 100 MW, may operate with 12 phases to limit, or even eliminate, the need for phase shifting transformers so that every power supply system would generate 24 pulses. The generator voltage will be about 15 kV line-to-line, to limit the generator current to less than 6000 A during pulsing. The generator will be rated at a slip frequency of 2.5 Hz.
Running the AGS at 2.5 Hz requires that the acceleration ramp period decreases from 0.5 s down to 0.20 s. That is, the magnet current variation dI/dt is about 3 times larger than at present. Eddy current losses in the vacuum chamber are proportional to the square of (dI/dt), that is they are 10 times larger. However, this is still significantly below the present ramp rate of the AGS Booster which does not require active cooling. The increased eddy currents give rise to increased sextupole fields during the ramp, and will add about 20 units of chromaticity. The present chromaticity sextupoles will be upgraded to correct this.
3.3 AGS RF System Upgrade
At 2.5 Hz the peak acceleration rate is three times the present value for the AGS. With 10 accelerating stations each station will need to supply 270 kW peak power to the beam. The present power amplifier design, employing a 300 kW power tetrode will be suitable to drive the cavities and supply power to the beam. The number of power amplifiers will be doubled so that each station will be driven by two amplifiers of the present design. This follows not so much from the power consideration but from the necessity to supply 2.5 times the RF voltage.
An AGS RF station comprises four acceleration gaps surrounded by 0.35 m of ferrite stacks. The maximum voltage capability of a gap is not limited by the sparking threshold of the gap but by the ability of the ferrite to supply the magnetic induction. When the AGS operates with 0.5 Hz ramp the gap voltage is 10 kV. At 2.5 Hz we will need up to 25 kV per gap (roughly equal to the voltage from the same gap design used at the Booster, 22.5 kV) and this taxes the properties of the ferrite. Above a certain threshold value of (20 mT for AGS ferrite 4L2) a ferrite becomes unstable and excessively lossy. The gap voltage at this is simply given by
| (3.1) |
where is the RF radian frequency and the variables , , and are the inner and outer radius and length of the ferrite stack, respectively.
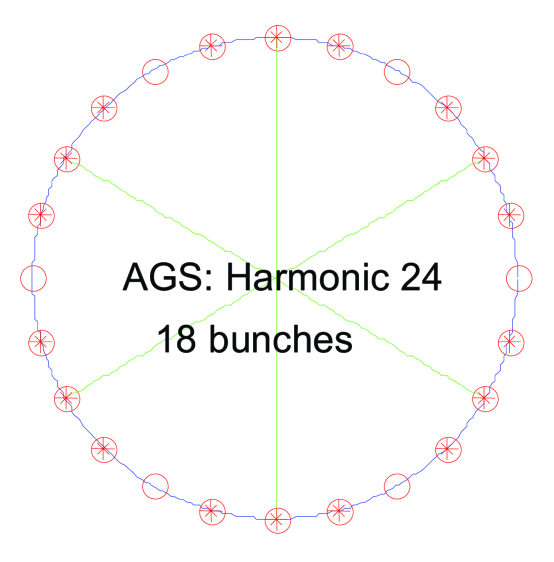
The only free variable is . If we operate the RF system at the 24th harmonic of the revolution frequency (9 MHz) then the required voltage of 25 kV can be achieved with a safe value for of 18 mT.
The next concern is the power dissipation in the ferrite and the thermal stress that is created by differential heating due to rf losses in the bulk of the material. We know from experience that below 300 mW/cm3 the ferrites can be adequately cooled. The power density is also proportional to and is given by
| (3.2) |
where is the quality factor of the ferrite.
The product is a characteristic of the ferrite material and depends on frequency and . We have data on ferrite 4M2 (used in the Booster and SNS) at 9 MHz and 20 mT where the power dissipation is 900 mW/cm3. The details of the acceleration cycle determine the RF voltage program that is needed. For the cycle shown in Figure 3.2 a peak voltage of 1 MV (40 gaps each with 25 kV) is needed but for only 20 ms during acceleration. This is a duty factor of less than 0.05 giving an average power dissipation much less than the limit. We do not yet have data on the present AGS ferrite, 4L2 at 9 MHz. Characterizing 4L2 in this parameter regime is identified as an R&D issue but at least we know that retrofitting the AGS cavities with 4M2 is a fallback option.
3.4 Eddy Current Effects
Presently the magnet cycle of the AGS accelerator has a period of 3.5 sec with rise time of 200 msec between the injection energy and top energy.The proposed magnet cycle of 2.5 Hz for the neutrino production operation will reduce the time between the injection and extraction to 90 msec. The 75 mils thick vacuum beam pipe of the circulating beam of AGS (see Figure 4.4) is made of inconel conducting material. The increased rate of change of the magnetic flux (/dt) during the 2.5 Hz operation will generate eddy currents in both, the current caring coils and the vacuum chamber, that may introduce the following adverse effects:
- a.
-
Ohmic heating of the coils. These Ohmic losses are added to the Ohmic losses due to the current that is used to excite the magnet and are due to the eddy currents generated in the conductors because of the rate of change of the magnetic flux (/dt).
- b.
-
Ohmic heating of the chamber wall.
- c.
-
Magnetic multipoles at the region of the circulating beam. Such magnetic multipoles that will vary during the acceleration of the beam may bring the circulating beam in a strong resonance that will results in large beam losses.
The Ohmic losses may require cooling of the vacuum chamber wall and additional cooling of the magnet coil and may increase dramatically the requirements of the power supply of the main magnet.
The above effects a) b) and c) have been studied by modeling the AGS magnet and the vacuum chamber in a 2-dimentional model, using the computer code OPERA[12] for electromagnetic fields calculations, and the results are reported in the following sections.
The iron of the AGS main magnet is of silicon-steel magnetic material comprised of 1/8” thick laminations, which are electrically insulated and held together (sandwiched) by two 1” thick plates of the same magnetic material, one at each end of the magnet. The effects of the eddy currents generated in the iron of the magnet can also be studied by 3-dimentional modeling of the magnet and performing 3-dimentional electromagnetic calculations.
3.4.1 Effect of the Eddy Currents in the Current Carrying Conductors of the Magnet.
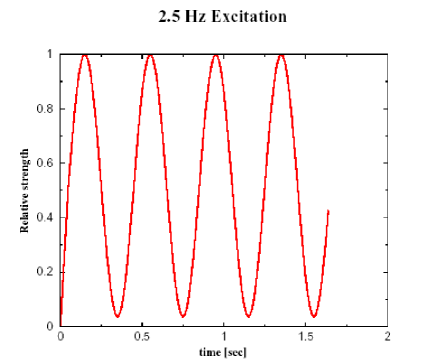
An approximate function of the excitation of the magnet (I vs time) that has been used in the electromagnetic calculations is shown in Figure 3.5. The minima of the function I(t)=Idc+I0sin(t) correspond to the injection of the H- beam and the maxima to the extraction of the 28 GeV proton beam. The time varying magnetic flux generated by the excitation of the main magnet generates an EMF and therefore eddy currents on the magnets coils. The cross section of a coil in a main magnet is shown in Figure 4.4 and consists of a water cooled conductor with 32 turns (16 top and 16 bottom).
The effect of the EMF has been calculated[13] and can be counter balanced by increasing the voltage of the main magnet power supply.
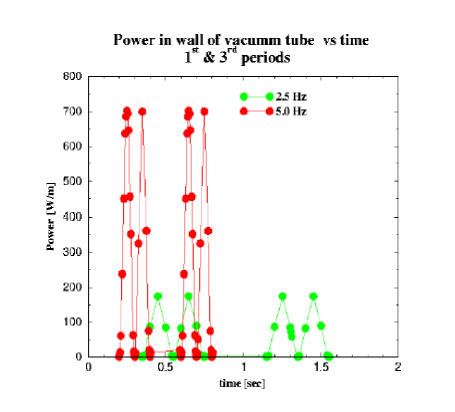
The effect of the eddy currents generated on the coil have been calculated and the results are shown in Figure 3.6. The Ohmic losses have been calculated for two excitations of the main magnet 2.5 Hz (green curve) and 5.0 Hz (red curve). The fact that the Ohmic losses during the 1st period are comparable to those of the 3rd period signifies that eddy currents acquire a steady-state very early in the magnet cycle.
The consecutive minima of the Ohmic losses curves shown in Figure 3.6, correspond to the consecutive minima and maxima of the excitation curve shown in Figure 3.5.
The maxima of the Ohmic losses curves shown in Figure 3.6, correspond to the points of the excitation curve of Figure 3.5 where the rate of change (derivatives) is a maximum.
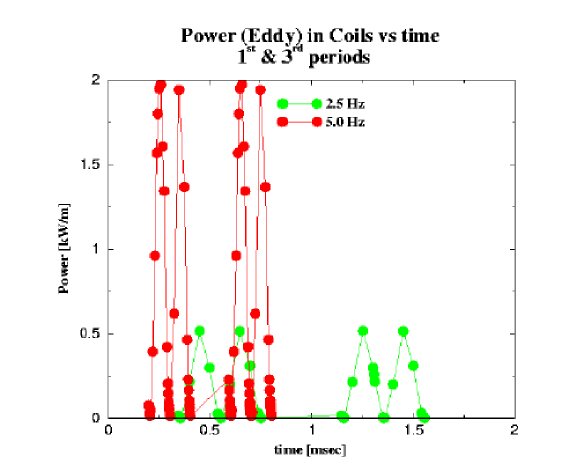
As expected, the calculated integrated Ohmic losses for the 5.0 Hz operation are 4 times larger than those for 2.5 Hz operation.
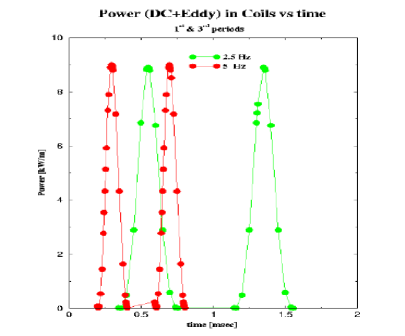
In Figure 3.7 plotted are the total Ohmic losses in the coil due to both the excitation current and the eddy currents. Like in Figure 3.6 only the 1st and the 3rd periods are plotted.
The Ohmic losses due to eddy currents are 3% and 12% of the Ohmic losses due to the excitation current, for 2.5 Hz and 5.0 Hz operation respectively.
3.4.2 Eddy Currents in the Wall of the Vacuum Chamber
The time varying magnetic flux generated by the excitation of the main magnet generates eddy currents in the wall of the vacuum chamber of the circulating beam.
The eddy currents generated on the wall of the vacuum chamber have the following adverse effect:
- a.
-
Ohmic heating on the wall of the vacuum chamber.
- b.
-
Introduce magnetic multipoles including dipole field.
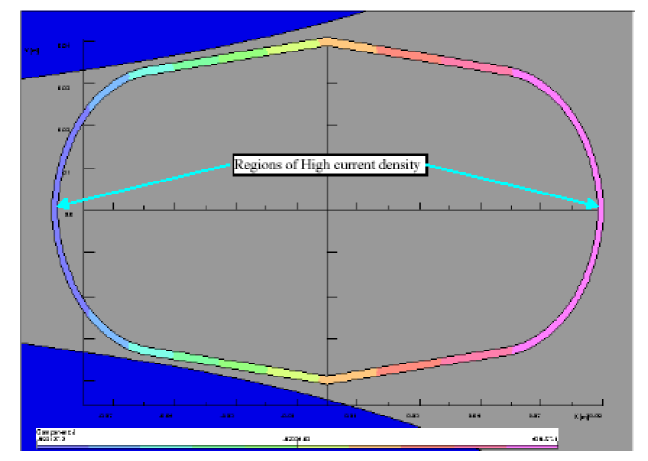
Figure 3.8 shows the cross section of the vacuum chamber with the magnitude of the eddy current density shown on the walls of the vacuum chamber with different colors. The regions of high current density are on the left and right edges of the vacuum chamber. The regions of low density are at the top and bottom of the vacuum chamber.
The calculated Ohmic losses per unit length due to the eddy currents generated on the walls of the vacuum chamber are plotted in Figure 3.9 as a function of time. The Ohmic losses have been calculated for two excitations of the main magnet; 2.5 Hz (green curve) and 5.0 Hz (red curve). The eddy current Ohmic losses as a function of time follow the same pattern as those in the coil of the main magnet (see previous section).
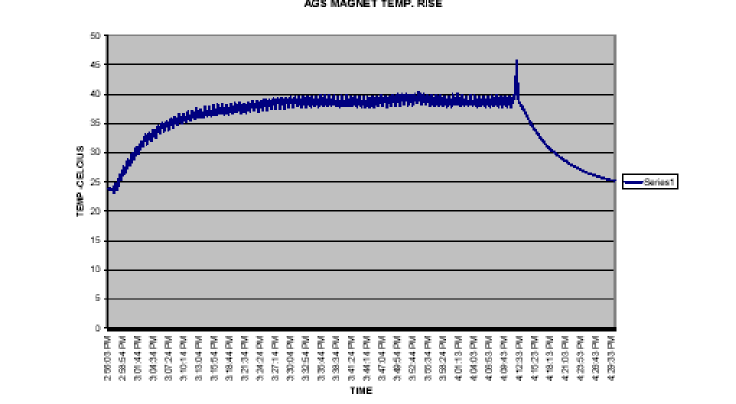
Experimental measurements of the temperature rise of the vacuum chamber of the AGS have been performed for a single AGS c-type magnet when the coil of the magnet is subject to time varying sinusoidal current as shown in Figures 3.10, and 3.11
3.4.3 Magnetic Multipoles Generated by the Eddy Currents
The eddy currents generated on the wall of the vacuum chamber will affect the magnetic field at the circulating beam region. Due to the median plane symmetry of the magnet we only consider the normal multipoles which are define in this report with the relation:
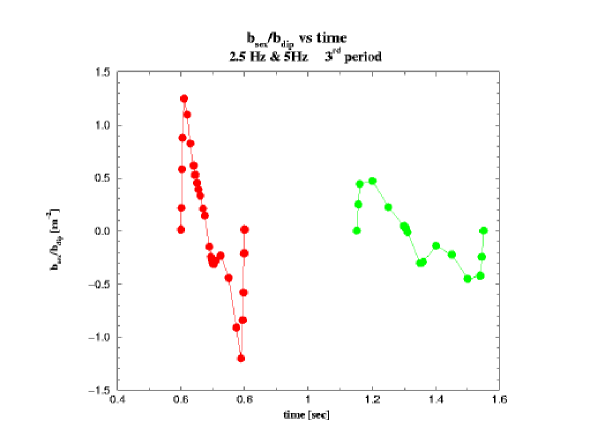
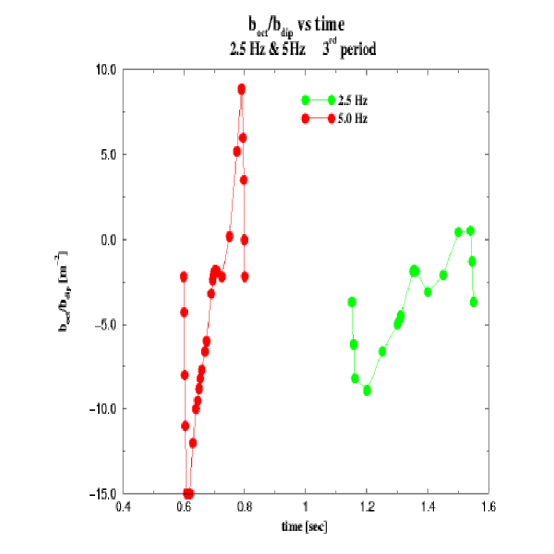
Br= bdipsin(+bquadr1cos(2+bsexr2cos(3+boctr3cos(4+bdecr4cos(5+…….
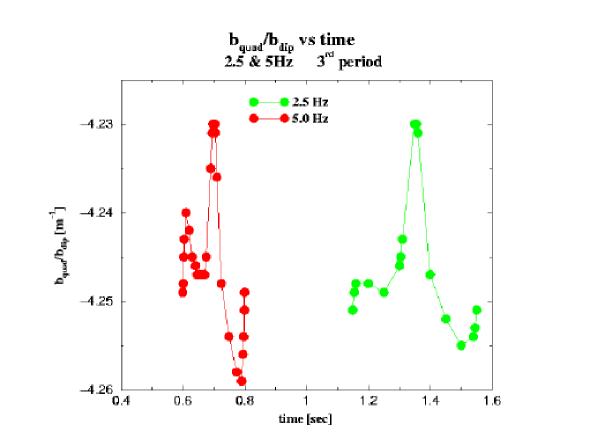
Figures 3.12, 3.13 and 3.14 plot ratios bquad/bdip, bsex/bdip, and boct/bdip, of the magnetic multipoles as a function of time during the 3rd period from the start of the excitation of the main magnet. The calculation have shown that a steady has been achieved, therefore the functional form of the multipoles for any subsequent period is identical to the one shown in these figures.
The 5.0 Hz excitation of the main magnet generates larger variation of the magnetic multipoles than the 2.5 Hz excitation. The effect of the calculated multipoles on the circulating beam will be studied in a separate report.
In conclusion, the scheme for a 1 MW proton driver based on the AGS with upgraded injection is feasible. Indeed, the AGS beam intensity is only modestly higher than during the present high-intensity proton operation and, therefore, beam instability is not expected to be a problem during acceleration.
4 AGS Injection and Extraction
A high intensity proton beam of 8.9x10¹³ protons at an energy of 28 GeV is required to irradiate the production target at a repetition rate of 2.5 Hz. This high intensity proton beam can be produced by injecting 1.2 GeV H- ion from a superconducting linac (see Section 2.2). This section provides a feasibility study of injection, acceleration and extraction of such a high intensity proton beam at a frequency of 2.5 HZ using the AGS machine. The following items have been studied here:
-
1.
Injection of the H- Beam:
- a.
-
The geometry of the H- injection: Location of the injection region in AGS ring and required devices in the injection region.
- b.
-
The calculation of the beam parameters of the circulating beam in AGS at the H- injection point. These parameters are required for the matching of the beam parameters of the H- injected beam to those of the circulating beam.
-
2.
”Stripping Foil” issues generated by the partially stripped H- injected beam:
-
3.
Acceleration:
- a.
-
The effect that the AGS-main-magnet cycle generates on the vacuum chamber of the AGS ring during the 2.5 Hz ramping of the main magnet.
- b.
-
Calculations of the magnetic multipoles introduced, in the main magnetic field of the AGS synchrotron, by the eddy currents of the vacuum chamber.
-
4.
Extraction:
- a.
-
The geometry of the extraction region. Location of the extraction region in the AGS ring, and required devices for beam extraction in the extraction region.
- b.
-
The calculation of the beam parameters of the circulating beam in the AGS at the extraction point. These beam parameters are required for the matching of the beam parameters of the extracted beam, to those of the transport beam line to the “neutrino production” target (RTBT).
4.1 H- Injection into AGS
Figure 2.2 is a drawing showing a sections of the AGS with the main magnets and the layout of the proposed superconducting linac that will accelerate the H- ions to an energy of 1.2 GeV for injection into the AGS. A section of the AGS-Booster ring appears in the upper left corner of the drawing. The H- Injection region has been chosen to be the B20 straight section of the AGS.
4.1.1 Considerations for the 1.2 GeV H- Injection into the AGS
- a.
-
The H- ions are to be injected from the SC_linac into the AGS using the “electron stripping” method [14]. The electrons of the injected H- ions will be stripped by a foil located inside the pipe of the circulating beam of AGS. The issue is to determine the optimum location of the stripping foil.
- b.
-
The integrated magnetic field {Bdl} of the magnets comprising the High Energy Beam Transport (HEBT) line that transports the H- ions from the exit of the SCL to the injection points (stripping-foil location) should be minimized in order to keep the ionization probability of the H ions [8] below 1x10⁻⁶. For 8.9x10¹³ H- ions injected into AGS at 2.5 Hz, an ionization probability of 1x10⁻⁶ is equivalent to 0.05 W of energy deposited into the HEBT line. This constraint on the allowed upper limit ( 1x10 of the ionization probability of the H- ions, sets an upper limit on the maximum value of the magnetic fields of the magnets needed to bend and focus the H- injected beam.
- c.
-
The HEBT line must provide space for Dipoles and Quads to be used to match the beam parameters of the injected H- beam to those of the circulating proton beam of the AGS at the injection point. (The injection point is defined as the point where the central trajectory of the injected H- beam intersects the stripping foil).
- d.
-
In order to avoid the coherent betatron-oscillations that protons of the injected beam could perform while circulating in the AGS, the injected H- beam and the central orbit of the circulating beam must be collinear at the injection point. This can be accomplished either by, locally displacing the circulating beam “locally bumping the beam” at the location of the injection point; and/or by adjusting the injection angle of the H- injected beam. Both methods will be discussed.
- e.
-
In order fill the phase space of the circulating beam with injected beam, the central orbit of the circulating beam is displaced “bumped locally” in the horizontal and vertical direction during the H- beam injection. To implement the displacement of the central orbit of the circulating beam we use the same or similar hardware that is used to implementing the “local bump” in (e). The method to “locally bump” the beam will be discussed in a technical note. At time varying bump will also help reduce the number of “foil crossing” of the circulating beam during the time the AGS is being injected with H- beam.
- f.
-
The electrons generated by stripping of the H- beam at the stripping foil, as well as the H0 and H- particles that may result from incomplete stripping, should be removed from the injected beam with a controlled method. A proposed method of “dumping properly” all particles emerging from the stripping foil( except the protons) will be discussed.
4.1.2 Layout of the H- Injection Region
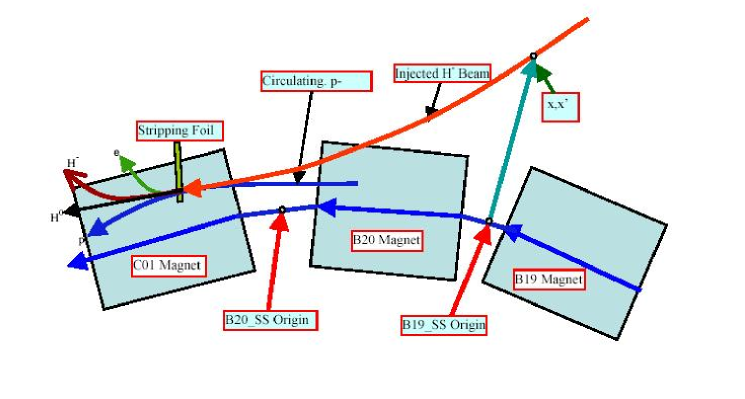
A schematic diagram of the Injection region is shown in Figure 4.1. In this diagram the following items are shown:
- a.
-
Three of the main AGS combined-function main magnets (B19,B20, and C01).
- b.
-
The stripping foil which is shown inside the magnet C01.
- c.
-
Part of the closed orbit of the circulating proton-beam. The closed orbit is locally displaced “bumped” to the outside, and at the location of the stripping foil. The reason for “locally bumping” the closed orbit is partly described in Section 4.1.1 d), e) above. Section 4.1.3 below describes the method to generate the locally bumped orbit. At the end of the H- injection time interval, the “locally-bumped” orbit of the circulating beam will return to a new orbit which is not bumped (labeled as “Circulating p-beam” in Figure 4.1 )
- d.
-
The trajectory of the injected H- beam. The direction of the injected H- is defined by the coordinate point (x,x’) shown in the diagram. The coordinate x is the distance from the center point of the straight section SS_B19 and x’ is the angle between the direction of the H- and the SS_B19. At this distance x, the influence of the fringe field of the AGS main magnets on the H-is negligible. As the injected beam approaches the injection point (stripping foil shown in Figure 4.1) the fringe field and main field of the AGS main magnets B19 and C01 become significant and are taken into account in the calculations that determine: (1) the location of the stripping foil inside the magnet C01; (2) the beam parameters at the injection point (see Section 4.1.4 below).
- e.
-
The trajectories of the H- beam that are not stripped by the stripping foil ( the partially stripped H- beam and the electrons emanating from the stripping foil) must all be directed into a “dump” downstream of the stripping foil.
4.1.3 The “Local Beam-Bump” at the Injection Region
In order to make the circulating proton beam collinear with the H- injected beam at the injection point (stripping foil), circulating proton beam is “locally bumped” by using two horizontal ”bump- magnets”. The first ”bump-magnet” is located at -900 phase advance, upstream of the stripping foil (location of the first ”bump-magnet” is at the straight section SS_B12) , and the second ”bump-magnet” is located at +900 phase advance downstream of the stripping foil (location of the second ”bump-magnet” is at the straight section SS_C06). Figure 4.2 plots the displacement (y-axis) of the closed orbit at the center of the straight sections (x-axis) of the AGS for the two cases:
- a.
-
When the “bumped-magnets” are turned off, and the orbit (red line) is not “locally bumped”;
- b.
-
when the “bumped-magnets” are turned on , and the orbit (blue line) is “locally bumped”. The strength of the “bumped-magnets” whose location is systematically shown in Figure 4.2, is 3 mrad each. The horizontal and vertical tunes (Qx,Q and the lengths of the closed orbits for the two cases is shown in the Figure 4.2.
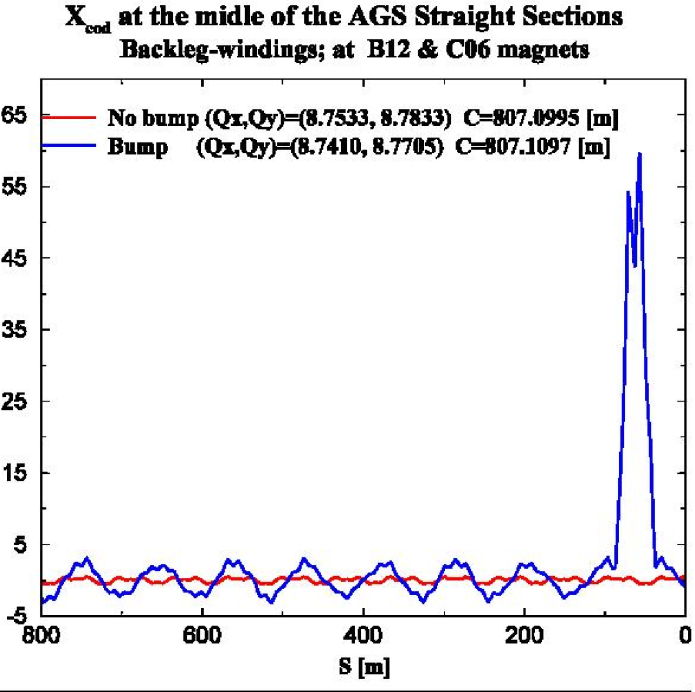
Figure 4.3 shows the displacement (y-axis) of a section of the “locally bumped” closed orbit (black line) at the location of the C01 main magnet of the AGS. The maximum displacement (56 mm) of the closed orbit occurs at the center (38 inches) of the 75 inches long C01 magnet. This displaced orbit has been generated using the two magnet mentioned earlier which are located at 900 phase advance from the C01 magnet (this section).Each of the other lines are trajectories of the H- injected beam corresponding to a different (x,x’) direction of the H- injected beam (see Figure 4.1, Figure 4.3 and Section 4.1.2 (d) for definition of x,x’).
The values of (x x’) that were used to generate the trajectories shown in Figure 4.3 are shown also on the same Figure 4.3. Each of the H- trajectories is tangent to the “bumped-closed orbit” (black line) and this has been achieved by adjusting the initial conditions (x,x’) of the H- injected beam.
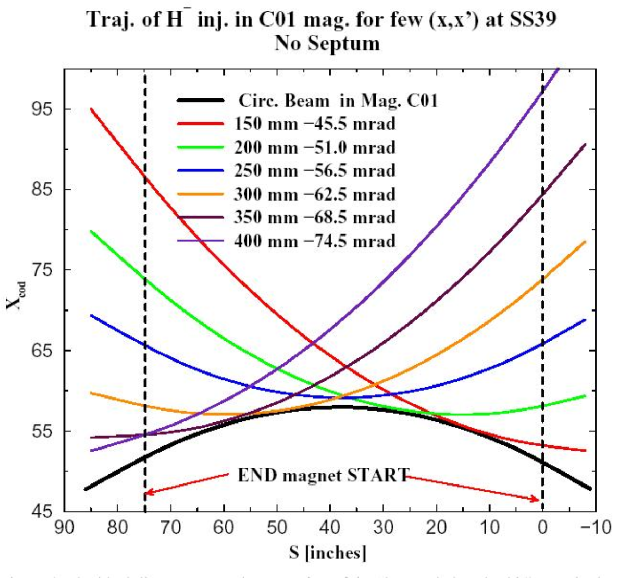
From all the possible H- trajectories shown in Figure 4.3, the H- trajectory that corresponds to the (x,x’)=(250 mm, -56.5 mrad) has been selected as the “injection trajectory”. Both, the closed orbit calculations for the derivation of the Xcod as a function of distance, and the various H- trajectories shown in Figure 4.3 have been calculated using the code AGS_BATE[15]. This code is a modification of the code BEAM. The code uses the experimentally measured fields at the median plane of the AGS magnets to ray trace the charged particles. The code also provides transport matrices at any location along a trajectory and beam parameters at any location along a closed orbit. Detailed description of the code and additional references are given in reference [16]. In addition to the “local-bump” of the closed orbit discussed above, a set of two fast time varying bumps (horizontal and vertical) of the closed orbit my also be superimposed to help optimize the “beam painting” of the AGS phase space.
4.1.4 Beam Parameters at the H- Injection Point
In order to minimize the emittance blow-up of the injected H- beam, the beam parameters of the injected H- beam must match those of the circulating beam at the “injection point”, which is chosen to be the location of the stripping foil.
The beam parameters of the circulating beam in AGS at the “injection point” have been calculated at the injection beam energy of 1.2 GeV, using the computer code AGS_BATE[15] and these beam parameters appear in Table 4.1.
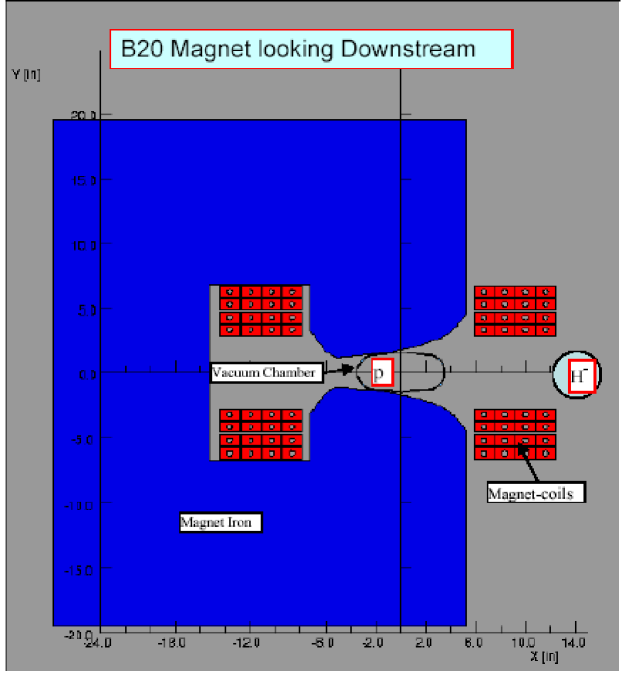
The proximity of the H- injection line to the AGS main magnet B20, shown in Figure 4.4, suggests that the fringe field of the B20 magnet will affect the beam ellipse of the H- injected beam. Therefore, the fringe field of the B20 magnet as well as that of the C01 magnet (see Figure 4.1) are included in the calculations of the first order transfer matrices (RH,R which define the beam transport between the “Matching point” (the point (x,x’) shown in Figure 4.1 is defined in this note as the “matching point”) and the “Injection point”.
Using the code AGS_BATE[15] we have calculated the first order horizontal and vertical transport matrices (RH,R between the “Matching point” and “Injection point”. These matrices appear below and correspond to the central trajectory with coordinate at the “matching point” (x,x’)=(250 mm,-56.5 mrad).
In order simplify the matching of the beam parameters of H- injected beam to those of the circulating beam we have calculated the beam parameters at the “Matching point” (see Table 4.1) by using both, the values of the beam at the “Injection Point”, and the values of the transfer matrices RH and RV above.
| Location | [m] | [m] | ’x | [m] | ||
|---|---|---|---|---|---|---|
| Injection Point | 28.0 | -1.00 | -1.25 | -0.05 | 8.00 | 0.43 |
| Matching Point | 26.6 | -1.32 | -1.00 | -0.10 | 16.10 | 1.75 |
4.1.5 H-, H0 and Electron Beam Dump
The H- injected beam will not be stripped totally of its electrons by the stripping foil which is located at the injection point. Therefore the emerging beam from the foil will consists of:
- a.
-
protons (H which constitutes the circulating beam to be accelerated to 28 GeV.
- b.
-
H- ions that did not loose any electrons passing through the foil.
- c.
-
H0 neutral particles that lose only one electron.
- d.
-
electrons ().
Except for the fully stripped H- injected beam, which is the circulating proton beam, the rest of the particles (H-, H0 , and the electrons) must be “dumped” into a material which can absorb the deposited energy. The different rigidity of these three particles species, may require a specially designed “beam dump”. Similar problems of how to dump the partially stripped H-beam have been encountered in the 200 MeV H-injection in AGS[14], and the 200 MeV H-injection in the Booster[18]. A study for the design of the beam dump of the partially stripped 1.2 GeV H-beam is required.
4.2 Extraction from AGS at 28.0 GeV
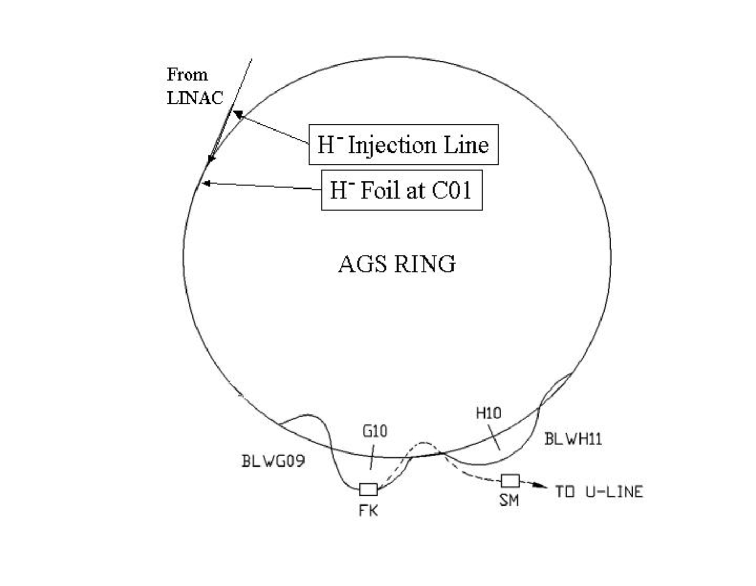
At present the AGS synchrotron is equipped with a Fast Beam Extraction (FEB) system which is used to extract the circulating bunched beam in AGS to the AtR beam transfer line. The FEB system will be used for the extraction of the 28 GeV high intensity proton beam which will irradiate the “neutrino production” target. A section (the U-line) of the AtR beam transfer line which is used to transfer the extracted beam from AGS into the Relativistic Heavy Ion Collider (RHIC) will also be used to transport the 28 GeV proton beam to the “neutrino production” target. Detailed description of the FEB system has been presented in previous technical notes [16],[17] therefore in this report we will only outline the main features of the (FEB) system.
4.2.1 Layout of the Extraction Region
The main steps of the procedure for fast beam extraction are outlined below:
- a.
-
Beam acceleration from injection energy to 28 GeV.
- b.
-
Generate two “local beam bumps”, one (BLWG09 see Figure 4.5) which displaces the circulating beam into the C-type Fast kicker magnet (FK) which will “kick” the beam out of the AGS, and the other (BLWH11 see Figure 4.5 ) which displaces the circulating beam close to the H10 septum magnet (SM) which is located downstream from the G10 kicker at 270o phase advance. It is advantageous to use a C-type Fast kicker magnet which is displaced from the ideal orbit, instead of a full aperture kicker
- c.
-
The circulating beam bunches pass through the aperture of the G10 Fast kicker, and are kicked by the G10 Fast kicker which displaces the beam bunches on the other side of the H10 septum, into the U-line (see Figure 4.5 ) which will be used as the first section of the beam transport line to the “Neutrino production” target. A schematic diagram of the FEB system in AGS is shown in Figure 4.5. In this figure shown are:
(i) the BLW_G09 and BLW_H11 “local-bumps”;
(ii) the Fast Extraction kicker (FK);
(iii) the Beam Extraction Septum Magnet (SM);
(iv) and the beginning of the U-line.
4.2.2 Extraction Devices
In this section we describe briefly the function of the devices which are used for the FEB in the time order the devices are involved in the fast beam extraction.
-
1.
The two 3/2 “local beam bumps” BLWG09 and BLWH11 (see Figure 4.5 ) Each of the bumps is generated by back-leg (BLW) windings on the return iron of specified main magnets of the AGS.
- a.
-
The BLWG09 “beam-bump” which displaces the closed orbit inside the aperture of the G10 fast kicker that is displaced radially from the ideal orbit on the outside of the AGS ring, because it has acceptance large enough to accept the size of the 28 GeV beam but not large enough to accept the size of the injected beam. A proposed “full-aperture” kicker which can accept the size of the injected beam, does not need to be displaced radially nor does the beam need to be bumped by the BLWG09 into the kicker. The large gap of a “full aperture” kicker, however, will increase the power supply requirements of the fast kicker.
- b.
-
The BLWH11 “beam-bump” which displaces the closed orbit of the circulating beam near the septum of the H10 extraction magnet (SM). This displacement of the beam closed to the septum magnet reduces the strength requirements of the kicker to displace the beam into the other side of the septum and into the aperture of the magnet.
-
2.
The G10 fast extraction kicker (FK Figure 4.5 ) which kicks each circulating beam-bunch into the aperture of the septum magnet.
-
3.
The H10 extraction septum magnet (SM Figure 4.5 ) which extracts the beam bunch from the AGS into the U-line.
4.2.3 Beam Parameters at the Extraction Point
The extracted beam to be transported to the “neutrino production” target will use part of the AtR transport line, the U-line which will be extended to the production target. The beam transport line is discussed in more detail in one of the chapters of this report. In this section we only report the beam parameters of the extracted beam (Table 4.2 at the extraction point of the transport line. The knowledge of the beam parameters of the extracted beam at the beginning of the transport line are required for the design of the transport line. Details of the method which is used to calculate the beam parameters and the calculation of the beam parameters are given in references [16] and [19].
| Location | [m] | [m] | ’x | [m] | ||
|---|---|---|---|---|---|---|
| Extraction Point (Theory) | 37.5 | -4.1 | -1.5 | -0.13 | 6.5 | 0.85 |
| Extraction Point (Measr.) | 36.7 | -4.5 | 7.7 | 1.2 |
5 Beam Transport to Target
The extracted beam will enter into the existing U-line of the AGS. For aiming the neutrino beam to the Homestake site in South Dakota, the proton beam has to bend 68 degrees and 4 seconds horizontally and 11.26 degrees downwards. Figure 5.2 shows the proposed layout of the beam transport to the neutrino target at the Homestake site.
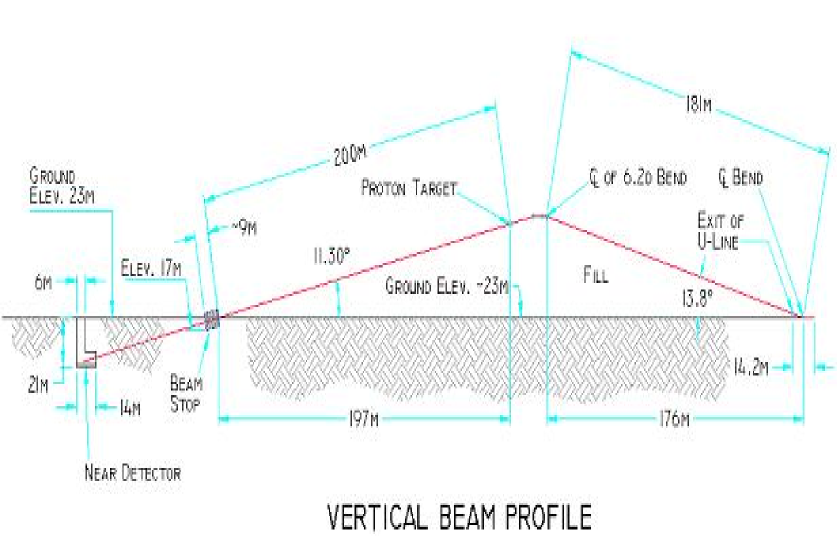
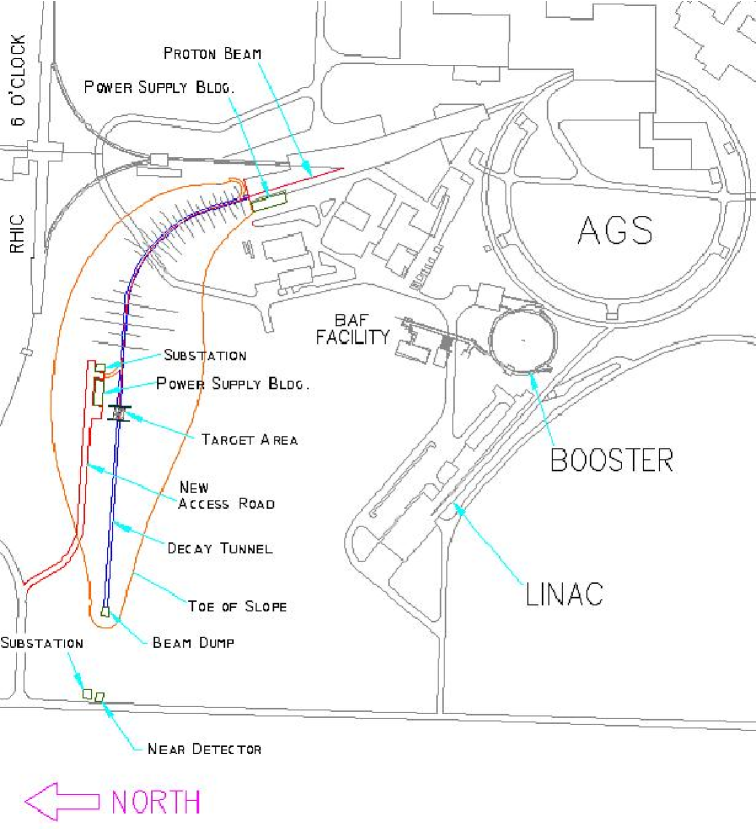
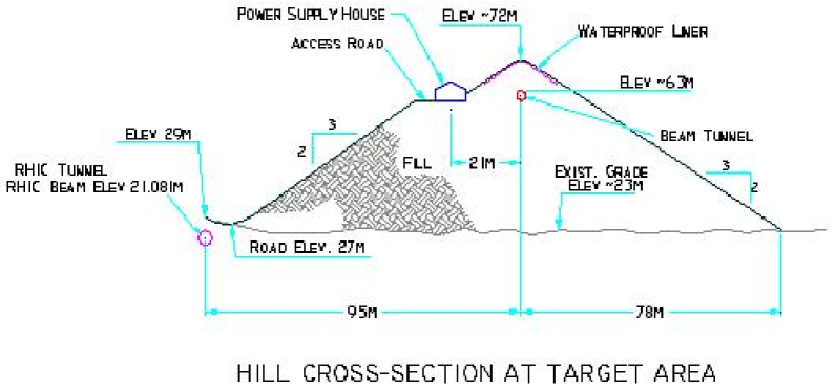
To aim 11.26 degrees downwards, the proton beam has to climb up a high hill to the target and decay channel. The hill arrangement keeps the target and hadronic decay channel well above the water table of Long Island. Figure 5.1 shows the sketch of the hill. Figure 5.3 shows the cross section of the hill.
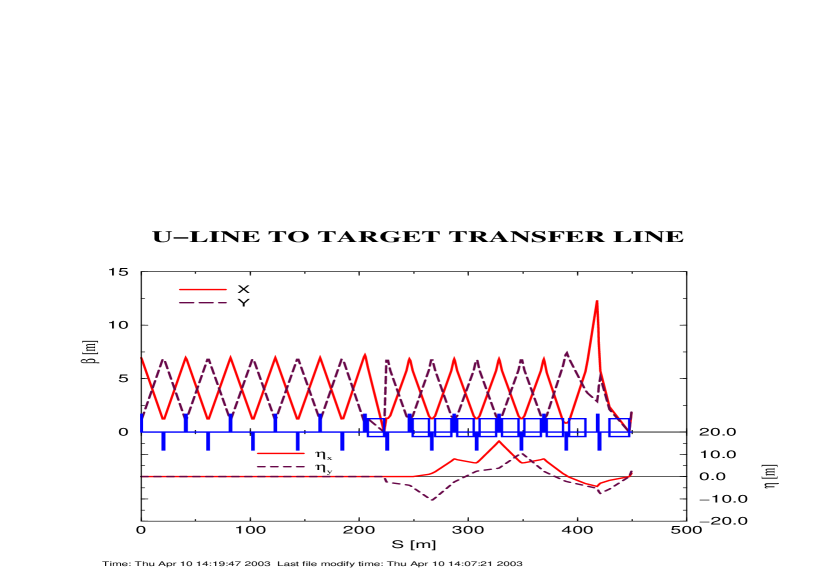
The beam is bent vertically upward by 11 degrees with help of one cell with phase advance of 90 degrees. In the vertical incline plane, beam is then bent 68 degrees and 4 minutes horizontally in four cells with a phase advance of 90 degrees. Finally, the beam is bent downwards by 11.26 degrees; aiming it towards Homestake, South Dakota. Before the final bend, the line uses one doublet to focus the beam with 2 mm radius (rms) on target. This arrangement results in an achromatic system in both horizontal and vertical planes. The transport system uses a 4Q16 existing quadrupole and dipole for the vertical bend at 1 degree/meter and for the horizontal bend at 0.5 degree/meter. Figure 5.4 shows the and functions for the beam transport to the target from the U-line (ULTBT).
6 Target/Horn Conceptual Design
6.1 Background and Overall Issues
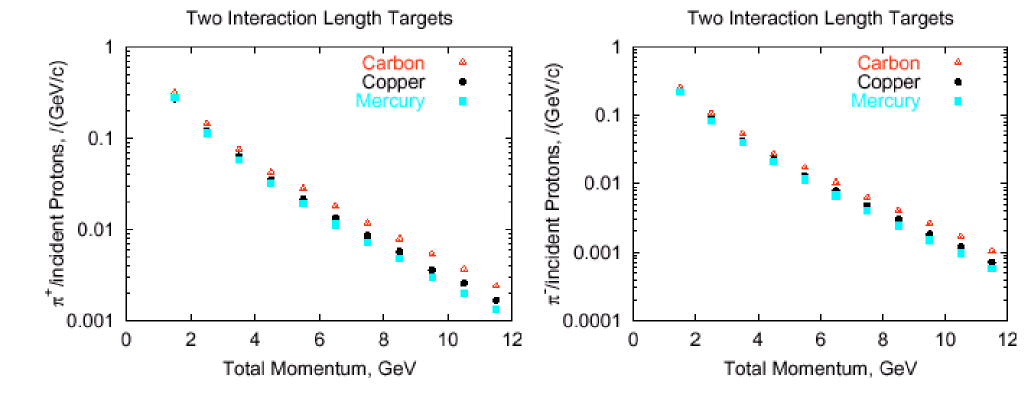
To achieve the 1 MW upgrade option of the proton driver at BNL serious consideration must be given to both the target material and selection and horn configuration.A solid target is a viable choice for a 1 MW beam. Low and high Z materials have been investigated both in terms of the material endurance as well as the feasibility of target/horn configuration. Results of the parametric studies on material choices regarding pion production are shown in 6.1.
A graphite-based carbon-carbon composite is selected as a target material both for its low-Z and thermo-mechanical properties. Various aluminum-based materials are being considered for horn conductors, such as 3000-series and 6061-T6 aluminum, that will combine low resistivity, high strength and resistance to corrosion and micro-cracking. According to the baseline design the following beam parameters are guiding the material choice, horn and target design, cooling schemes, etc.
| Proton Beam Energy | 28 GeV |
|---|---|
| Protons per Pulse | 8.9x10¹³ |
| Average Beam Current | 35.7 A |
| Repetition Rate | 2.5 Hz |
| Pulse Length | 2.58 sec |
| Number of Bunches | 23 |
| Number Protons per Bunch | 3.87x10¹² |
| AGS Circumference | 807.1 m |
| Bunch Length | 40 ns |
| Bunch Spacing | 60 ns |
| Normalized Emittance-X | 100 mm-mrad |
| Normalized Emittance-Y | 100 mm-mrad |
| Longitudinal Emittance | 5.0 eV-sec |
| Target Material | carbon-carbon composite |
| Target Diameter | 1.2 cm |
| Target Length | 80 cm |
| Horn Small Radius | 7 mm |
| Beam Size (Radius) on Target | 2 mm (rms) |
| Horn Smallest Radius | 6 mm |
| Horn Large Radius | 61 mm |
| Horn Inner Conductor Thickness | 2.5 mm |
| Horn Minimum Thickness | 1 mm |
| Horn Length | 217 cm |
| Horn Peak Current | 250 kA |
| Current Repetition Rate | 2.5 Hz |
| Power Supply Wave Form | Sinusoidal, Base Width 1.20 ms |
In the process of designing the horn/target system the following key elements were closely addressed:
-
•
Heat generation and removal from the target/horn system
-
•
Target thermo-mechanical response from intercepting energetic, high intensity protons
-
•
Irradiation and corrosion effects on materials
-
•
Horn/target integration issues
-
•
Horn mechanical response and long term integrity (irradiation, corrosion and thermal fatigue)
-
•
Beam windows integrated in the system to (a) separate the vacuum space in the transfer line from the final beam run to the target and (b) to maintain the coolant around the target in a close-system loop.
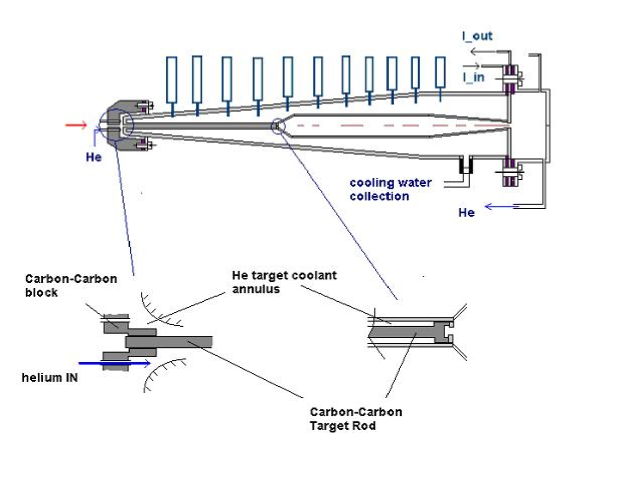
6.2 Description of the Integrated System
Figure 6.2 is a conceptual description of the target and horn integrated system being considered in this study. The 1.2 cm diameter carbon-carbon composite target is fully inserted into the inner horn conductor allowing a 1 mm annular gap between the target and horn surfaces for the helium coolant to flow and remove heat. Shown in the front of the target is a carbon-carbon beam “collimator” or baffle that has dual role. Specifically, it provides the upstream target support and includes the channels that will force the coolant flow into the annular space. Further, it plays the role of the beam diffuser in the event the proton beam strays off beam axis and thus protects the horn. The size of this baffle needs to be optimized to play that role effectively. In addition to the above two functions, the front end of the target will be maintained at a low temperature which will help in removing heat deposited on the target by conducting into the mass of the baffle.
It is envisioned that the baffle/target arrangement will be a monolithic structure for system optimization. At the downstream end of the target, a special design allows for the forced coolant to leave the horn’s neck-down section and also provides a simple support for the target in the current design. The option of maintaining the target as a cantilever beam (only supported from the upstream end is being considered.
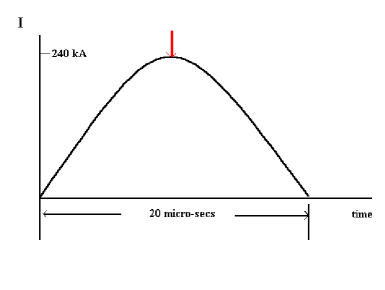
The horn, made out of an aluminum alloy, has a diameter in its narrowest section of 1.4 cm while the thickness over that section is 2.5 mm. The thickness of the inner conductor reduces to 1 mm downstream of the neck-down section. As shown, the current supply and return take place at the downstream end of the horn. The baseline design calls for a 250 kA peak current to be achieved with a half-sine wave shape that has a base of 20 s with a repetition rate of 2.5 Hz. The magnetic pressures and joule heating generated in the conductor are the driving forces in the optimization of the horn conductor. While heat generated in the narrowest section of the horn will be partly removed by the fluid flowing in the annular space, heat generated in the skin of the current surface will be being removed by spraying a coolant through a set of optimally positioned jets. Two options are being considered, namely, the spraying of water and cold helium gas. The schematic of Figure 6.2 depicts the arrangement with water-cooling. The choice of cooling, as discussed later in detail, is significant in maximizing the useful life of the aluminum material in that environment.
Under consideration, and shown in Figure 6.2, is a downstream thin window whose role is to hold the target coolant in a closed system. This way the coolant is collected, cooled and returned to the target upstream to be re-ejected into the annular space. The key issue with such window is the fact that it will see a significant portion of the incoming beam power ( 80%) and will be subjected to high thermo-mechanical stress conditions. Further, the presence of additional material in the flight path of pions generated and focused by the horn is a further impediment. However, since the only role of such window is the prevention of coolant to escape from the closed envelope, the materials considered are low-Z (for minimal interaction with secondary particles or generation from intercepting the beam protons) and minimal heating, which combined with the small thickness will minimize the problem further.
6.3 Evaluation of Heat Removal Principles
As part of the design process, a number of cooling schemes have been considered for the integrated system of horn and target. Utilizing past experience on horn/target system performance we arrived at the current baseline scheme which calls for a de-coupling of the target from the horn with regards to their cooling and the use of helium gas as the fluid to remove the heat from the target.
Specifically, as shown in Figure 6.2, cold helium is forced past the surface of the CC target at sufficient velocity to ensure that the heat generated per beam pulse is removed before the next pulse arrives. The helium flowing in the annular space is also responsible for removing some of the heat generated in the horn inner conductor that surrounds the target. This heat, as will be discussed in detail, originates in three separate mechanisms, namely, joule heating from the flowing current, energy deposition due to the proton beam interaction with the target, and heat by radiation from the surface of the CC target. Further, heat generated in horn conductors (inner & outer) due to current and beam is removed with spraying of cooling water over the inner horn surface. Since different mechanisms, namely heat convection, conduction and radiation between target and horn, will be at work, the heat balance of the overall system as it reaches an operating temperature will be addressed by the use of a sophisticated finite element model which is described in a later section. As a first step, however, and in order to assess the heat removal capacity of surfaces in the system, a set of basic calculations are performed that will indicate whether the adopted schemes are feasible. Furthermore, the results of this preliminary analysis will serve as a benchmark and check for the finite element simulations. The following analysis addresses the joule heating in the horn, the radiation heat exchange between the target and the horn conductor, the heat removal capacity of the flowing He in the annular space and, the heat removal capacity/requirement of the water spray inside the horn.
6.3.1 Joule Heating Estimate in the Horn
Given the current pulse structure shown in Figure 6.3 with an effective frequency of 0.025 MHz, the current is expected to flow over a skin depth of the inner surface of the inner conductor. Key to the evaluation of joule heating is the estimation of the skin depth for the parameters of this study.
The skin depth for a horn conductor made out of 3000-series aluminum, for example, with resistivity = 4.2 mohm-cm, is calculated based on the following relations:
| (6.1) |
where, f = 0.025 MHz, k1= [/]1/2 and 1.724 mhoms-cm is the resistivity of copper.
From these relations one obtains,
| (6.2) |
By focusing attention on the neck-down section of the inner conductor where conditions are most severe, the joule heating generated by the current pulse and the anticipated temperature rise is estimated. The current density is a function of the penetration into the conductor according to the relation:
| (6.3) |
such that,
| (6.4) |
where, Jo = 689 kA/cm2 is the current density at the conductor surface and z is the penetration and dA = 2 (Rout– z) dz, where Rout = 0.95 cm. The joule heating generated by the pulse per cm-length of the inner conductor is
| (6.5) |
where, J(z,t) = J(z) sin(t/20s). By carrying out the integration above one obtains,
| (6.6) |
The total power generated in the neck-down section of the horn alone is estimated to be:
| (6.7) |
The peak temperature rise in the conductor, experienced at the inner surface where the current density is at maximum during each current pulse, is estimated to be
T = 7.4oC.
6.3.2 Estimate of Radiation Heat Transfer
Given that the CC target will be operating at much higher temperatures than those of the horn ( 840 oC) some heat will radiate from the target surface to the surface of the horn over the neck-down section. Assuming that the surface temperature of the aluminum is maintained at 90 oC, then the radiating heat flux can be estimated from the relation:
| (6.8) |
where, x 10-8 W/m2 – K4, = 0.98, = 0.19
Based on the above parameters, the heat flux from the target surface is approximately /A =11916 W/cm2 and the total heat transfer from the target to the horn inner conductor = 11916. Atarget = 360 W. As seen the amount of heat exchanged by heat transfer is quite low. However, if the surface of the horn seeing the target is treated in order to increase its emissivity to = 0.19, then the heat transferred to the horn amounts to 1.363 kW.
6.3.3 Target Cooling Calculations
Given that the amount of heat transferred by radiation alone from the target to the horn is quite small, the primary mechanism is heat removal by forced convection of cold He in the annular space between the target and the horn. The key elements in assessing how feasible such a mechanism is are: the operating temperature of the target; the temperature of the cooling fluid; and the heat generation rate in the volume of the target that needs to be removed. These working parameters will establish the velocity of the coolant necessary to remove the generated heat. Using as a baseline, the energy deposition in the volume of the target for a 2 mm RMS beam spot, (which amounts to 7.1 kJ/pulse or 17.75 kW) as an acceptable average operating temperature of surface of the target Ts = 800oC and a temperature of the helium of 144 K, the flow velocity is estimated as follows,
| (6.9) |
One can estimate the necessary film coefficient from the above relation to be 618 W/m2-C. By relating the film coefficient to the Nusselt number NuDe
| (6.10) |
where, = 0.14 W/m-K and De = 0.014-0.012 = 0.002 m (equivalent annular diameter). By relating the Nusselt number to the Reynold’s number NRe through the relation
| (6.11) |
where Pr is the Prandtl number, the Reynolds number is estimated to be 3400. Reynolds number on the other hand is related to the velocity of flow Uf through,
| (6.12) |
where is the dynamic viscosity of He ( = 37.1 x 1 0-6 m2/s). From the above relations it is estimated that a flow of He with velocity Uf = 65 m/s is required.
These calculations, however, do not account for the heat moved away from the target by radiation and conduction. The later takes place near the front of the CC target by maintaining the block of the baffle (or collimator) that holds the target in place at a low temperature.
6.4 Heat Removal from Horn Neck-Down Through Forced Convection
In this section estimates are made of the required convective heat transfer capacity of He in the annular space to enable the removal of all the heat generated in the volume of the 86cm-long neck-down section. The best estimates, thus far, of the heat deposited over that volume are as follows:
Joule Heat = 1.335 kW
Heat from beam interaction with target = 36% of 17.75 kW = 6.39 kW
Radiation from target = 1.363 kW
TOTAL = 9.088 kW.
The high value of energy deposited in that section alone from beam-target interaction needs further verification. Independent analysis is currently being performed to verify this energy deposition. The available area of the horn surface with radius Ri = 0.7 cm is Ai = 0.0352 m2. This leads to a surface flux of
| (6.13) |
With forced helium temperature of 144 K and surface temperature of the horn 90o C, the required film coefficient is hf = 1179 W/m2-C. Following the procedures of the previous section that relate the convective film coefficient with the Nusselt and Reynolds numbers, one arrives at a flow velocity required to remove the heat in the neck-down section equal to UHe = 135 m/s.
6.4.1 Heat Removal from Horn Inner Surface by Coolant Spray
Option I – RAW Spray
The baseline method utilized to remove the generated heat over the entire inner surface (current side) as well as the energy deposited throughout the horn from beam-target interaction is by spraying water through special nozzles that penetrate the outer conductor. While this approach has been used extensively to cool horns in the past (and in many instances to cool the target as well through conduction across the horn inner conductor), there are some issues associated with such approach, namely, the potential acceleration of corrosion of the aluminum surface coming in contact with water and the fatigue failure through propagation of surface cracks plus the fact that water within the horn will be in the path of pions. The attempt to maintain the aluminum surface temperature, when in contact with water, below 100o C (based on experience from the reactor industry) in an attempt to extend the life of the horn, results in larger quantities of water being sprayed against the conductor inner surface.
To estimate the required spraying capacity, attention is again focused on the inner conductor which will experience higher joule heating and gamma-ray heating. Assuming that the spraying jets are positioned in such a way that the entire inner surface experiences forced flow sweeping by (resembling a cylinder in cross-flow), the following forced convection relations apply,
| (6.14) |
where, NuD = hD/k is the Nusselt number and h is the effective film coefficient.
Assuming that the water jets force a flow with a free velocity of U = 2.5 m/s at a temperature of Twater = 20o C and that the conductor surface is maintained at a temperature of Twall = 80o C, the following fluid properties apply: Reynolds number ReD = U D/ = 87963, Pr = 3.6, = 0.0054 cm2/sec and k = 0.645 W/m-K.
Substitution into the above relation leads to,
| (6.15) |
And to an effective film transfer coefficient of: h = 12485 W/m2 –K.
By relating the heat flux from the conductor surface to the convective heat transfer,
| (6.16) |
the heat transferred through the surface area A is q = 38.5 kW. Clearly this cooling scenario can satisfy the needs for removing the heat from the inner surface of the conductor even for operations that will increase the heat deposition in the conductor.
OPTION II – Helium Spray
In an effort to eliminate the RAW altogether, an attempt is made to remove excess heat by spraying He onto the surfaces instead of water. To estimate the capacity of such system, we again focus on the neck-down section that represents a horizontal cylinder of radius Ro = 9.5 mm and length L = 86 cm. The relations that apply are those of gases flowing normal to a single cylinder. The Reynolds number for this configuration is NRe = Um Do/ while the Nusselt number is related to it by the empirical relation
| (6.17) |
Where C and m are parameters that are based on the range of the Reynolds number. For a free velocity of He (after leaving the nozzle and before impinging on the surface) of 30 m/s and temperature THe = 144 K, while maintaining the aluminum surface temperature to 90o C, one can estimate NRe = 1536 and,
| (6.18) |
Which leads to hf = 270 W/m2-C.
Using the relation: q/Ao = hf (To – T where Ao = 0.0513 m2, the heat transfer capacity of the inner surface is approximately 3000 W. Any increase of the velocity of He coming out of the nozzle or a potential reduction in the heating of the horn from beam-target interaction, will make the cooling scheme that depends entirely on He sufficient to remove the heat deposited on the horn. Further experimental studies are needed to assess the potential of this option.
6.5 Target Consideration
Material Selection – Issues
The baseline material for the superbeam experiment is a special Carbon-Carbon composite. It is a 3-D woven material that exhibits extremely low thermal expansion for temperatures up to 1000 oC. For higher temperatures it behaves like typical graphite. Its thermal expansion behavior is significant in the sense that the thermo-elastic stresses induced by intercepting the beam will be quite small, thus extending the life of the target. The Table 6.2 below lists the variation of expansion as a function of temperature.
| Temp. | % Elongation |
|---|---|
| 23 oC | 0% |
| 200 oC | -0.023% |
| 400o C | -0.028% |
| 600o C | -0.020% |
| 800o C | 0% |
| 1000o C | 0.040% |
| 1200o C | 0.084% |
| 1600o C | 0.190% |
| 2000o C | 0.310% |
| 2300o C | 0.405% |
In addition to the low thermal expansion, the material is stronger than typical graphite, reaching compressive strengths 120 MPa.
Experience on this material has been acquired as a result of the BNL E951 experiment and its use in the SNS foil scrapers. Some of the findings, relevant to this study, are discussed in a later section.
The long term behavior of this special material in an irradiation environment is not known. There was an initiative, as part of the E951 experiment, to irradiate this material to dpa levels that could be comparable to running times that are approaching anticipated lifetimes for this experiment. While this particular material was not irradiated, it is anticipated, as part of the R&D effort, to be tested in the future to enable the assessment of its integrity after the accumulation of several dpa.
Beam Energy Deposition and Heat Removal
In the current option, the target is an 80 cm long cylindrical rod with two competing diameter sizes (6 mm and 12 mm). The 6 mm diameter target is chosen to intercept the 100-TP 1 mm rms proton beam and the 12 mm for the 2 mm rms beam. There are advantages and dis-advantages in both choices. When intercepting the 1 mm beam, the total energy deposition in the target per pulse amounts to about 5.1 kJ. This corresponds to a peak temperature rise of about 1000 oC in the center of the target. With the larger beam spot (2 mm rms) the total energy deposited and converted to heat in the target is 7.3 kJ per pulse with peak temperature rise of about 270 oC. Heat will be removed from the target through forced convection of helium past the outside surface. While the 2 mm beam/12 mm target diameter option appears to be the optimum, the fact that the heat within the target will have to travel a longer distance to reach the surface and be removed, may make the 1 mm beam option attractive.
Engineering calculations and detailed finite element analysis were employed to qualify the two options while taking into consideration the special target/horn configuration. Figure 6.2 depicts the current thinking of system layout. Specifically, the target rod is placed within the neck-down section of the inner horn conductor forming an annular space with the inner surface of the conductor. The long target is supported at both ends. In the front, a specially machined carbon-carbon block holds the target while at the same time it allows for the beam to go through without intercepting it. In addition the this special block allows for special nozzles that will force helium into the annulus for target cooling and it provides a conduction path in the vicinity of the target section that is heated the most. Further, the block will play a diffusing role in the event of a beam straying from center. At the far end, the target includes four special fins that allow it to rest on the inner surface while allowing the helium to pass through. A special notch on the inner conductor will prevent the target from moving further into the horn.
Calculations of heat removal of independent heat transfer mechanisms while using the basic principles were performed and are presented in an earlier section. The engineering calculations for removing the deposited energy revealed the following: Since the target is to be decoupled from the horn, the forced helium (and the conduction near the front of the target) must remove all the heat that amounts to 18.25 kJ for the 2 mm rms beam/12 mm diameter target. The energy deposition varies along the beam and so the engineering calculations based on the total energy in the volume can only provide a rough estimate. Analytic calculations are expected to refine the engineering numbers. Specifically, to remove the 18.25 kJ from the surface of the target through forced convection, a helium temperature of 5 oC and a target operating temperature of 840 oC were assumed. The heat transfer calculations (using detailed finite element analysis) reveal that helium flowing continuously in the annulus with velocity near 40 m/s will, in conjunction with radiation to the horn surface and conduction near the front of the target, enable the removal of all the heat deposited in the target.
The detailed finite element model incorporated both the target and the horn in one single system. The only connection between the horn and the target was provided by the radiation exchange of the target surface and the surface of the horn inner conductor. Further, the two surfaces shared similar values of convective heat transfer due to the flowing helium in the annulus. In order for the overall system to achieve a “steady-state” (or base operating temperatures) throughout a transient analysis with all the heat transfer mechanisms in place was performed.
Shown in Figure 6.4 are the transient temperatures at the hottest point in the center of the CC target and at the surface that result from a 100 TP/28 GeV/ 2 mm RMS proton beam on target. As mentioned previously, the temperature rise per pulse in the target is of the order of 270o C. For a 1 mm RMS beam spot on a 6 mm diameter target the temperature rise per pulse is 1000o C, as shown in Figure 6.5. The total energy deposited on the target, however, is only 5.1 kJ per pulse as compared to the 7.3 kJ for the 2 mm RMS beam. While the benefit in smaller energy deposition would be welcomed, the temperatures in the CC target will be in the regime of higher strains and the resulting stresses will exceed the material strength.
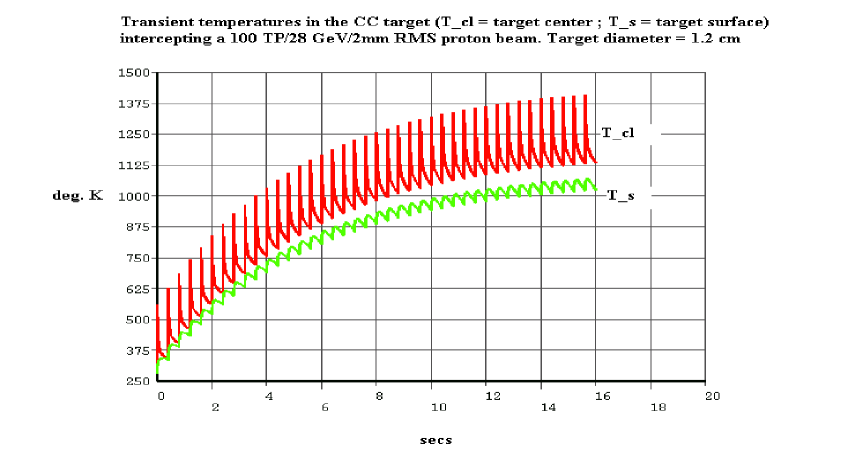
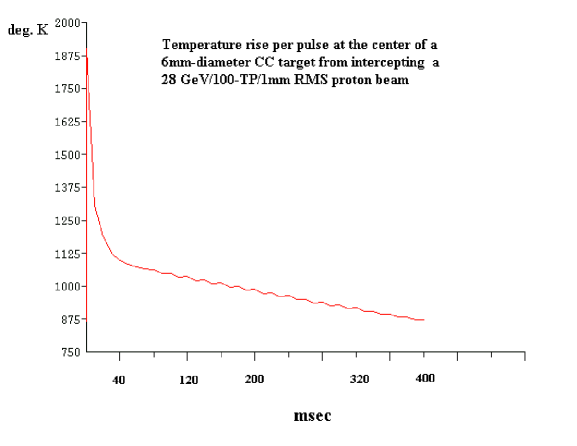
Evaluation of the Option with the Target & Horn in Contact
A scheme used in past experiments involves solid targets and horns and allows for the removal of heat from both the target and the horn by cooling the outer face of the horn conductor (current side) through massive water spray. In this arrangement, the solid target is housed within the narrowest inner conductor and through surface contact it passes the heat generated by the beam/target interaction onto the conductor. The heat travels by conduction to the opposite face (current side) where it is removed by the forced cooling. To assess its potential application in this experiment, the system was analyzed by considering a perfect contact between the two systems (CC target and aluminum horn) and the required heat removal capacity was estimated.
In performing this analysis, the following key points are kept in mind, namely:
-
•
Energy deposition and thus heat generated in the target in this study are almost an order of magnitude higher than the previous exercises;
-
•
The repetition rate in this study is also higher;
-
•
The goal in this study is to hold the aluminum temperatures as low as possible for surfaces that are in contact with water.
An additional concern is the fact that, at the operating temperatures of the target, it will be impossible to maintain perfect contact between the surfaces. This will inevitably lead to the formation of hot spots and the subsequent melting of the aluminum.
Figure 6.6 depicts the two materials in contact as they were modeled in the finite element analysis) and the temperature distribution when the aluminum surface is being cooled with an effective film coefficient of 1000 W/m2-C. As seen in Figure 6.6, a large section of the aluminum conductor (only a segment is shown in the figure) operates at temperatures near the melting point of aluminum (660o C). A parametric study revealed that in order to maintain temperatures in the aluminum that are below 100 C would require a film coefficient of 3000 W/m2-C. Such a heat transfer coefficient will be almost impossible to achieve in such setting. However, even if that was achievable, the issue of hot spot formation cannot be eliminated since the two materials expand differently. Thus this cooling method is not suitable here.
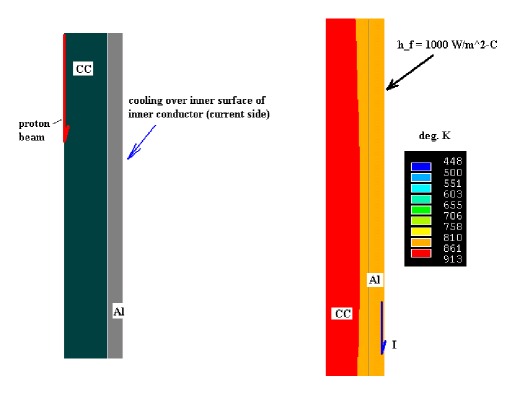
Thermo-elastic target Stresses
Figures 6.7 and 6.8 depict the dynamic stresses in the target intercepting the train of six micro-bunches that comprise each 100 TP pulse. The resulting equivalent stresses, estimated for a pulse which arrives when the target has achieved a “steady-state” operating temperature (840o C) peak at 38 MPa. Such stresses are well below the strength limits of 120 MPa. However, as it will be discussed in the following section, experimental measurements have shown that the material exhibits some dynamic inertia during fast beam energy deposition that is expected to slightly increase the anticipated stress levels that are based on the thermal expansion properties which, in turn, are estimated with slow heating of the material.
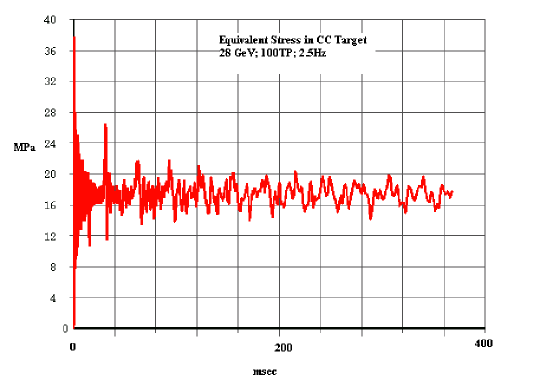
As a result of beam optimization, the new parameters call for a beam spill of 23 40 ns-long micro-bunches spaced by 60 ns. While calculations for such case have not been performed, it is expected that the thermal shock stresses will experience some relaxation between micro-bunches thus driving the stresses even lower.
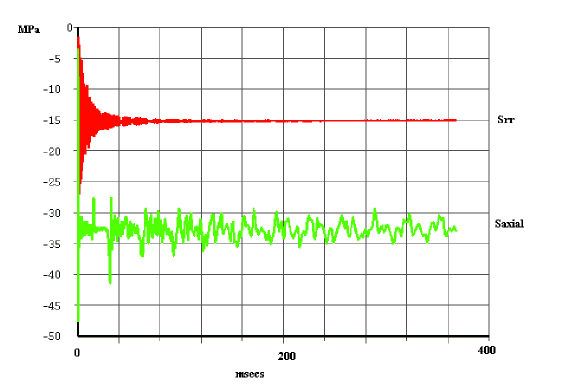
Assessment of Long-term Target Survival
Given that little is known about the behavior of this target material when it is highly irradiated, it is envisioned that, as part of the R&D, representative target material will be exposed to levels of dpa anticipated to be seen during the lifetime of the target and the its long-term integrity be assessed.
Verification of CC Mechanical Properties
While the chosen operating temperatures (including the temperature rise) are still within the very low thermal expansion regime and the expected thermal stresses and strains are within the safety envelope, some questions remain regarding the response of the target material during fast deposition of heat. In the course of experiment E951, 1 cm diameter carbon-carbon targets (along with ATJ graphite) were exposed to the 24 GeV AGS beam and their response was recorded on the outer surface in the form of axial strains. Figure 6.9 below shows the target arrangement. Figure 6.10 depicts strains recorded on the surface of the CC target along the axial dimension. While these strains are, by comparison, much smaller than those recorded on the ATJ graphite target with same beam parameters (Figure 6.11), the generated temperatures from the beam energy deposition were very small to cause these strain amplitudes (based on the material property data sheet). It appears that the material responds dynamically during very rapid energy deposition. For the 2 mm rms beam the anticipated thermo-mechanical stresses are well below the material strength limits even with a potential increase in stresses due to inertia in the material (as shown in Figure 6.10). It is anticipated that further tests of intense proton beams on such targets will shed light in verifying the true thermo-mechanical response of this special material.
Figure 6.12 depicts the predictions in axial strain on the ATJ graphite target at a location similar to the location of the two fiber-optic strain gauges of Figure 6.11. The predictions were made using similar transient finite element methodologies as the one utilized in the analysis of the CC target and horn. It is clear that these computational techniques can provide an excellent estimate of the actual system response.
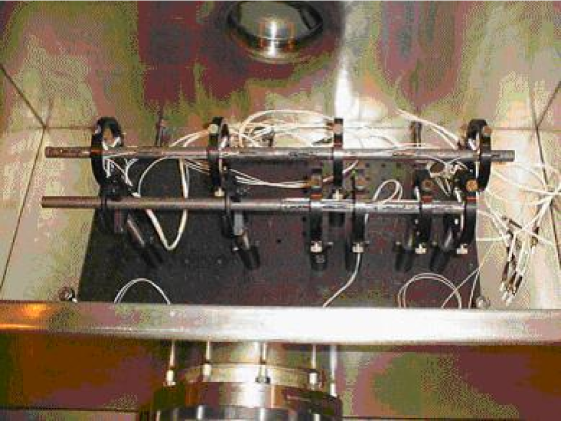
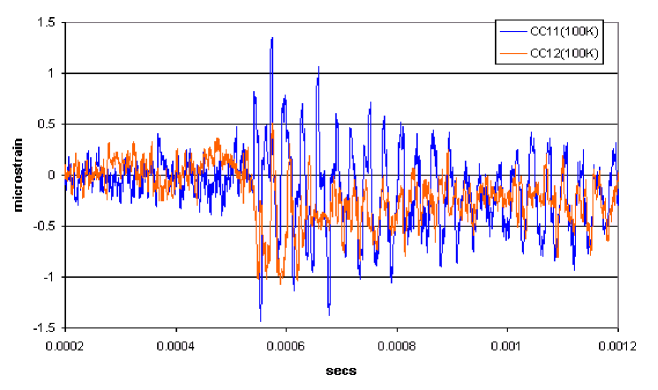
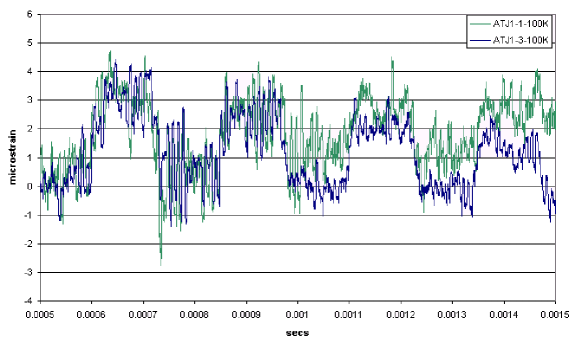
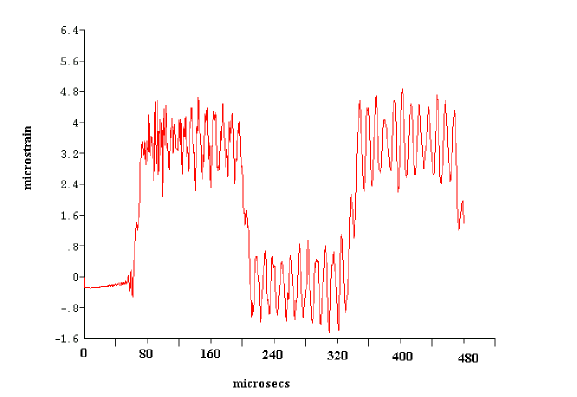
6.6 Horn Design Issues
Figure 6.2 depicts the first horn made of aluminum and with a thickness in the neck-down section of the conductor is 2.5 mm. The radius of the inner conductor for the following calculations was assumed to be 7 mm. The issues associated with the horn are the following:
-
•
Joule heating in the inner conductor
-
•
Energy deposited on the horn due to beam-target interaction
-
•
Heat received from target by radiation exchange
-
•
Heat removal for the 2.5 Hz operation
-
•
Thermal stresses (including highly transient loads)
-
•
Magnetic field pressures
-
•
Vibration of thin horn conductors (from pulsed load and possibly from He coolant)
-
•
Differential expansion between inner and outer conductor
The most serious issue is the amount of heat generated and deposited in a small volume of the inner conductor where current is flowing mostly in the skin depth. For the engineering calculations 240 kA will flow into the horn during each pulse in a half-sine form with duration of 20 s.
Skin Depth – Effective Resistance – Joule Heating Calculations
In a previous section the parameters governing the current flow in the horn and the resulting joule heat were estimated. The primary goal, given the structure of the current pulse is to estimate the skin depth and subsequently the joule heating throughout the horn. For a horn made of aluminum 3000-series and the 20 s half-sine 240 kA peak current pulse the following relation lead to the estimate of skin depth and joule heating:
-
•
Resistivity of Al-3000 = 4.2 mohm – cm
-
•
Skin depth = [6.61/f1/2] k1
-
•
k1 = [/]1/2
-
•
= 1.724 mohms-cm
Utilizing only the dominant frequency (f = 0.025 MHz) the skin depth has been estimated to be:
=0.06525 cm.
Using the parameters above (and a 240 kA current in the horn), calculations were made with the simplified assumption that all the current flows uniformly over one skin depth. The purpose of this simplification was to generate joule heat and temperature rise estimates that can be used to validate and benchmark the finite element simulation model being employed to estimate the heat generation and transfer in the integrated system. By assuming that the current only flows over one skin depth, an effective resistance can be estimated,
| (6.19) |
For this simplified case the joule heating per current pulse can be estimated from
| (6.20) |
where,= 250 kA sin(t/20s). From the above relation one arrives at
| (6.21) |
The total power generated in the neck-down section of the horn alone is estimated to be:
| (6.22) |
The temperature rise in the horn conductor per pulse is estimated by calculating the volume per cm-length of the conductor,
| (6.23) |
The mass of aluminum in the neck-down volume (with density = 2.77 g/cc) is 1.0788 g. The temperature rise in the horn conductor is estimated from,
| (6.24) |
where, cp = 0.967 J/g-C. This leads to an estimated temperature rise per pulse T = 5.95oC. As will be shown in the next section, the calculated temperature rise per pulse using a detailed finite element analysis is of the order of 6oC.
HORN Thermal Finite Element Analysis
By focusing on the neck-down section, it is estimated that approximately 1.4 kW are generated due to joule heating. The temperature rise per pulse at the inner surface of the conductor (based on aluminum density of 2.77 g/cc and cp = 0.967 J/g-C) is about 6oC per pulse while the melting temperature of aluminum is 660 C. Numerical calculations based on a sophisticated finite element analysis verified the temperature rise in the inner horn conductor. Figures 6.15 - 6.19 depict temperature distributions and transients throughout the horn. The transient analysis of the integrated system is performed while considering all the participating mechanisms of heat transfer in order to find out the operating or “steady-state” temperatures of the system. As seen from the following results, the goal of maintaining the aluminum temperature below 100o C is achievable. It should be noted that with the replacement of RAW for the inner surface horn cooling with sub-cooled He the threshold of 100o C can be increased to several hundred degrees and thus reducing the demand for massive cooling since the heat transfer effectiveness will increase with higher allowable surface temperatures in the aluminum.
Exploration of Alternative Horn Materials
While aluminum is the baseline material for this study, attention has been focused to a new material called AlBeMet which is considered to be the highest performance aluminum alloy in the industry. The Figures 6.13 - 6.14 provide its composition and properties relative to a number of other materials. In this on-going study this material will be furthered assessed for potential use in the horn structure.

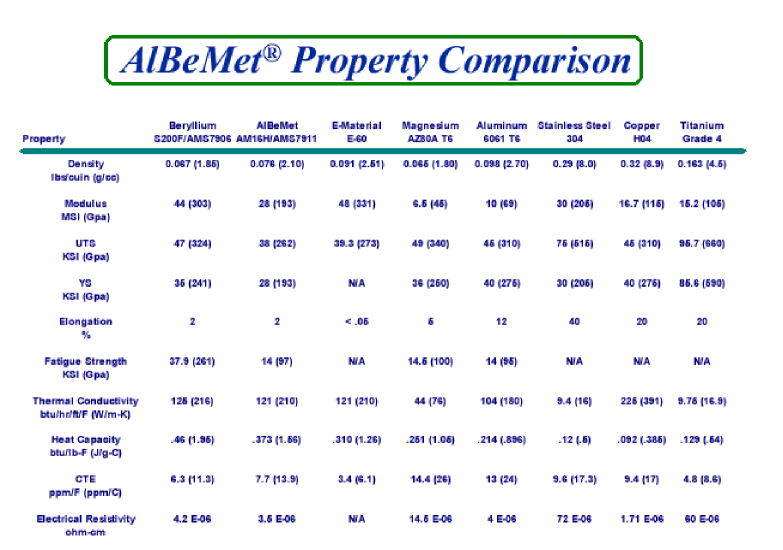
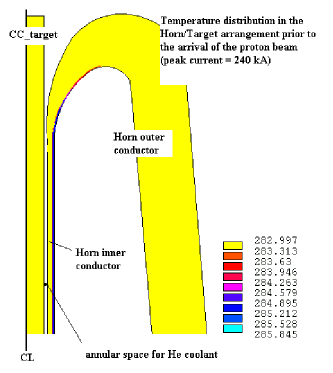
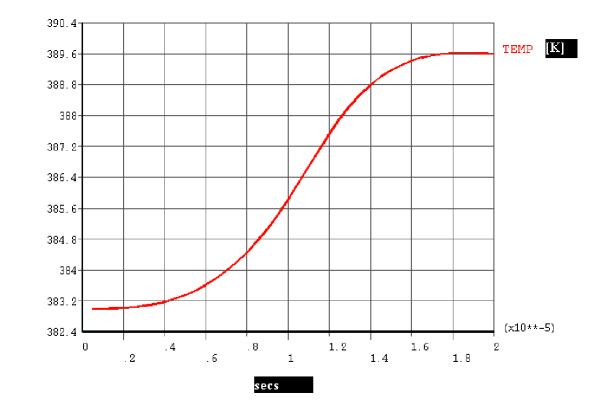
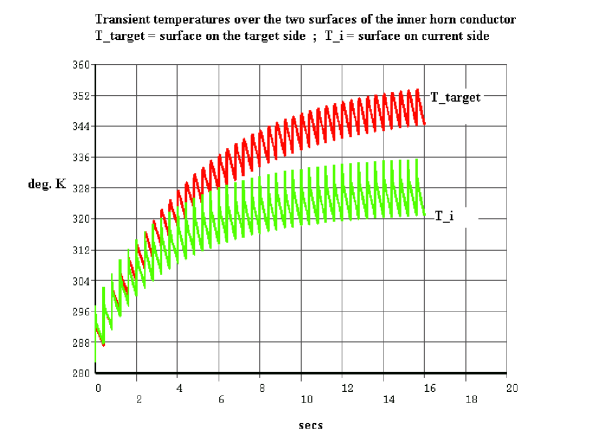
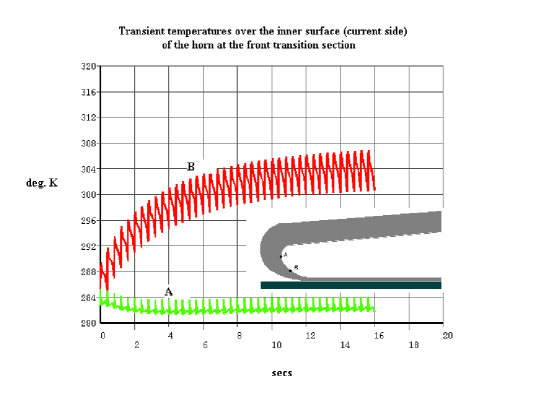
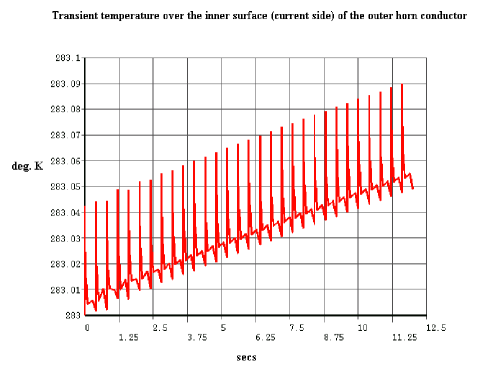
Work in Progress
In the course of this on-going study a number of issues still remain to be addressed in the effort to optimize the horn/target system and maximize its useful life. The “open” issues that are currently being addressed through material selection, detailed modeling and analysis and envisioned R&D efforts are summarized below.
-
•
Gamma-Ray Heating of the Horn (especially of the inner conductor) Independent hadronic analysis are being performed to confirm the energy deposited in the inner conductor of the horn closest to the target.
-
•
Horn Thermal Stresses
-
•
Horn Magnetic Forces and Induced Stresses
-
•
Horn Vibration - Modal Analysis
Detailed finite element analysis are under way to estimate the level of stresses generated in the horn, its modes of excitation and the means to optimize the horn structurally so it can meet all the physics criteria.
-
•
Horn Material (Aluminum) Irradiation & Fatigue It is envisioned that as part of the R&D and fatigue estimation effort, experience data will be reviewed further and, possibly, exposure of the material to dpa values will take place. Further, tapping on the expertise of collaboration members, the effects of the water environment on the changes induced on the aluminum surface and the issue of crack formation will be examined.
-
•
Discussion of Issues Related to Choice of Coolant In connection with the previous bullet, the effects and heat removal capacity of the choice of coolant fluids will be further assessed.
6.7 Conceptual Design of the Horn Power Supply
The main objectives of the horn [20] power supply design is to achieve an output pulse amplitude of 250KA, a pulse flat top of 2.5 S or longer with a 1% flatness and pulse to pulse repeatability, and a repetition rate of 2.5 pulses per second.
Most commonly used scheme is the capacitor discharge type [21][22][23][24]. In this type of circuit, a capacitor bank stores the energy, and a main discharge switch release the energy to the load through transmission lines. For very long distant transmission, pulsed transformers have been added into the KEK design and CNGS horn system. The horn as an electrical load is usually being described as an inductor in series with a resistor. Discrete parameters of inductance and resistance are also used to formulate the short length, low impedance transmission lines when associated with low bandwidth pulse. Hence, the circuit can be simplified as a RLC discharge circuit.
The pulse rise time, Tr, is usually approximated by the quarter period of sine wave. For a lossless LC oscillation circuit, this can be determined by the equation , and the load current is given by
| (6.25) |
The maximum current amplitude is for lossless LC circuit.
In the case of critical damped RLC circuit, and
| (6.26) |
The maximum output current can be determined by
| (6.27) |
and the current rise time is .
Compare two cases, for a given L, C and charging voltage Vo, the output current of the critical damped one has peak amplitude of 0.3679 of the lossless one. To reach the same maximum output current, the initial voltage of the critical damped circuit has to be 2.7183 times of the lossless one. It implies that, for the critical damped one, the energy stored in the capacitor bank as well as the charging power has to be 7.389 times larger.
In the high current path, the resistance caused voltage drop and energy dissipation are critical factors to be considered. The cooling system for heat removal from the effective resistor, and the additional charging power required to make up the resistive dissipation can be very costly. Hence the low circuit resistance is preferred.
6.7.1 Effective Resistance & Skin Effect
The load and transmission line resistance varies with frequency due to skin effect. For any given material, the skin depth is inverse proportional to the square root of the frequency f, and the effective resistance Reff is proportional to the oscillating frequency. Here
| (6.28) |
and
| (6.29) |
where l is the conductor length and b is the conductor width. The material’s conductivity, relative permeability, and the free space permeability are described by , , and , respectively.
One can see that slower frequency leads to lower effective resistance. The other factors associated with effective resistance are the length, width, and permeability and material conductivity. For non-magnetic material, the relative permeability is close to unit. The switching device on-state resistance and hardware connection joints resistance also contribute to the total resistance.
In summary, the lower effective resistance can be achieved by using:
-
1.
Lower frequency, higher skin depth;
-
2.
Wider conductor width;
-
3.
Shorter conductor length;
-
4.
Higher conductivity material;
-
5.
Lower switch on-state resistance; and
-
6.
Lower connection joint resistance.
6.7.2 Inductance Issues
The total inductance includes the horn inductance, transmission line inductance, series inductance of the capacitor, switch inductance, and circuit loop stray inductance. The external inductance depends on the inductor geometry and material permeability. The internal inductance has frequency dependence. The voltage across the inductor is defined as . Hence, the larger inductor and faster current rate of change requires higher voltage.
The current going through the inductor is the inductively stored energy. For a lossless circuit, the total inductive energy shall be equal to the total capacitive energy storage, i.e.
| (6.30) |
Therefore, we have that the higher the inductance and current, the higher the capacitance and its initial voltage.
For a reasonable design, the total inductance shall be kept as low as possible, and the current rise time shall be chosen to accommodate the device operating voltage.
6.7.3 Principle Design Example
Let us consider a system with overall inductance of 2.5 H, a total resistance of 2 m, and a capacitor bank of 16 mF. If the initial capacitor voltage is 4000 Volts, the peak output current amplitude is about 288 kA with 314 s rise time.
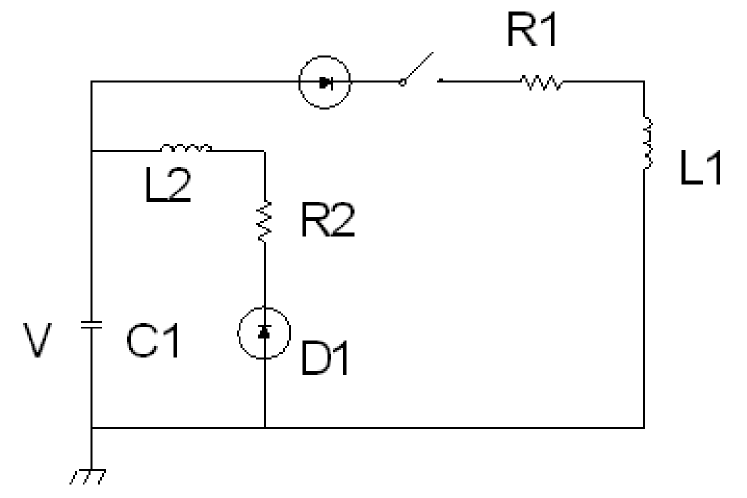
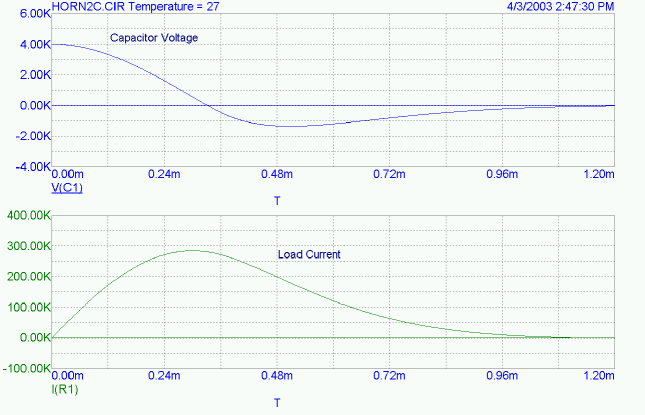
The stored energy in the capacitor is 128 kJ. For 2.5 Hz pulse repetition rate, the minimum charging power supply is 320 kW.
For the 3000-series aluminum being considered in the Horn mechanical design, the material skin depth is 0.06525 cm at 25 kHz. Derive from it, we have the skin depth is 0.3574 cm at 833 Hz.
The parameters used in this example are rough estimates based on similar systems, as listed on Table 6.3. The resistance used in the example is tight for the chosen frequency. If higher resistance has to be used, then the voltage and capacitance have to be increased.
| Pulse | Cap. | Induct. | Resist. | Rep. | |||||||||||
| Curr. | Volt. | Tr | 10% Width | Horn #1 | Horn #2 | Stray | Tot. | Horn #1 | Horn #2 | Stray | Tot. | Rev. Dump | Rate | ||
| kA | kV | S | S | mF | nH | nH | nH | nH | Hz | ||||||
| AGS Narr. Band | 240 | 12.44 | 58 | 350 | 0.850 | 462 | 567 | 635 | 1664 | 9600 | 5000 | ||||
| AGS Wide Band | 285 | 10.98 | 58 | 350 | 1.116 | 1198 | 7500 | 5000 | |||||||
| Mini Boone | 170 | 5.35 | 143 | 1.500 | 680 | 660 | 1340 | 230 | 770 | 1000 | 5 | ||||
| NuMi | 205 | 0.97 | 2600 | 900. | 689 | 510 | 1208 | 2407 | 270 | 71 | 690 | 1031 | 0.53 | ||
| CERN | 300 | 7.275 | 81 | 1.075 | 420 | 200 | 620 | 128 | 200 | 328 | 75 | ||||
| Pulser with Output Transformer | |||||||||||||||
| KEK | 250 | 4.702 | 3000 | 6.000 | 1030 | 210 | 0.5 | ||||||||
| CNGS | 150 | 7.21 | 4300 | 4.008 | 2150 | 405 | 2 pul./6s, 50ms apart | ||||||||
6.7.4 Major Components
The major components of this system include:
-
1.
Charging Power Supply;
-
2.
Capacitor Bank;
-
3.
Discharge Switch;
-
4.
Reverse Diode;
-
5.
Transmission Line.
In this design, Self-Healing capacitors are being considered for the fault tolerance, and increased reliability. This type of capacitor is usually rated under a few kilo-volts. Multiple capacitor cells have to be used to divide capacitor bank into smaller units with lower stored energy per cell for safety concerns.
The discharge switch in favor is the light triggered thyristor. The newest in this category is the EUPEC T2563N80. The advantage of this device is its high voltage rating of 8000 V, high forward current rating of 5600 A rms, and 63 kA surge current. Multiple thyristors have to be used in parallel to carry the 250 kA pulse current.
This thyristor features light triggered gate structure. It eliminates the high voltage isolation trigger transformers normally used in conventional thyristors, and improves the high voltage hold-off and the noise immunity. Large reverse diodes are available from the same company.
The trend of new designs is to use solid-state switch, which has much longer lifetime compared to gas discharge switches. The very high current capability required in this system limits the selection to thyristor types for its high power rating per single unit and cost effectiveness.
The traditionally used ignitron is mercury vapor filled device. With rapid advancement of solid state devices, it is being replaced by thyristors. Other solid state devices, such as IGBT and MOSFET are limited by their current capability.
The transmission line being considered is similar to FERMI NuMI [25] design for its ultra low resistance.
The design options of high voltage, high current pulsed system are often limited by the industry development and available components. In this case, the preferred operating voltage is under 5 kV. The total resistance shall be kept to less than or around 2 m.
7 Conventional Facilities and Target Hill
The proton beam will be extracted from the AGS and will utilize part of the RHIC beam transport before exiting the decommissioned neutrino beam line tunnel in a northerly direction and at an upward angle of approximately 13.8 degrees. The beam will bend towards the west by approximately 68.5 degrees, then down a total of 25.1 degrees to the proton target. A 200 m decay region follows with the neutrino beam entering the hadron beam stop at 11.26 degrees to the horizontal. The Near Detector Facility is located 285 m from the target, 21 m below ground level. A plan view of this arrangement at BNL is illustrated in the Figure 5.2and the overall beam facility is shown in Figure 7.1.
The vertical beam geometry results in a hill 50 meters high at the apex of the proton beam. This geometry provides for the neutrino beam’s 11.3-degree entry into the earth and avoids potential irradiation of soil close to the Long Island water table. This, together with impermeable rain water barriers to prevent rain water penetration of potentially irradiated soil, is consistent with present ground water protection practices at BNL. A simplified vertical beam profile and a cross-section of the hill is shown in Figures 5.1 and 5.3.
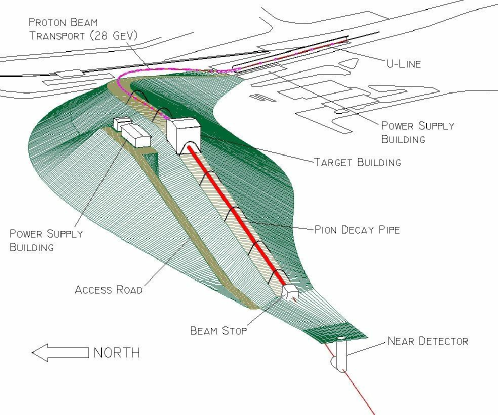
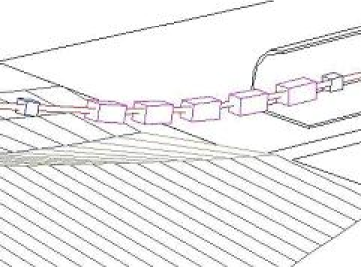
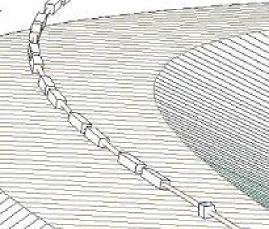
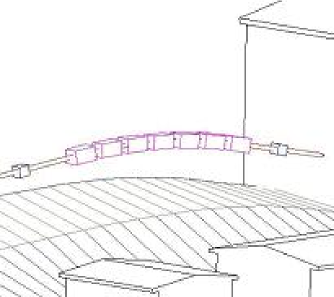
The new conventional facilities can be subdivided into the following areas:
-
•
Proton beam transport
-
•
Target area
-
•
Decay tunnel
-
•
Hadron beam stop
-
•
Near Detector Facility
7.1 Proton Beam Transport
Existing utilities and roads will be relocated and approximately 726,350 cubic meters of sand fill will be placed forming the hill. The sand fill will be placed in 0.3 m lifts and compacted to 98% of its maximum density. The fill will be placed early in the project allowing it to settle for several years before re-excavation for placement of the tunnel. Approximately 330 m of 3-m diameter tunnel, overburdened with 6.0 m of fill will be required for proton transport. There will be a waterproof liner installed .6 m below the surface of the overburden. Portions of beam transport are depicted in Figures 7.2, 7.3, and 7.4.
Access to the tunnel will be provided at the beginning of the vertical rise and near the target area. Equipment transport up & down the slope will be facilitated by use of a motorized railway on the aisle side of the transport elements in the tunnel. A typical section of the proton tunnel is shown Figure 7.5.
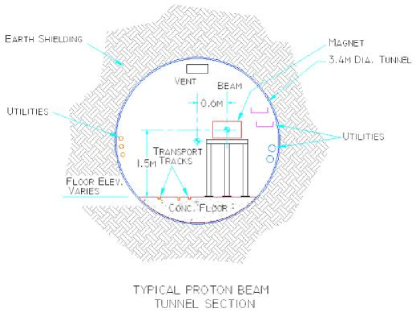
Two power supply/utility buildings will be provided, one located low near the existing beam line, the other located high near the target area. These buildings will house power distribution systems, power supplies, water pumping systems, instrumentation and controls for the beam line.
The cooling water system will use a 3.5 MW cooling tower for primary heat rejection with four isolated, closed loop cooling systems for:
-
•
All transport magnets (2.8 MW)
-
•
Two power supply areas (. 5 MW)
-
•
Horn cooling (. 2 MW)
Each system will contain redundant pumps, a heat exchanger, a full flow filter and a side stream deionizer capable of maintaining the system at 2-5 Megohm-cm. The system controls will be PLC based and be capable of monitoring and reacting to water leaks if they occur. In general, electrical power will be distributed around the site at 13.8 kV. Unit substations will transform the power into convenient voltages, typically 480 and 208/120 volts. Electrical power is divided into two major categories: conventional and experimental. Conventional power encompasses building power for lighting and convenience power, HVAC, and miscellaneous equipment; and site distribution. Emergency power will be provided as required from existing circuits.
Experimental power feeds all the power supplies and associated equipment, such as, cooling water pumps, cooling towers, etc. Designs will follow the requirements of the National Electrical Code and industry standards.
| Location | Conventional Power (KVA) | Experimental Power (KVA) | Total Power (KVA) |
|---|---|---|---|
| Lower Power House | 150 | 2750 | 2900 |
| Upper Power House | 150 | 2050 | 2200 |
| Near Detector | 100 | 900 | 1000 |
| Total Power (KVA) | 400 | 5700 | 6100 |
The present radiation security system in the RHIC transport line will be extended and three new radiation security access gates will be installed. Access to the new tunnel will be allowed during RHIC operations by implementing the necessary features such as shield walls and beam plugs in the existing tunnel. A fence will be provided to limit access over the beam tunnel while the beam is in operation.
Fire detection and protection will be provided where appropriate throughout the facility and connected to the BNL site fire alarm system. High sensitivity smoke detection systems will be utilized in increased risk or high value areas.
The proton beam tunnel will be provided with dehumidification, ventilation and a compressed air system for device controllers. Heat and air-conditioning will be provided in the power supply buildings. All buildings will be connected to the BNL site sanitary system where the appropriate monitoring of effluent is provided.
Ground water monitoring wells will be provided to insure compliance with all Local, State and Federal ground water protection requirements.
7.2 Target Area
The target area will include the proton target, horns, horn power supply and water cooling system.The facility will be a high bay building with a stepped foundation and an overhead crane of sufficient capacity to handle the largest load of approximately 40 tons, see Figure 7.6. A shielded storage area will be provided for radioactive component storage and repair. Modular concrete and steel shielding will provide radiation shielding. Access to the horn vault for installation and removal of the horns is accomplished by removing the modular shielding. Present plans call for hanging the horns from shielded supports with the ability to survey and connect or disconnect the horns from above the shield in a relatively low residual radiation environment as shown in Figure 7.7. The design of this area, as well as all areas, will incorporate ALARA radiation principles. A collimator downstream of Horn #2 will be installed to intercept a portion of the off-axis beam that would otherwise interact in the soil along the decay tunnel.
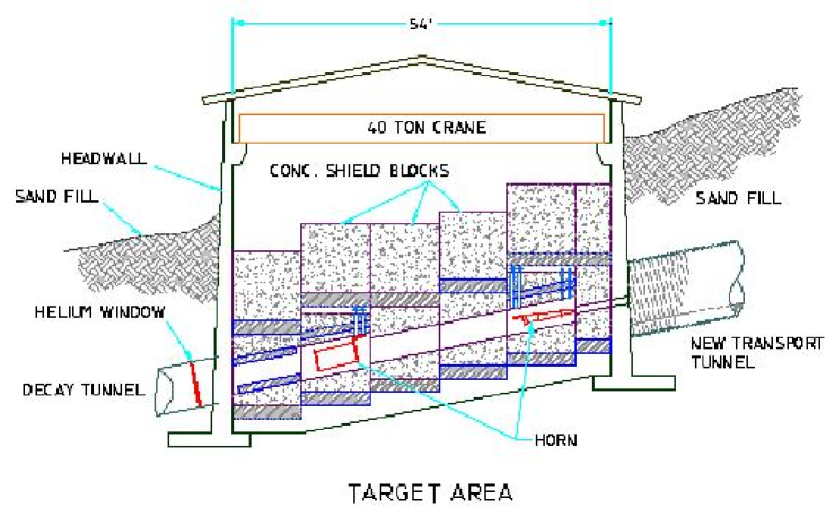
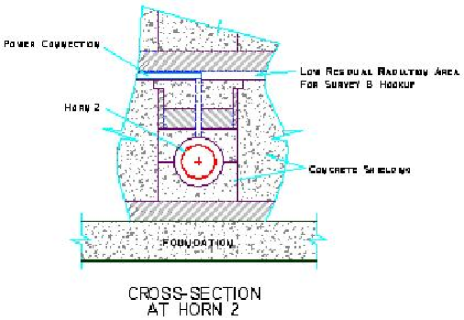
Survey tolerances, both absolute and relative, are driven by the physics requirements which are less stringent than for the “MINOS” experiment in Soudan, MN.. The geodetic position of BNL is well known and tied to the National Geodetic Survey system. The geodetic position of the beam front-end elements and the Detector site will be taken in 2 to 3 simultaneous epochs giving the relative positions of the two sites within a few centimeters. A more difficult issue will be in determining the position of the subterranean detector relative to the surface. Gyro-theodolite observations coupled with traditional line-of-site observations (if possible) will provide the data necessary. If line-of-site observations are not possible, an Inertial Navigation System may be used giving the relative position within a few meters.
7.3 Decay Tunnel
The decay tunnel will be a 2-meter diameter steel tube; 185 meters long, with seal welded joints. There will be a thin helium window at the downstream end of Horn #2 and a helium window at the upstream end of the hadron beam stop. Simulations will be done to predict the temperatures and stresses on the windows and the appropriate measures taken to insure they withstand the radioactive environment. The contained volume will be purged with helium gas. Access to the upstream window will be provided through the target area. There will be no utilities or access to the decay tunnel between helium windows. The tunnel will be overburdened with 9 meters of earth fill with a waterproof liner installed approximately 0.6 meters below the surface, extending 9 meters on each side of the tunnel.
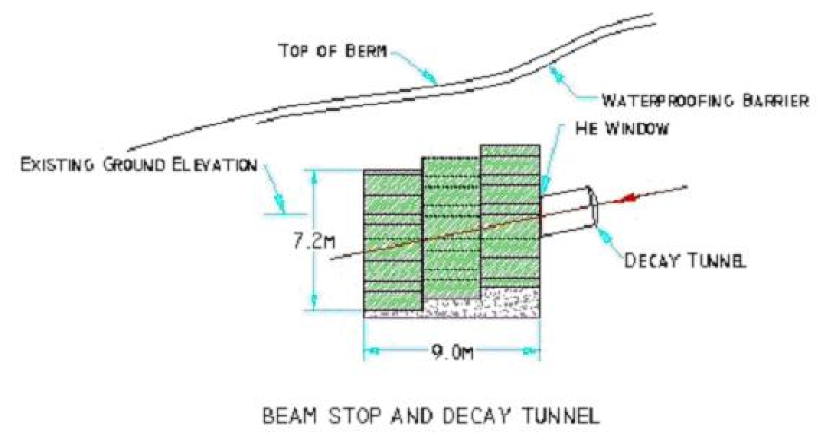
7.4 Hadron Beam Stop
The hadron beam stop will be approximately 7 m wide x 7 m high x 9 m long. Elevation view is shown if Figure 7.8. It will have a stepped foundation to approximate the 11.3-degree downward angle. The lowest portion of the beam stop will be approximately 3m above the ground water table. The stop will consist mainly of existing steel plate from the decommissioned neutrino beam line at BNL, overburdened with 4m of soil. A waterproof liner will be placed .6m below the surface of the soil to insure no rainwater can penetrate. Simulations will be carried out to predict the temperatures and stresses on the front face of the stop and the appropriate materials chosen. It is presently assumed that no cooling of the material is necessary and only temperature interlocks are required.
7.5 Near Detector Facility
The near detector facility will be located 285 m from the target, 21 m below ground level. The near detector facility is depicted in elevation view in Figure 7.9 The facility will consist of welded steel tunnel sections 6 m in diameter, with a 5 m access shaft to the surface. A 9 m wide x 15 m long service building will be constructed over the access shaft with a removable roof to access equipment below with a mobile crane. This building will contain electrical distribution, HVAC units, water cooling systems, power supplies and experimental equipment associated with the detector. An elevator will be provided for accessing the detector from the service building. A unit substation and cooling tower will be provided for utilities in this area. Estimated requirements are:
Power ——– 1000 KVA
Cooling —— 500 kW
Since the facility is located below the water table, installation of the tunnel sections will involve excavation of soil to the water table, installation of sheet piling, excavation and de-watering of the sheet pile site, and installation of the tunnel sections. The tunnel is then seal welded and back-filled with soil.
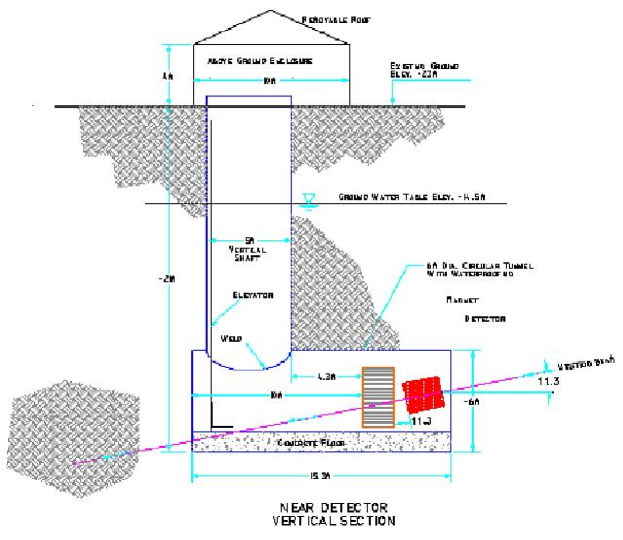
7.6 Radiation Shielding for the Super Neutrino Beam
The conceptual shielding design for the Super Neutrino Beam meets the necessary standards for radiation protection and provides a basis for the initial cost estimates for the project. The design has been developed using existing reports, calculations, and simple analytic techniques to scale to the proposed facilities for the proton transport, target station, decay tunnel, and beam stop. More detailed modeling will be conducted when the design of the various components are more mature. The shielding has been designed to:
-
•
Meet standards for chronic exposure to people at adjacent areas and off-site.
-
•
Prevent contamination of the ground water.
-
•
Reduce direct exposure sufficiently so that personnel can service equipment at the facility during beam operations.
A brief description of the methods and assumptions used will be given in this section.
7.6.1 Source Terms
The shielding design requires estimations of the source terms and their locations. Logically, the Super Neutrino Beam breaks into four simple areas, proton transport from the AGS to the target station, target station, decay tunnel, and the beam stop. The proton beam transport is expected to have an integrated loss of 0.1% with less than 0.03% lost in any one location. The target station has been designed assuming 100% of the beam interacts in the target. It is assumed that no beam interacts with the helium in the decay tunnel. In reality, approximately 1% of the incident beam will survive the target and interact in the helium. These neglected interactions are compensated for by the assumption that 100% of the beam interacts in the target. 20% of the beam will survive the target and strike the beam dump.
An MCNPX calculation by A. Stevens [26] has been used to estimate the initial radiation pattern in the near shield. The calculation assumed that the 25 GeV proton beam struck an iron target 1-meter long and 3 cm in radius. This target was placed in a tunnel with a 1.5 meter radius and surrounded by soil. The initial radiation pattern has then been extrapolated using the analytic techniques of Tesch[27] and discussed by A.H. Sullivan[28]. This method was used for the beam transport, target station, and decay tunnel.
The beam stop was designed by using an existing design[29] of a 29 GeV beam dump in the AGS slow beam area. The analytic techniques were then used to extrapolated were necessary.
7.6.2 Ground Water Protection
The interaction of high-energy protons will create radioactive products in the surrounding shield. It is important that these radioactive products are not transported to the water table. The BNL standard[30] requires that the design of this facility prevent radioactive products in the groundwater from exceeding 5% of the drinking water standard. The use of modular concrete and steel shielding for the entire project is cost prohibitive. Most of the facility will have an earthen shield. Modular shielding will be used at the locations of highest loss and when possible to reduce the amount of radioactive products created in the surrounding soil. The design standard allows for the use of approved capping materials to prevent created radioactive products from being transported by rainwater to the water table. Caps constructed of geomembranes or concrete will be used to meet the BNL standard for groundwater protection.
22Na is the radioactive isotope that will determine the design of the cap which protects the groundwater. Based on the transport model used in the BNL standard, the cap must prevent rainwater from leaching the soil where the created 22Na in a year exceeds 1.05*10Na atoms/cc. This corresponds to a neutron flux (E20 MeV) of 9.4*10-13 neutrons/cm2 per incident proton.
The loss assumption for the proton transport has a maximum local chronic loss of 0.03% of the proton beam. The cap must have at least 4.6 meters of soil between it and the tunnel wall. For the present conceptual design the membrane has been placed at 5.5 meters from the tunnel wall giving a factor of 5 more reduction then required by the standard. The membrane is covered with 0.6 meters of earth.
It is assumed that 100% of the beam interacts at the target station. If it were sited inside a tunnel shielded by dirt the liner would need to be greater than 9 meters from the target. The total amount of activation in the soil would be substantial. It was decided that the target area should have the shield constructed from modular steel and concrete blocks. The target area shield will have a thickness equivalent to 0.6 m of steel and 4.3 m of heavy concrete. The target area will be inside a building. The concrete floor will prevent rainwater from leaching activation products from the soil underneath the target station. The roof of the target building will prevent rainwater from entering the concrete and steel shielding. Additional shielding will be placed underneath the target and horns to reduce the activation of soil underneath the concrete floor as shown in Figure 7.6.
The decay tunnel has been designed with the membrane 8.5 meters from the tunnel wall. The membrane will have 0.6 meters of soil overburden. At this stage of the design it was decide to be conservative in the estimate for the decay region. It is expected when the final design of the target area is complete that the membrane can be closer to the tunnel and the berm thickness decreased.
The beam dump is constructed from plates of steel. The dimensions of the steel were chosen to reduce the neutron flux sufficiently such that the activation of the soil in contact with the edges of the steel satisfies the BNL standard. This requires the iron beam dump to have a radius of 3.4 meters and a length of 9.2 meters. The water cap for the decay tunnel will be extended over the beam dump, as shown in Figure 7.8. This is necessary to prevent water from percolating through the beam dump.
There are four monitoring wells planned for the Super Neutrino Beam area. The beam dump, decay tunnel, target station, and proton transport will each have an appropriately sited monitoring well. In addition, existing wells will monitor the portion of the proton transport, which is close to the AGS.
7.6.3 Sky Shine
Dose to adjacent facilities occurs due to leakage of neutrons through the shielding. The dose to people at adjacent facilities is calculated using the sky shine formulation discussed by A.H. Sullivan[28]. The exposure at a location more than 100 meters from the source is given by:
| (7.1) |
where H is the dose rate in mrem/hr, H0A is the integrated dose through the berm in rem-m2 per hour, and R is the distance from the source to the occupied location in meters.
The limits are established by integrating the exposure over a year of operation. In addition occupancy factors can be used were appropriate. Five locations were examined for the yearly exposure from the super neutrino beam. The assumptions on occupancy and exposure limits are given in the Table 7.2
| Location | Occupancy | Occupancy per | Facility limit |
| hours/week | work hour | mrem/yr | |
| Off-Site | 168 | 1 | 5 |
| Linac | 40 | 1 | 100 |
| Blip | 40 | 0.25 | 25 |
| BAF | 40 | 0.25 | 25 |
| Bldg. 1005 | 40 | 1 | 25 |
Based on these occupancy assumptions the exposure limit for off-site is the most stringent for all loss locations. The target station dominates the contribution to off-site dose and is less than 10% of the allowed limit.
7.6.4 Direct Exposure
Dose rates external to the shielding will typically be less than a few mrem/hr under normal operating conditions. The highest localized dose rates occur at the target building and are less than 60 mrem/hr . Barriers, postings and procedures will control access to the shielding. Abnormal operating conditions can cause substantial increases in the dose rates. Elements, which can cause abnormal conditions, will be monitored and a fast beam interrupt will limit the duration of the abnormal condition. Radiation detectors will be distributed along the facility to prevent personnel exposure and limit fault conditions. A dual PLC based access control system will prevent access to the transport tunnel, except under allowed conditions.
8 Cost Estimate and Schedule
The cost estimate of the AGS-Based super Neutrino beam Facility has been performed following the ”bottoms up” approach. After the performance goals and physics design of each technical systems are completed, cognizant engineers who have built similar systems were assigned to prepare a cost estimate of sufficient detail and based on previous experience. Each estimate typically includes the cost of the detailed engineering design, procurement, manufacturing, testing and installation. Material and labor costs are captured as separate entries for each process.
Most of the cost numbers are based on BNL’s recent experience in building RHIC, SNS ring, and LHC magnets. They also draw on extensive searches of price given in catalogs and on vendor’s quotations. Although, a formal Work Breakdown Structure (WBS) has not been implemented yet, all systems have been estimated by going down to the component and assembly level. From our past experience, both the manufacturing approaches and the cost estimates are consistent with good engineering practices and are credible.
The costs given reflect the ’direct cost” of the item. In other words, estimates do not include G & A (lab overhead), contingency and ED &I. These cost elements are added for the direct cost following guidelines using standard estimating.
All the figures are in FY 2003 US Dollars. No inflation is included since the construction period is not known at this time.
A preliminary estimate of the direct cost of the accelerator system is given Table 8.1.
| 1.2 GeV SC Linac: | |
|---|---|
| Front End | $2.5 M |
| LE SC Linac | $38.3 M |
| ME SC Linac | $30.7 M |
| HE SC Linac | $28.1 M |
| AGS Upgrades: | |
| AGS Power Supply | $32.0 M |
| AGS RF Upgrade | $8.6 M |
| AGS Injection Channel | $3.7 M |
| Full Turn Extraction | $5.5 M |
| Shielding | $3.2 M |
| Installation | $4.2 M |
| Total Direct Cost | $156.8 M |
The direct cost of the neutrino beam systems is summarized in Table 8.2.
| Item | Basis | Cost |
|---|---|---|
| Proton Transport | RHIC Injector | $14.8 M |
| Target/Horn | E889 | $5.5 M |
| Shielding/Dump | New | $5.8 M |
| Decay Tunnel | E889 | $0.4 M |
| Hill. Const. | New | $13.0 M |
| Near Detector Vault | RHIC | $7.3 M |
| Conventional Facil. | RHIC | $7.5 M |
| Other Const. | New | $2.2 M |
| Installation | RHIC | $5.2 M |
| Total Direct Cost | $61.7 M |
The resultant total direct cost of the 1 MW AGS super Neutrino Beam facility, not including both near and main detectors, is about $ 218.5 M. More detailed cost estimate for each system are given in Appendix B. The preliminary total estimated cost (TEC) is $369 M in FY03 dollars, including EDIA 15 %; contingency 30 %; BNL project overhead 13 %. Escalation cannot be estimated without a project start year.
It is estimated that three years of R & D are needed to build prototypes and perform detail engineering designs to reduce cost and improve operation reliability. This will be followed by 4.5 years of construction and 0.5 year of commissioning to get this facility ready for physics research. The planned schedule is represented in Table 8.3. Where FY1 represents the first year of project approval.
| R&D | Construction | Research | |||||||
|---|---|---|---|---|---|---|---|---|---|
| FY1 | 2 | 3 | 4 | 5 | 6 | 7 | 8 | 9- 15 | |
| R&D | XX | XX | XX | ||||||
| Construction | XX | XX | XX | XX | X | ||||
| Commissioning | X | ||||||||
| Research | XXXX | ||||||||
Appendix A Appendix A: Design Parameters
A.1 Facility Level Parameters
| Proton Beam Energy | 28 GeV |
|---|---|
| Protons per Pulse | 8.9 |
| Average Beam Current | 37.5 A |
| Repetition Rate | 2.5 Hz |
| Pulse Length | 2.58 sec |
| Number of Bunches | 23 |
| Protons per Bunch | 3.87 |
| AGS Circumference | 807.1 m |
| Bunch Length | 40 nsec |
| Bunch Spacing | 60 nsec |
| Extraction Gap | 160 nsec |
| Average Beam Power | 1 MW |
| Normalized Emittance-X | 100 mm-mrad |
| Normalized Emittance-Y | 100 mm-mrad |
| Longitudinal Emittance | 5.0 eV-sec |
| Energy Spread (E/E) | 0.001 |
| Target Material | carbon-carbon |
| Target Radius | 6.0 mm |
| Target Length | 80 cm |
| Beam Size on Target | 2 mm (rms) |
| Beam Elevation at Target | 43 m |
| Decay Tunnel Length | 200 m |
| Beam Dump Length | 20 m |
| Distance of Near Detector from Target | 275 m |
| Physics Time per Year | 107 sec/year |
| Number of Protons on Target | 2.2 p/year |
A.2 Front End and Warm Linac Parameters
| Energy of Warm Linac | 200 MeV |
|---|---|
| Normalized Horizontal Emittance (rms) | 2.0 mm-mrad |
| Normalized Vertical Emittance (rms) | 2.0 mm-mrad |
| Longitudinal Emittance (rms) | 0.125 MeV-deg |
| Macro-Pulse Average Current | 21 mA |
| Macro-Pulse Peak Current | 28 mA |
| Repetition Rate | 2.5 Hz |
| Pulse Length | 720 sec |
| Chopping Rate | 0.75 % |
| Energy Spread (E/E) | 0.002 |
| Energy Jitter(E/E) | 0.001 |
A.3 Superconducting Linac Parameters
| Linac Section | LE | ME | HE |
| Kinetic Energy Initial/Final, MeV | 200/400 | 400/800 | 800/1200 |
| Frequency, MHz | 805 | 1610 | 1610 |
| No. of Protons / Bunch x 108 | 8.70 | 8.70 | 8.70 |
| Temperature, oK | 2.1 | 2.1 | 2.1 |
| Cells / Cavity | 8 | 8 | 8 |
| Cavities / Cryo-Module | 4 | 4 | 4 |
| Cavity Separation, cm | 32.0 | 16.0 | 16.0 |
| Cold-Warm Transition, cm | 30 | 30 | 30 |
| Cavity Internal Diameter, cm | 10 | 5 | 5 |
| Cell Reference | 0.615 | 0.755 | 0.851 |
| Cell Length, cm | 11.45 | 7.03 | 7.92 |
| Length of Warm Insertion, m | 1.079 | 1.379 | 1.379 |
| Total No. of Periods | 6 | 9 | 8 |
| Length of a period, m | 6.304 | 4.708 | 4.994 |
| Total Length, m | 37.82 | 42.38 | 39.96 |
| Cavities / Klystron | 1 | 1 | 1 |
| No. of rf Couplers / Cavity | 1 | 1 | 1 |
| Coupler rf Power, kW (*) | 263 | 351 | 395 |
| Total No. of Klystrons | 24 | 36 | 32 |
| Z0T, ohm/m | 378.2 | 570.0 | 724.2 |
| Q0 x 1010 | 0.97 | 0.57 | 0.64 |
| Ave. Axial Field, Ea, MV/m | 13.4 | 29.1 | 29.0 |
| Ave. Dissipated Power, W | 2 | 11 | 8 |
| Ave. HOM-Power, W | 0.2 | 0.5 | 0.4 |
| Ave. Cryogenic Power, W | 65 | 42 | 38 |
| Total Ave. RF Power, kW (*) | 17 | 31 | 30 |
| Norm. rms Emittance, mm-mrad | 2.0 | 2.0 | 2.0 |
| Rms Bunch Area, MeV (805 MHz) | 0.5 | 0.5 | 0.5 |
| (*) Including 50% RF power contingency. | |||
A.4 AGS Parameters
| Injection Energy | 1.2 GeV |
|---|---|
| Extraction Energy | 28 GeV |
| Number of Injection Turns | 240 |
| Stripping Efficiency | 98% |
| Beam Bump | 25 kW |
| Electron Collection | 25 Watts |
| Number of Protons | 8.9 |
| Harmonic Number | 24 |
| Filled Bucket | 23 |
| Repetition Rate | 2.5 Hz |
| Strip Foil | carbon-carbon 300 g /cm2 |
| RF Frequency at Injection | 8.0 MHz |
| RF Frequency at Extraction | 12.0 MHz |
| Peak RF Voltage | 1.0 MV |
| Transition Gamma | 8.5 |
| Horizontal Tune | 8.7 |
| Vertical Tune | 8.9 |
| Beta Maximum | 22.5 m |
| Beta Minimum | 11.5 m |
| Horizontal Aperture | 7 cm |
| Vertical Aperture | 7 cm |
| Power Supply | 4300 A, 25 kV |
A.5 Target/Horn Parameters
| Target Material | carbon-carbon |
|---|---|
| Target Radius | 6.0 mm |
| Target Length | 80 cm |
| Heat Deposition | 7.3 kJ/pulse |
| Cooling Medium | He Gas |
| Operating Peak Temperature | 800∘C |
| Horn Small Radius | 70 mm |
| Horn Large Radius | 610 mm |
| Horn Thickness | 2.5 mm |
| Horn Length | 217 cm |
| Horn Current | 250 kA |
| Horn Peak Current Density | 690 kA/cm2 |
| Repetition Rate | 2.5 Hz |
| Power Supply Wave Form | Sinusoidal, base width 1.20 msec |
| Power Supply Voltage | 5 kV |
| Average Power | 700 kW |
| Heat Deposition on Horn | 3 kJ/Pulse |
| Cooling Medium of Horn | Water |
A.6 Decay Tunnel and Shielding Parameters
| Decay Tunnel Radius | 1 m |
|---|---|
| Decay Tunnel Length | 200 m |
| Beam Dump Material | Steel |
| Beam Dump Length | 9 m |
| Shielding of Target Bldg. | 0.6 m Steel and 4.3 m of Heavy Concrete |
| Shielding of Decay Tunnel | 9 m Soil |
A.7 Conventional Facilities and Target Hill Parameters
| The Linac Tunnel Length | 120 m |
|---|---|
| Linac Tunnel Diameter | 3 m |
| Klystron Gallery Length | 120 m |
| Klystron Gallery Dimension | 22 m x 12 m (W*H) |
| SRF Testing and Assembly Building | 12 m x 36 m |
| Shielding of Linac Tunnel | 3 m Soil |
| Linac Service Building | 12 m x 22 m |
| Beam Transport Tunnel | 330 m |
| Beam Transport Tunnel Diameter | 3 m |
| Shielding of Beam Transport Tunnel | 6 m Soil |
| Beam Transport Service Buildings | 2x(250 m2) |
| Beam Elevation at Target | 43 m |
| Target Hill Height | 52 m |
| Target Hill Base Width | 154 m |
| UP Hill Length to Target | 200 m |
| Down Hill Length from Target | 220 m |
| Target Service Building | 16.5 m x 15 m |
| Electrical Substation | 6100 KVA |
| Water Cooling Capacity | 3.5 MW |
| Service Road | 250 m |
Appendix B Appendix B: System Cost Estimate
B.1 Linac Upgrade Cost
| Direct Costs | k$ |
|---|---|
| Ionsource Power Supplies | 80 |
| Driver Stage RF Systems | 123 |
| RF Modulator PS’s | 23 |
| High Power Cap Banks | 730 |
| Crowbar System | 76 |
| Low Level RF Amps | 102 |
| Quadrupole Pulsers | 1016 |
| Misc. Cabling, etc. | 27 |
| Labor | 325 |
| TOTAL DIRECT | 2,542 |
B.2 SCL Cost
| LE-Section | ME- & HE-Sections | |
| Frequency,MHz | 805 | 1,610 |
| AC-to-RF Efficiency | 0.45 for Pulsed Mode | |
| Cryogenic Efficiency | 0.0014 @ 2.1 oK | |
| Electricity Cost | 0.05 $/kWh | |
| Linac Availability | 75 % of yearly time | |
| Normal Conduct. Cost | 20 k$/m 50 k$/quad | |
| Superconducting Cost | 200 k$/m 360 k$/module | 100 k$/m 200 k$/module |
| Cost of Klystron, in k$: | ||
| Power Source | 170 | 160 |
| Trans. + PS | 140 | 130 |
| Circul. +Loads | 95 | 80 |
| Controls | 70 | 60 |
| Waveguides | 25 | 20 |
| Total | 500/Unit | 450/Unit |
| Cost of Refrigeration: | ||
| Refrigeration | 8.0 M$ | |
| Control | 1.0 M$ | |
| Ancillary | 1.0 M$ | |
| Labor | 6.0 k$/m | |
| Transfer Lines | 18.0 k$/m | |
| Electrical Distribution | 0.14 $/W (AC) and 10 k$/m | |
| Control | 10% of the Total Cost above | |
| Tunnel Cost | 15 k$/m (Linac) and 40 k$/m (Klystr.) | |
| Linac Section | LE | ME | HE |
| Capital Cost ’02 M$: RF Klystron Electric Distr. (**) Refrigeration Plant Warm Structure (**) Cold Structure Control System Tunnel (**) | 12.000 0.435 (+)10.908 0.733 8.429 3.250 2.560 | 16.200 0.438 3.017 1.156 4.796 2.561 2.564 | 14.400 0.413 2.959 1.040 4.492 2.330 2.417 |
| Total Cost, ’02 M$ | 38.315 | 30.731 | 28.052 |
| Operation Cost, ’02 k$/y (***) | 54.6 | 64.9 | 61.4 |
| (**) Includes 4.5m long matching insertion between LE and ME sections | |||
| (***) Includes only electric bill for RF and Cryogenic Power converted to AC | |||
| (+) Includes 8.0M$ for Main Cryogenic Station | |||
| The 1.2-GeV Linac | Material | Labor | Total | |
|---|---|---|---|---|
| 2.1.3 | Low-Energy SCL | 29,116 | 9,199 | 38,316 |
| 2.1.4 | Medium-Energy SCL | 23,047 | 7,685 | 30,732 |
| 2.1.5 | High-Energy SCL | 20,991 | 7,060 | 28,051 |
| Total | 73,154 | 23,944 | 97,099 | |
| Low-Energy SCL | Material | Labor | Total | ||
| 2.1.3.1 | Cryo-Modules | 6,743 | 1,686 | 8,429 | |
| 2.1.3.1.1 | Tanks | 2,248 | 562 | 2,810 | |
| 2.1.3.1.2 | RF Cavities | 4,495 | 1,124 | 5,619 | |
| 2.1.3.2 | Refrigeration (*) | 8,726 | 2,182 | 10,908 | |
| 2.1.3.3 | Warm Insertions | 586 | 147 | 733 | |
| 2.1.3.2.1 | Quadrupoles | 352 | 88 | 440 | |
| 2.1.3.2.2 | Steering | 59 | 15 | 73 | |
| 2.1.3.2.3 | BPM | 59 | 15 | 73 | |
| 2.1.3.2.4 | Vacuum Sys. | 117 | 29 | 147 | |
| 2.1.3.4 | RF Power Supply | 9,600 | 2,400 | 12,000 | |
| 2.1.3.3.1 | Klystrons | 2,880 | 720 | 3,600 | |
| 2.1.3.3.2 | Transmitters | 2,304 | 576 | 2,880 | |
| 2.1.3.3.3 | Circulators | 1,824 | 456 | 2,280 | |
| 2.1.3.3.4 | Controls | 1,344 | 336 | 1,680 | |
| 2.1.3.3.5 | Waveguides | 480 | 120 | 600 | |
| 2.1.3.3.6 | Couplers | 768 | 192 | 960 | |
| 2.1.3.6 | Electrical Distribut. | 348 | 87 | 435 | |
| 2.1.3.7 | Control | 2,600 | 650 | 3,251 | |
| 2.1.3.8 | Tunnel | 512 | 2,048 | 2,560 | |
| 2.1.3 | Total | 29,116 | 9,199 | 38,316 |
| Medium-Energy SCL | Material | Labor | Total | ||
| 2.1.4.1 | Cryo-Modules | 3,837 | 959 | 4,796 | |
| 2.1.3.1.1 | Tanks | 1,279 | 320 | 1,599 | |
| 2.1.3.1.2 | RF Cavities | 2,558 | 639 | 3,197 | |
| 2.1.4.2 | Refrigeration | 2,414 | 603 | 3,017 | |
| 2.1.4.3 | Warm Insertions | 925 | 231 | 1,156 | |
| 2.1.3.2.1 | Quadrupoles | 555 | 139 | 694 | |
| 2.1.3.2.2 | Steering | 92 | 23 | 116 | |
| 2.1.3.2.3 | BPM | 92 | 23 | 116 | |
| 2.1.3.2.4 | Vacuum Sys. | 185 | 46 | 231 | |
| 2.1.4.4 | RF Power Supply | 12,960 | 3,240 | 16,200 | |
| 2.1.3.3.1 | Klystrons | 3,888 | 972 | 4,860 | |
| 2.1.3.3.2 | Transmitters | 3,110 | 778 | 3,888 | |
| 2.1.3.3.3 | Circulators | 2,462 | 616 | 3,078 | |
| 2.1.3.3.4 | Controls | 1,814 | 454 | 2,268 | |
| 2.1.3.3.5 | Waveguides | 648 | 162 | 810 | |
| 2.1.3.3.6 | Couplers | 1,037 | 259 | 1,296 | |
| 2.1.4.5 | Electrical Distribut. | 350 | 88 | 438 | |
| 2.1.4.6 | Control | 2,049 | 512 | 2,561 | |
| 2.1.4.7 | Tunnel | 513 | 2,051 | 2,564 | |
| 2.1.4 | Total | 23,047 | 7,685 | 30,732 |
| High-Energy SCL | Material | Labor | Total | ||
| 2.1.5.1 | Cryo-Modules | 3,594 | 898 | 4,492 | |
| 2.1.3.1.1 | Tanks | 1,198 | 299 | 1,497 | |
| 2.1.3.1.2 | RF Cavities | 2,396 | 599 | 2,995 | |
| 2.1.5.2 | Refrigeration | 2,367 | 592 | 2,959 | |
| 2.1.5.3 | Warm Insertions | 832 | 208 | 1,040 | |
| 2.1.3.2.1 | Quadrupoles | 499 | 125 | 624 | |
| 2.1.3.2.2 | Steering | 83 | 21 | 104 | |
| 2.1.3.2.3 | BPM | 83 | 21 | 104 | |
| 2.1.3.2.4 | Vacuum Sys. | 166 | 42 | 208 | |
| 2.1.5.4 | RF Power Supply | 11,520 | 2,880 | 14,400 | |
| 2.1.3.3.1 | Klystrons | 3,456 | 864 | 4,320 | |
| 2.1.3.3.2 | Transmitters | 2,765 | 691 | 3,456 | |
| 2.1.3.3.3 | Circulators | 2,189 | 547 | 2,736 | |
| 2.1.3.3.4 | Controls | 1,613 | 403 | 2,016 | |
| 2.1.3.3.5 | Waveguides | 576 | 144 | 720 | |
| 2.1.3.3.6 | Couplers | 922 | 230 | 1,152 | |
| 2.1.5.5 | Electrical Distribut. | 330 | 83 | 413 | |
| 2.1.5.6 | Control | 1,864 | 466 | 2,330 | |
| 2.1.5.7 | Tunnel | 483 | 1,934 | 2,417 | |
| 2.1.5 | Total | 20,991 | 7,060 | 28,051 |
B.3 Conventional Facilities and Target Hill Cost
| Conventional Construction | Quantity | $/unit | Cost (k$) |
|---|---|---|---|
| Upgrade U-Line Shielding | 275’ | 5500 | 1512 |
| Removals | LS | 250 | |
| Fill | 726350 cu M | 18 | 13075 |
| Berm Stabilization | LS | 800 | |
| Primary Beam Tunnel & Liner | 1100’ | 1200 | 1320 |
| Decay Tunnel & Liner | 615’ | 600 | 369 |
| Target Area Footings | 600 cu yds | 500 | 300 |
| Beam Dump Footings | 300 cu yds | 500 | 150 |
| Retaining Walls | 800 cu yds | 600 | 480 |
| Road Improvements | LS | 500 | |
| Target Area Shielding | 6200 tons | 350 | 2170 |
| Power/high & low Voltage Distribution | LS | 4250 | |
| Water/Sanitary/Storm | LS | 1350 | |
| Power Supply Houses | |||
| Lower Beam 40 x 100 | 4000 sq ft | 250 | 1000 |
| Upper Beam 20 x 80 | 1600 sq ft | 250 | 400 |
| Target Building 50’ x 55’ | 2750 sq ft | 500 | 1375 |
| Near Detector Underground Facility | LS | 6750 | |
| Near Detector Building 30’ x40’ | 1200 | 300 | 360 |
| Cooling Tower 3.5 MW | LS | 1850 | |
| Cooling Tower .5 MW | LS | 150 | |
| Monitoring Wells | 5 | 25000 | 125 |
| Conventional Total | 38,536 |
| Beam Components | Quantity | $/unit | Cost (k$) |
|---|---|---|---|
| 39 Degrees Vertical Bend | 20 Dipoles | 100,000 | 2000 |
| 68.2 Degrees Horizontal Bend | 28 Dipoles | 100,000 | 2800 |
| Quads | 14 | 90,000 | 1260 |
| H&V Trim Magnets | 18 | 45,000 | 810 |
| BPM’s | 12 | 25,000 | 300 |
| Current Transformers | 2 | 35,000 | 70 |
| Vacuum Components | 1200 | 2000 | 2400 |
| Trim PS’s | 18 | 25,000 | 450 |
| Quad PS’s | 14 | 75,000 | 1050 |
| Horiz. Bend PS | 1 | 300,000 | 300 |
| Vert. Bend PS’s | 3 | 150,000 | 450 |
| PS & Instr. Controls | 300 Devices | 8,000 | 2400 |
| Instrumentation -Flags/Loss Monitors/etc | 25 Devices | 30,000 | 750 |
| Security Hardware | 3 Gates | 50,000 | 150 |
| Horn Power Supply | 1 | 3200 | |
| Horns + spare horn1 & Target | LS | 538 | |
| Components Total | 18,928 |
| Installation | Quantity | $/unit | Cost (k$) |
|---|---|---|---|
| Installation Materials | 100 Devices | 5000 | 500 |
| Remove/Install Beam Dump | 25,000 tons | 20 | 500 |
| Install Target Area Shielding | 6200 tons | 10 | 62 |
| Magnet Installation | 77 | 10,000 | 770 |
| Vacuum Installation | 1200 ft | 200 | 240 |
| Instr. Installation | 40 Devices | 10,000 | 400 |
| Power & Tray Installation | 8 my | 800 | |
| Security System Installation | 6 my | 600 | |
| Horn Installation | 4 my | 400 | |
| Installation Total | 4,272 |
| Conventional Construction | Cost (k$) |
|---|---|
| Conventional | 38,536 |
| Beam Components | 18,928 |
| Installation | 4,272 |
| Total direct costs | 61,736 |
References
- [1] M. Diwan, W. Marciano and W. Weng, “Report of the BNL Neutrino Working Group”, Informal Report, BNL-6995.
- [2] M. Diwan, et al., “Very Long Baseline Neutrino Oscillation Experiments for Precise Measurements of Maxing Parameteres and CP Violating Effects”, submitted to Phys. Rev. D, hep-ph/0303081, March 2003.
- [3] W. T. Weng, “Performance and Measurements of the AGS and Booster Beams”, AIP Conf. Proc. 377, P. 145-157, 1995.
- [4] W. T. Weng and T. Roser, “The AGS High Power Upgrade Plane”, AIP Conf. proc. 642, P. 56, 2002.
- [5] Superconducting Radio Frequency Linac for the Spallation Neutron Source, SNS-110020300TR0001R000, November 22, 1999.
- [6] G. W. Wheeler, K. Batchelor, R. Chasman, P. Grand, J. Sheehan, “The Brookhaven 200-MeV Proton Linear Accelerator”, Particle Accelerators 9 (1979) 1-156.
- [7] J.G. Alessi, et.al., “Upgrade of the Brookhaven 200 MeV Linac”, Proc. 1996 Linear Accel. Conf., CERN 96-07, p. 773, 1996.
- [8] A. G. Ruggiero, “Design Considerations on a Proton Superconducting Linac”.BNL-Internal Report 62312, August 1995.
- [9] A. G. Ruggiero, “Negative-Ion Injection by Charge Exchange at 2.4 GeV”. BNL-Internal Report 62310, September 1995.
- [10] D. Raparia, progress report, 2002.
- [11] The program is available by making request to A. G. Ruggiero.
- [12] Vector Fields computer code for electromagnetic calculations.
- [13] I. Marneris Private communication.
- [14] D.S. Barton “Charge Exchange Injection at the AGS” BNL Int. Rep. 32784 and Particle Accelerator Conference, Santa Fe NM, March 1983.
- [15] AGS_BATE is a modification of the code BEAM. The code uses the experimentally measured fields at the median plane of the AGS magnets to ray trace the charged particles. The code provides also transport matrices at any location along a trajectory and beam parameters at any location along a closed orbit.
- [16] N. Tsoupas, H.W. Foelsche, J. Claus and R. Thern, “Closed Orbit Calculations at AGS and Extraction Beam Parameters at H13” AD/RHIC/RD-75.
- [17] N. Tsoupas et. al., “Fast Extracted Beam (FEB) for the g-2 Experiment” CA/AP/54.
- [18] M. Blaskiewicz and A. Luccio,“Proton Injection into the AGS Booster” Booster Technical Note No. 195A.
- [19] N. Tsoupas et. al.,“A computer code to measure the Beam Emittance and Beam Parameters of the AtR Line” C-A/AP/42.
- [20] N. Simos, “Horn/Target conceptual Design”, BNL Neutrino Working Group internal draft.
- [21] G. Acquistapace, J.M. Maugain, F. Voelker, “Considerations on a 75 Hz pulsed horn”, CERN, 05, 2000.
- [22] K. Bourkland, K. Roon, D. Tinsley, “205 kA Pulse Power Supply for Neutrino Focusing Horn”, 2002 PMS.
- [23] G. Grawer, “Investigation of the possibility to build a 400 kA pulse current generator to drive a magnetic horn”, CERN-NUFACT Note 038, July 19, 2000.
- [24] J. Sandberg, et.al. “The Neutrino Horn 300 Kiloampere Pulsed Power Supply at Brookhaven National Laboratory”, PAC 1987.
- [25] K. Bourkland, C. Jensen, D. Tinsley, “ High Current Pulse Striplines”, 2001 PPPS.
- [26] A. J. Stevens, private communication to D. Beavis, “MCNPX 2.1.5 Shielding Estimates in a Simple Tunnel Geometry”, 2002.
- [27] K. Tesch and H. Dinter, Radiation Protection Dosimetry, Vol. 15 No. 2 pp89-107, 1986.
- [28] A. H. Sullivan, “A Guide to Radiation Protection and Radioactivity Levels Near High Energy Particle Accelerators”, Nuclear Technology Publishing, 1992.
- [29] D. Beavis, AGS/EP&S/Tech. Note No. 130, 1988.
- [30] Design Pratice Specification for Know Beam-Loss Locations, BNL SBMS, http://www.rhichome.bnl.gov/AGS/Accel/SND/EMS/beamLoss.pdf.