Online and Offline Computing systems in the PHENIX experiment
Abstract
PHENIX phenix is one of two large experiments at Brookhaven National Laboratory’s Relativistic Heavy-Ion Collider (RHIC). At the time of the conference, the PHENIX experiment was about halfway through the 2003 run, which started in January 2003. In preparation for the run, the PHENIX data acquisition, the computing infrastructure, and the software have undergone several upgrades. Those upgrades boost the recorded data rate to about 100 MB/s and allow for a fast reconstruction only a few weeks after the data have been taken. As part of the upgrade, essentially all servers in the Online System have been converted from Solaris to Linux, and a new Linux computing farm has been commissioned at the experimental site that is used to prepare for a rapid offline reconstruction pass. This paper presents a general overview of PHENIX computing. We will explain the current status, the changes, choices of software and hardware, and discuss our experience with the new setup.
I Introduction
PHENIX [1] consists of 4 large spectrometer arms, two central arms and two forward Muon arms. There is a total number of about 350,000 readout channels, giving a typical event size of about 110 KB/event. The typical sustained readout rate is slightly more than 1 KHz, which results in a data rate of about 120 MB/s. The so-called Run 3 of RHIC was set up with d-Au beams at 200 GeV/c per nucleon, and, in the second half, polarized protons at 200 GeV/c.
In the months leading up to Run 3, which started in January 2003, we upgraded several key components of the data acquisition and the online computing system.
-
•
we replaced essentially all servers running the Solaris operating system with machines running Linux;
-
•
we replaced a component in the data transfer, the “ET” system, with a server process that significantly reduces overhead and allows a data logging rate of about 120 MB/s.
-
•
we commissioned another computing farm at the experimental site that is used for online calibration-related analysis and event filtering.
II Data Flow in PHENIX
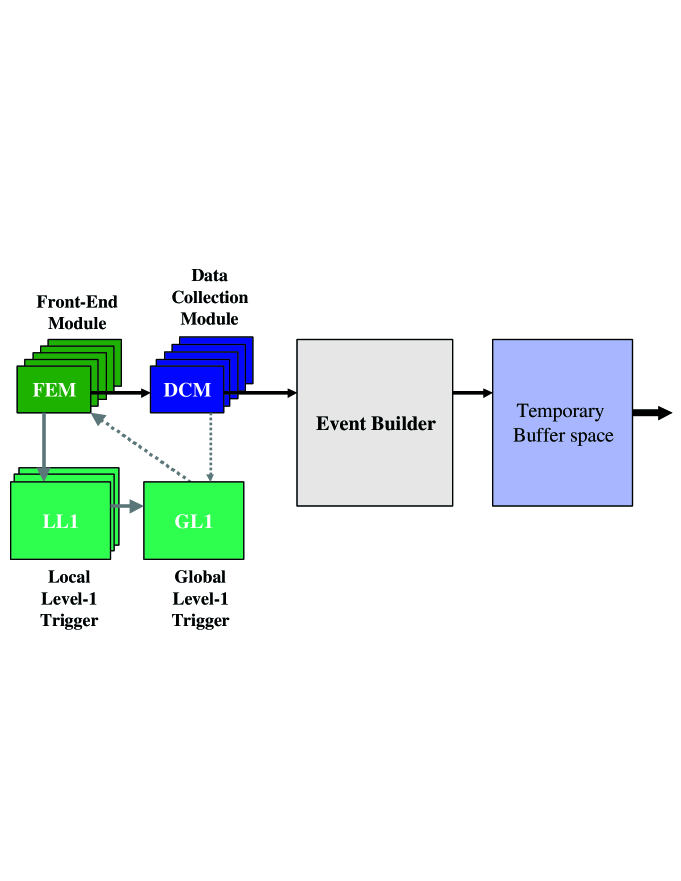
Fig. 1 shows a schematic view of the data flow in PHENIX. The detector signals are digitized in Front-End Modules (FEM) with a number of channels ranging between 12 and several hundred, depending on the detector. The digitized data are sent via optical fiber to Data Collection Modules (DCM), which receive the data, package them, and send the data on to the Event Builder, which assembles the event fragments into whole events (fig. 2).
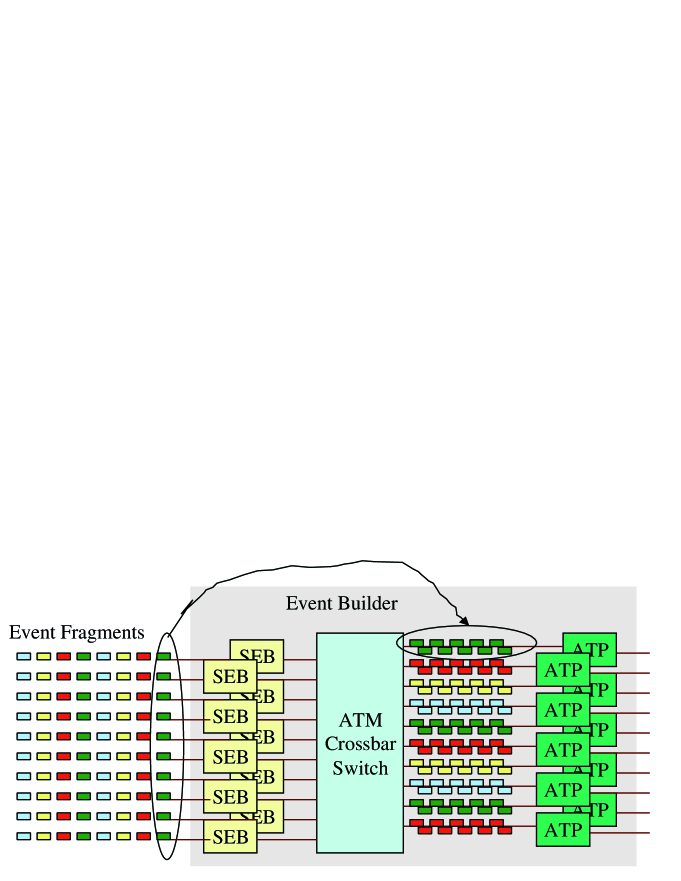
The SubEvent Buffers (SEB) receive the data from the DCMs and send the parts from one event through an ATM-based crossbar switch to an Assembly and Trigger Processor (ATP). While the number of SEBs is fixed by the way the front-end connections are structured, the number of ATPs is not fixed and more machines can be added to increase the computing power. The ATPs assemble the event fragments into a whole event and, because this is the first time that the data of a whole event are available in one place, runs a Level-2 trigger on the data.
The ATPs pass the data on to “Buffer Boxes”, two PC’s with 2 TB disk space each, which temporarily store the data on disk until they are shipped off to an HPSS-based tape robot in the RHIC Computing Facility (RCF). Those PC’s have dual Alteon Gigabit network interface cards, one on the local network and the other one on a high-speed network connecting to the RCF. The latter network uses Jumbo frames (9000 bytes MTU size).
The buffering of the data on the buffer disks allows the sending of data to the RCF to gracefully survive any short-term service interruptions of the tape robot. This buffering also enables us to feed the tape robot a steady stream of data independent of the ebb and flow of the DAQ system. And since the transfer to HPSS does not need all the capacity of the buffer machines, the data are available for near-line analysis processes such as detector calibrations and event filtering for several hours before we need to make room for new data.
The data logging mechanism was replaced recently. Before, we used a system called “ET” (“Event Transfer”) timmer (explained in more detail later) to merge the data streams from the ATPs. Events get injected into an ET system and retrieved by the logger and written to disk. For efficient network transfers, the ATPs send buffers of data of variable length with an average number of about 15 events. In the old system, this buffer would get disassembled into individual events which got injected into the pool, then re-assembled into buffers by the logger. This caused a lot of overhead that limited the data rate to about 25 MB/s per buffer machine.
We replaced this system with the Advanced Multi-threaded Logger (AML). The AML spawns a thread for each incoming network connection from the ATPs, and the threads receive the data from the network in parallel. When a buffer is received, the thread obtains a lock on the output file and writes the buffer as it was received without any disassemble and re-assemble overhead. The reason why threads are used is to make the locking mechanism efficient. This change boosted the data rate to about 60 MB/s per buffer machine.
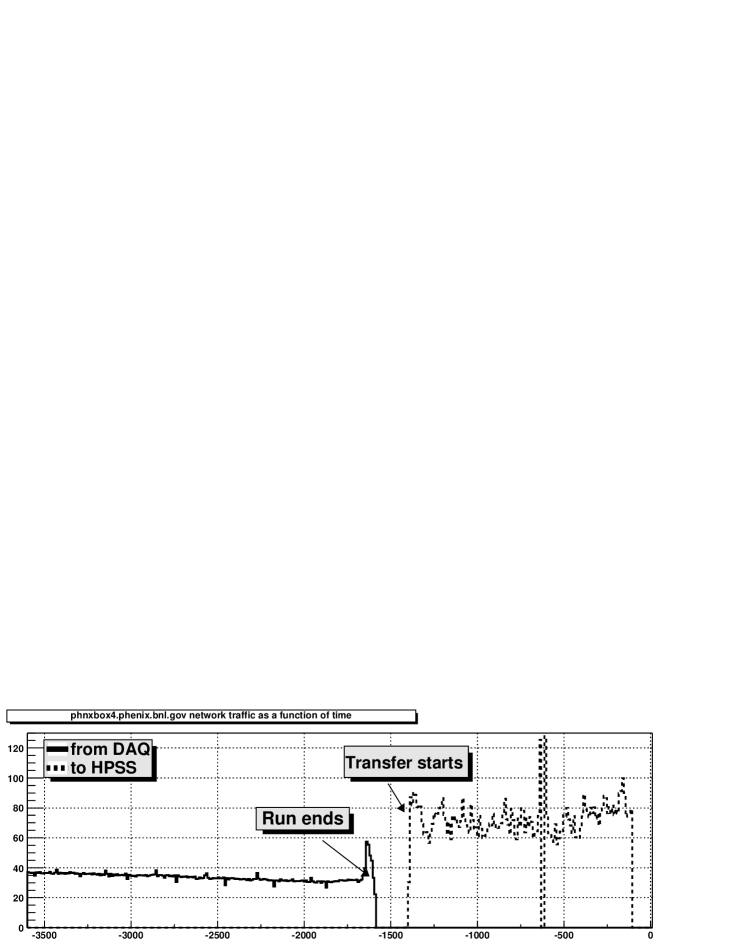
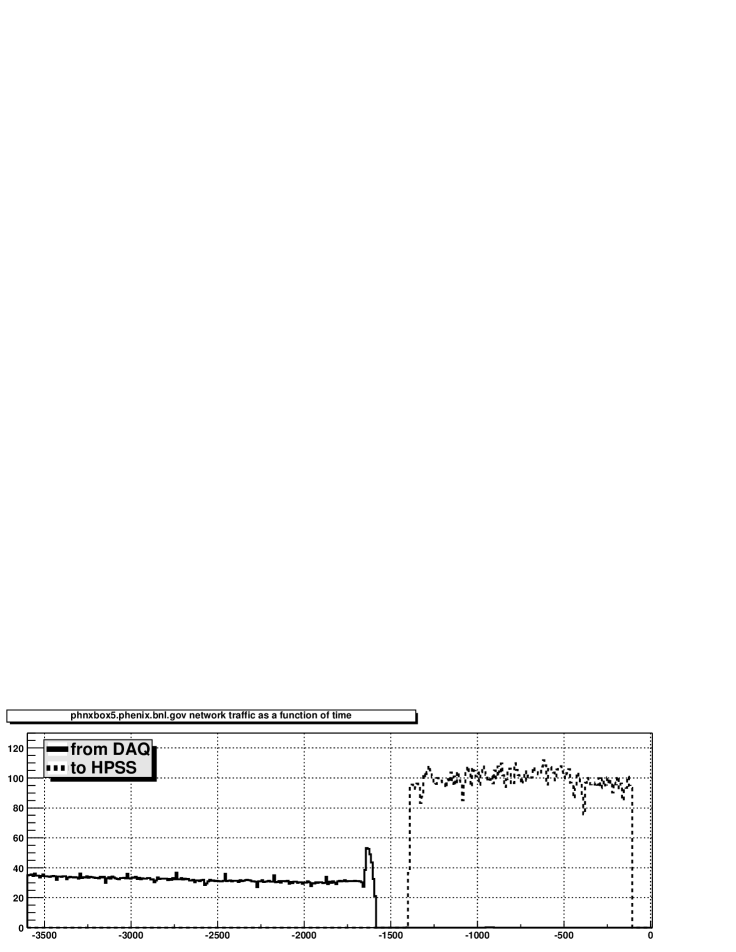
Fig. 3 shows a strip chart of the data transfer rates measured in the system. For the two buffer machines, we measure the data throughput through the two network cards for both machines. The data represent approximately 60 minutes of data. The snapshot shown starts toward the end of a RHIC fill, and one can see the luminosity decrease over the course of the first 30 minutes, giving modest data rates of about 65 MB/s with those beam conditions (solid line). When the beam got dumped, our trigger detectors were sprayed with particles, and the data rate surges to about 120 MB/s for a short moment. We then ended the run, and started the data transfer to HPSS (dashed line), which runs at about 175MB/s for both machines combined.
III Online- and Near-line Monitoring
PHENIX has a successful tradition of using just one analysis software package in online and offline. In this way, users have just one learning curve, and there is only one set of libraries. In offline and batch processing, the online capabilities are just not used.
We make use of the multi-threading capabilities of ROOT ROOT to look at histograms and other information while data are being processed by a background thread, which is required for online monitoring. This framework, called pMonitor, is used for all online monitoring tasks. It can read all supported types of data streams (file, ET pools, and others), which is fully transparent to the user. Other packages (reconstruction, online calibrations, monitoring) build on that basic framework.
For the data distribution among the various online monitoring processes we use the “ET” system. The system consists of data pools, into which processes can inject events, and other processes can retrieve the events in various ways. The system supports a virtually unlimited number of writers and readers. The ET system supports a variety of access modes. Data can be tagged with additional information (for example, the trigger type of that event) at the time when they get inserted into the pool. Processes can then request only events whose tags meet certain requirements and so request only events they are truly interested in. Another access mode is “shared stream”, where a stream normally delivered to one consumer process is split among two or more on a first-come, first-serve basis for load balancing purposes. Normally, the same events get delivered to each consumer.
Before the switch to the AML, a consumer process would request data from the main ET pool where the data from the ATPs got merged, and feed them into a secondary pool where all monitoring process read from. With the AML, the ET system is no longer part of the logging mechanism. However, the logger breaks the output stream up into files of about 1.5 GB, and at full speed, a new file is opened and the old one closed approximately every 30 seconds. We now wait for a file to be closed, and read a few hundred events from it and insert them into the ET pool where the monitoring processes read from. In this way, we did not need to change anything in the setup, and the only difference is a time lag of about 30 seconds before the data reach the monitoring processes.
A DAQ run in PHENIX is about one hour worth of data taking, which yields a data volume of approximately 400GB at full speed, which gives about 250 files of 1.5 GB. Several quantities, such as calibration constants, are valid for a whole run and usually need to be derived from the data of the whole run. The time when the data are still in the buffer disks is the last time when all run fragments are conveniently together in the same place, and we use that opportunity to analyze the data in various ways.
One of the goals is to have all the required calibrations constants for the event reconstruction ready by the time the data have to be deleted from the buffer disks. This will reduce the load on the offline computing farm and the tape robots because fewer data retrieval operations will be needed, and allow a faster analysis of the data. In addition, if the calibration constants can be derived within hours, the Level-2 trigger algorithms can make use of them as well.
Another goal is to extract events taken with certain triggers in order to determine the trigger efficiencies. We write those events to other files and analyze them in various ways. For example, we fully reconstruct events, determine the invariant mass of photon-like clusters in the electromagnetic calorimeter, fit the peak corresponding to mesons, and extract the mass from the fit parameters. Obtaining the expected mass is taken as a sign that the current calibrations are roughly correct.
IV Software Choices
When making software choices, we had to take into account the fact that the collaboration consists of more than 400 scientists from many countries. Software in everyday use has to be freely available to all collaborators, and must be free of export and other restrictions. As much as possible, PHENIX uses Open-Source software or software under the GNU Public License (GPL), which makes the software available to everyone. Also, open-source and GPL software is virtually guaranteed to be available for the operating systems we use, which is not always the case for proprietary software.
There is only one proprietary software package in use that is needed by most collaborators, the Objectivity Database system. A special license arrangement makes the software available to all collaborators, and the company has been forthcoming in resolving perceived licensing conflicts. Still, the software is available only for a certain compiler version, which imposes restrictions on operating system upgrades. We will try to reduce the use of the software as much as possible in favor of open-source database systems.
In the data acquisition system, two more proprietary packages are in use. One is a CORBA implementation from Iona, ORBIX, which is used for all inter-process communications. The proprietary VxWorks operating system is used in several front-end processors. Since the software is not used outside the DAQ system, the availability is not an issue, but there is concern about the market-driven direction of the future development.
V Data management
With multiple-TB data sets, the management of the data becomes an important aspect. Early on, we restricted the database to management of meta-data, data about file locations, and properties, but not the raw data itself. In routine running, we need to distribute files automatically across file servers to balance the server load, and we also need to avoid the replication of files and resolve ownership issues (when can a file be deleted? When copied?). Also, there is the aspect of replicating popular files and accessing the “nearest copy”.
We are using a Data Carousel interface to the HPSS system that pools file requests and minimizes tape mounts. This gives us a performance boost of about a factor of 7 over an unmanaged first-come, first-serve model. On top of that we implemented a package called ARGO, which is a file catalog system that keeps track of where files are located. We also added a name-based identification of files which queries a database to locate a file. This system is called FROG (“File Replica On a Grid”) which has been integrated into pmonitor. There are also APIs and Web interfaces to ARGO.
VI Future Plans
Several enhancements are planned for the Run 4, which will start in fall of 2003. We will replace the ATM switch in the Event builder with a Gigabit switch, and increase the number and capacity of the buffer machines.
Another planned enhancement has been made possible with the AML. PHENIX has long had a raw data standard that includes a compressed raw data format (which is not a compressed data file, which would need to get uncompressed before reading). A buffer that would normally be written out to a file is instead compressed with the gzip-compression algorithm. The resulting smaller sequence of data is then put into another buffer whose header specifies that the payload is a complete compressed buffer. This new, smaller buffer gets written out instead. On readback, the I/O system recognizes the buffer header, uncompresses the buffer into the original one, and passes this uncompressed buffer on to the next software layer. In this way, the compression is handled completely on a relatively low level of the I/O system, and is transparent to the higher-level layers.
The compressed data format shrinks the size of the buffer to approximately 45% of the original buffer size. However, the compression algorithm is very CPU time-consuming; on a fast CPU, one second worth of data would need 3 seconds to get compressed. Before the use of the AML, buffers to be written out were assembled in the logger, and the CPU of the buffer machines would need to perform that compression. This is much too slow and prevented the use of the compressed data scheme in the data acquisition so far.
However, the AML now just receives and writes out ready-made buffers from the ATPs, which could send already compressed buffers. In this way, it is possible to distribute the load over many CPUs, and add more processors as the need arises. For the next run we will try to write compressed data routinely, which would essentially double the disk capacity or the data rate, or a combination of both.
VII Summary
For the Run 3 of the RHIC accelerator, we have upgraded out data acquisition system and the online computing infrastructure in several ways. We were able to boost the recorded data rate to about 120 MB/s, and perform online calibrations, event filtering, and online reconstruction of selected events before the data leave the counting house.
We have integrated a resource management system with our core analysis packages, which will help to manage our resources better and increase the throughput in the reconstruction processes.
For the next run, we will complete the transition to Gigabit networks in all core DAQ components, and try to implement the routine compressed data output.
References
- (1) K. Adcox et al, ”PHENIX detector overview”, Nucl. Instr. Meth A 499, 2003, pp 469-479.
- (2) K. Timmer et al, Jefferson Laboratory, private communication.
- (3) R. Brun et al, “ROOT: An Object-Oriented Data Analysis Framework”, The Linux Journal 51, July 1998.