CLEO Collaboration
Observation of a Narrow Resonance of Mass 2.46 GeV/c2
Decaying to
and Confirmation of the State
Abstract
Using 13.5 fb-1 of annihilation data collected with the CLEO II detector, we have observed a narrow resonance decaying to , with a mass near 2.46 GeV/c2. The search for such a state was motivated by the recent discovery by the BaBar Collaboration of a narrow state at 2.32 GeV/c2, the , that decays to . Reconstructing the and final states in CLEO data, we observe peaks in both of the corresponding reconstructed mass difference distributions, and , both of them at values near 350 MeV/c2. We interpret these peaks as signatures of two distinct states, the plus a new state, designated as the . Because of the similar values, each of these states represents a source of background for the other if photons are lost, ignored or added. A quantitative accounting of these reflections confirms that both states exist. We have measured the mean mass differences MeV/c2 for the state, and MeV/c2 for the new state. We have also searched, but find no evidence, for decays of the two states via the channels , , and . The observations of the two states at 2.32 and 2.46 GeV/c2, in the and decay channels respectively, are consistent with their interpretations as mesons with orbital angular momentum , and spin-parity and .
pacs:
14.40.Lb, 13.25.Ft, 12.40.YxI Introduction
The BaBar Collaboration has recently reported babar evidence for a new narrow resonance with a mass near 2.32 GeV/c2, which decays to . The BaBar data are consistent with the identification of this state as one of the four lowest-lying members of the system with orbital angular momentum , and provisionally it has been named the meson. A natural candidate would be the meson with spin-parity , but other possibilities, including exotic states, are not ruled out. In this paper, we report on a search for the meson, as well as other, possibly related states, in data collected with the CLEO II detector in symmetric collisions at the Cornell Electron Storage Ring, at center-of-mass energies GeV.
The spectroscopy of -wave mesons is summarized in Ref. bartelt . Prior to the observation of the , theoretical expectations rgg ; gi ; iw ; gk ; dipe were that: (1) all four states with are massive enough that their dominant strong decays would be to the isospin-conserving and/or final states, (2) the singlet and triplet states could mix, and (3) in the heavy quark limit, the two states with would be narrow while the two with would be broad, where is the sum of the strange quark spin and the orbital angular momentum. Existing experimental evidence pdg ; cleods2 for the narrow and mesons which decay dominantly to and respectively, and the compatibility of the with the assignment as support this picture.
The observation by BaBar babar of the new state at a mass of 2.32 GeV is surprising because: (1) it is narrow (with intrinsic width MeV), (2) it has been observed in the isospin-violating channel, and (3) its mass (MeV/c2) is smaller than most theoretical predictions for a state that could decay via this channel. However, points (1) and (2) would be obvious consequences of the low mass, since the decay modes are not allowed kinematically. We also note that at least two theoretical calculations nrz ; bh prior to the observation had suggested that, in the heavy quark limit, the states with and could be thought of as chiral partners of the and mesons, and thus would be relatively light. In one model bh it was proposed that the mass splittings between the and states of heavy flavored mesons could be as small as 338 MeV/c2, which is near the mass splitting of MeV/c2 measured by BaBar.
Since the initial observation, a number of explanations have appeared cahnjackson ; barnescloselipkin ; beverenrupp ; bardeeneichtenhill ; szczepaniak ; godfrey ; colangelodefazio ; bali . Cahn and Jackson cahnjackson apply non-relativistic vector and scalar exchange forces to the constituent quarks. Barnes, Close and Lipkin barnescloselipkin consider a quark model explanation unlikely and propose a molecular state. Similarly, Szczepaniak szczepaniak suggests a atom. Also going beyond a simple quark model description, Van Beveren and Rupp beverenrupp present arguments for a low mass state based on a unitarized meson model, by analogy with members of the light scalar meson nonet. Bali bali reports on lattice QCD calculations that predict signficantly larger meson mass splittings than what has been observed for the splitting.
On the contrary, Bardeen, Eichten and Hill bardeeneichtenhill couple chiral perturbation theory with a quark model representation in heavy quark effective theory, building on the model described in Ref. bh . They infer that the is indeed the state expected in the quark model, predict the existence of the partner of this state with a mass splitting equal to the mass splitting, and compute the partial widths for decays to allowed final states. Godfrey godfrey and Colangelo and De Fazio colangelodefazio find that the radiative transistion of the should be significant if it is indeed a state.
The goals of the analysis presented here are to use CLEO data to provide independent evidence regarding the existence of the , to shed additional light on its properties, and to search for decays of other new, possibly related states. In particular, we address the following questions. Are the electromagnetic decays or observable in light of the isospin suppression of the strong decay to ? Are other strong decays observable such as , or the isospin-conserving but Okubo-Zweig-Iizuka (OZI) suppressed ozi decay ? If the is the expected state, might the remaining state also be below threshold for decay to , as suggested in Ref. bardeeneichtenhill , and thus be narrow enough to be observable in its decays to , or ?
This article cleohepex is organized as follows. After describing the detector and data set in Section II, we summarize the reconstruction of the decay channel in Section III, including efforts to understand and exclude contributions from known background processes. We then report in Section IV on searches for other possible decay channels as described in the preceding paragraph. In Section V, we report on the appearance of a statistically significant signal in the channel at a mass of 2.463 GeV/c2, not compatible with a kinematic reflection of the . We describe a quantitative analysis of the signals in the and channels, leading us to infer the existence of two distinct states. Based on this conclusion, we discuss the properties of these two states in Section VI, after which we summarize the principal results of the analysis.
II Detector and Data Set
The analysis described here is based on 13.5 fb-1 of collision data collected between 1990 and 1998. CLEO II is a general purpose, large solid angle, cylindrical detector featuring precision charged particle tracking and electromagnetic calorimetry, and is described in detail in Refs. Kubota:1992ww ; Hill:1998ea . In its initial configuration, the tracking system was comprised of a six-layer straw tube chamber just outside of a 3.2 cm radius beryllium beam pipe, followed by a 10 layer hexagonal cell drift chamber and a 51 layer square cell drift chamber, immersed in a T magnetic field generated by a superconducting solenoid. In 1995, the beam pipe and straw tubes were replaced by a 2.0 cm radius beam pipe plus three layers of silicon strip detectors each with double-sided readout, and a helium-propane gas mixture replaced the argon-ethane mixture previously used in the main drift chamber.
Beyond the tracking system, but within the solenoid, were also located a 5 cm thick plastic scintillation counter system for time-of-flight measurement and triggering, and a barrel calorimeter consisting of 6144 tapered CsI(Tl) crystals 30 cm in length, arrayed in a projective geometry, with their long axis oriented radially with respect to the interaction point. An additional 1656 crystals were deployed in two end caps to complete the solid angle coverage. The excellent energy and angular resolution of the calorimeter is critical for the reconstruction of decays as well as single low-energy photons such as those emitted in the transition.
III Confirmation of
The search for the was carried out by reconstructing the state, using the channel with . Charge conjugation is implied throughout this article. Pairs of oppositely charged tracks were considered as candidates for the decay products of the if the specific ionization () was measured in the main drift chamber to be within 2.5 standard deviations of the expectation for a kaon, and if the invariant mass of the system was within MeV/c2 of the mass. A third track with consistent with the expectation for a pion was combined with the system to form a candidate with mass . To improve resolution we adjust the momenta of the three particles subject to the constraint that their trajectories intersect at a common point corresponding to the decay point of a meson. When fitted to a Gaussian, the observed mass peak has a standard deviation () of MeV/c2 in our data, consistent with CLEO Monte Carlo simulations of production and decay plus a GEANT-3 geant based simulation of particle propagation and detector response.
Clusters of energy deposition in the calorimeter unassociated with charged particle interactions were identified as potential photon candidates. To be considered as candidates for the photons from decay, clusters with energy greater than 100 MeV located in the central region of the calorimeter (, where is measured with respect to the beam axis) were selected. Pairs of photons were required to satisfy , where is the invariant mass of the two photons and is the expected resolution on this mass. For each cluster being considered as a photon candidate, we additionally required that the lateral profile of energy deposition in the calorimeter be consistent, at the confidence level, with expectations for photons. This requirement removes spurious photon candidates that are mainly due to inelastic interactions of charged hadrons or long-lived neutral hadrons. The peak in the distribution for photon-pairs accompanying a candidate with between 1.9565 and 1.9805 GeV/c2 has MeV/c2 in our data, consistent with expectations from the Monte Carlo simulations. Once identified as a candidate, the directions and energies of the two photons are adjusted with a kinematic fit to reconstruct to the known value pdg for the mass .
To suppress combinatoric backgrounds, we further required that the momentum of the candidate be greater than GeV/c. We also required that the helicity angle of the decay satisfy the requirement , where is the angle between the momentum vector measured in the rest frame, and the momentum vector measured in the rest frame. The expected distribution from real decays varies as , whereas combinatoric backgrounds tend to be flat. For combinations satisfying these requirements, we plot the mass and the mass difference in Fig. 1(a) and (b), respectively.
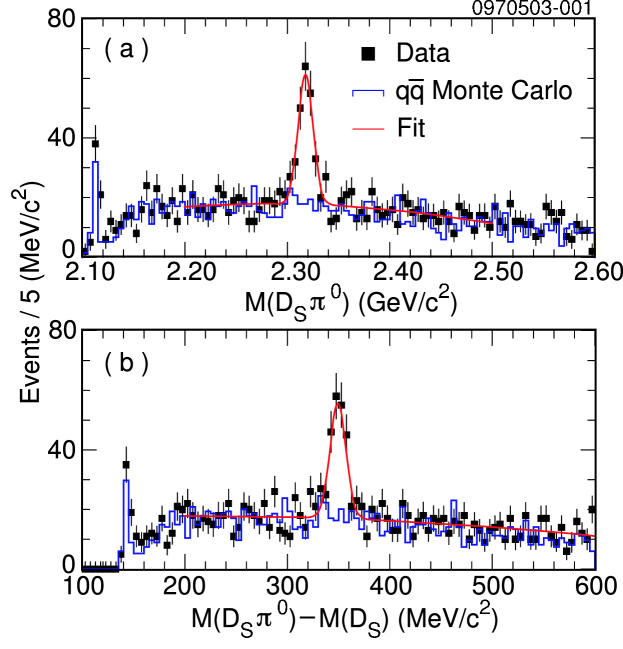
To improve the experimental resolution on , the known value of the mass, MeV/c2 pdg , has been used to determine the energy of the system from its measured momentum in Fig. 1(a); this substitution is not done for in Fig. 1(b), or for the calculation of other mass differences entering this analysis.
The narrow peaks in Fig. 1 at a mass near 2.32 GeV/c2 and a near 350 MeV/c2 are in qualitative agreement with the BaBar observation. We note that there are no peaks in this region when combinations with lying in side band regions are combined with a . The other feature of note in the spectra is the sharp signal from cleodspi0 near the kinematic threshold. In addition, Monte Carlo simulations of inclusive multi-hadron production via () give and spectra that reproduce the features observed in the data, except for the peaks near 2.32 GeV/c2 and 350 MeV/c2 in the respective plots. This is also illustrated in Fig. 1, where the normalization for the Monte Carlo spectra is fixed by the ratio of the luminosity of the data sample to the equivalent luminosity of the Monte Carlo sample. This normalization is known to a precision of approximately .
The agreement between the Monte Carlo and data distributions in Fig. 1 in normalization as well as shape demonstrates that the simulation of ‘random’ photons accompanying decays is accurate. The accuracy of this simulation is important for our detailed analysis of this signal, described in Section V.1.
We have investigated mechanisms by which a peak at 2.32 GeV/c2 could be generated from decays involving known particles, either through the addition, omission or substitution of a pion or photon, or through the mis-assignment of particle masses to the observed charged particles. In no cases were narrow enhancements in the spectrum near 2.32 GeV/c2 observed. We will discuss the issue of backgrounds from a new resonance at 2.46 GeV/c2 when we describe our studies of the final state.
From a binned maximum likelihood fit of the distribution to a Gaussian signal shape and second-order polynomial background function, we obtain a yield of events in the peak near 350 MeV/c2. In this fit, the mean and Gaussian width of the peak are allowed to float. These parameters are determined to be MeV/c2 and MeV/c2, where the errors are due to statistics only. The peak is somewhat broader than the expected mass resolution of MeV/c2, determined from Monte Carlo simulations. The detection efficiency associated with the reconstruction of the full , , decay chain is for the portion of the momentum spectrum above GeV/c, where this efficiency does not include the and decay branching fractions.
Thus, we confirm the existence of a peak in the mass spectrum that cannot be explained as reflections from decays of known particles. Our measurements of the mean mass difference and width of the peak are consistent with the values obtained by BaBar babar for the . Further discussions of the width, as well as of systematic errors in the measurements of the mass and width of the appear later in this article.
IV Searches for in other channels
The conclusion that the is a new narrow resonance decaying to leads to two questions: (1) are there other observable decay modes, and (2) might additional new resonances also exist in which normally suppressed decay modes such as are dominant? To answer these questions we have searched in the channels , , and .
If the is a meson, as has been suggested bardeeneichtenhill , it could decay via - or -wave to , but would not be able to decay to due to parity and angular momentum conservation. Consequently, observation of one or both of these channels would be interesting. On the other hand, if neither channel is seen, this would not be too surprising since these are electromagnetic decays, and the decay, while isospin violating, is not as severely phase-space suppressed as in the case of the corresponding decay of the where the electromagnetic decay dominates. The BaBar data show no evidence for either channel, however no upper limits were reported on the branching ratios for these channels.
With regard to strong decays, the final state is kinematically allowed and isospin conserving, but would be suppressed by the OZI rule. This is in contrast to the channel for which one mechanism would be decay to a plus a virtual , with production of the via - mixing cho . However, angular momentum and parity conservation forbid the decay of a state to three pseudoscalars. Thus, observation of the channel would be strong evidence against the interpretation of the as a meson.
Finally, it is possible that the remaining state with could also be light enough that decays to would be kinematically forbidden. In this case, the strong isospin-violating decay of this state to could occur via -wave (the electromagnetic decays to or would also be possible), and thus a narrow peak in the spectrum would be a signature of such a state.
IV.1 Searches for decays to , and
To look for these channels we select events containing candidates as in the analysis. For the channel, we combine the candidates with two oppositely charged tracks, and plot the mass difference . As shown in Fig. 2, no signal is evident in the vicinity of 350 MeV/c2.

To search for states decaying to , we have formed combinations by selecting photons of energy greater than 150 MeV. To select candidates for use in other searches, we relax this to include photon candidates with energy above 50 MeV. We ignore photons that can be paired with another photon such that is consistent with decay. The inclusive spectrum for this sample is plotted in Fig. 3(a), illustrating that a large sample can be obtained. For decay modes with a in the final state, we select combinations where the mass difference is reconstructed to be between 0.1308 and 0.1568 GeV/c2.

Also visible in Fig. 3(a), are regions of the spectrum where decays of the (or of a possible higher mass state) into would appear. There is no evidence for a signal near 350 MeV/c2 corresponding to a in the vicinity of 2.32 GeV/c2.
The same conclusion holds for the final state, shown in Fig. 3(b), where we combine selected candidates with photons of energy above 150 MeV. The peak in the spectrum in Fig. 3(b) near 150 MeV/c2 is due to real decays in which a random photon has been combined with the candidate to form the candidate, and the actual photon from this transition is combined with this system to form the candidate. There is no sign of any structure in this spectrum near 205 MeV/c2, where a signal from decay would be expected.
IV.2 Search for decays to
We have also searched in the channel for states. To maintain efficiency for this final state, we do not veto candidates where the photon used in the reconstruction can be combined with an extra photon to form a decay candidate. We also applied slightly less restrictive track quality and shower shape criteria than in the analysis. As with the modes involving candidates described the preceding section, the energy of photons selected for reconstruction of the decay is required to satisfy MeV. The candidates are required to have momenta above 3.5 GeV/c. Fig. 4(a) shows the mass difference plot for events with candidate , decays plus di-photon combinations consistent with decay.
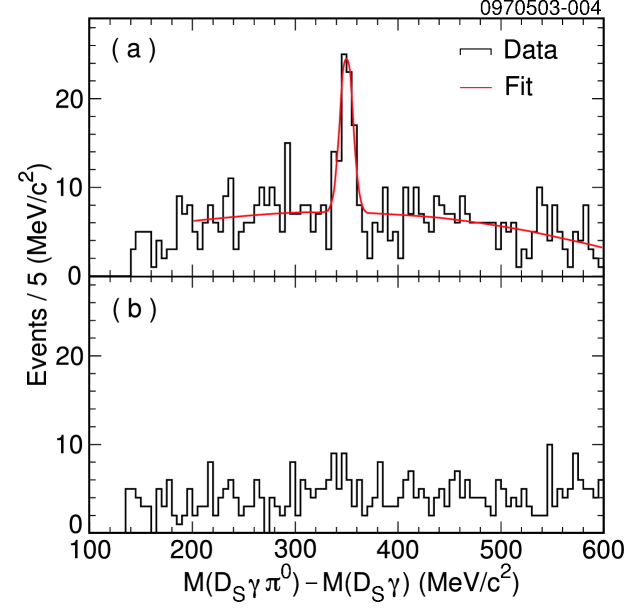
If the were to decay to the final state, a peak would be expected at a MeV/c2. Although we see no evidence for such a peak, there is a significant excess in a narrow region near 350 MeV/c2. We discuss the properties of this new peak in the following section.
V Observation of a new state at
From a fit to a signal Gaussian signal function plus a polynomial background function, we observe a peak in Fig. 4(a), comprised of combinations, at MeV/c2. The fit yields a Gaussian width of MeV/c2 for the peak, consistent with our mass resolution of MeV/c2. The existence of this peak leads us to investigate the possibility of a second narrow resonance with a mass near 2.46 GeV/c2 that decays to . We note that a similar peak is also present in the spectrum observed by BaBar babar , although BaBar does not claim this as evidence for a new state. For ease of notation, we refer to the postulated particle as the .
V.1 Analysis of cross feed between and samples
The kinematics of the and decays are quite similar, and it is possible that they can reflect into one another. For example, by ignoring the photon from the decay in decays, nearly all the putative signal combinations form a peak in the spectrum in the same region as the signal described in previous sections of this article. We refer to the background entering via this scenario in the sample as ‘feed down’ from the state. The impact of neglecting the photon is that this peak in is broader than that for real decays. From Monte Carlo simulations, we determine the width of this smeared peak to be MeV/c2.
It is also possible that a candidate can be combined with a random photon such that the combination accidentally falls in the signal region defined earlier. In this case, decays would reflect or ‘feed up’ into the signal region. A Monte Carlo simulation of production and decay to shows that this does happen, but only for approximately of the reconstructed decays. The peak in the distribution generated by this feed up sample is also broadened relative to the expectation for real decays, analogous to the smearing of the feed down kinematics discussed in the preceding paragraph.
We can extract the number of real decays reconstructed in our data, denoted as , as well as the number of real decays, denoted as , taking into account that the corresponding real signal decays in one channel can enter the candidate sample for the other channel as described above. The following linear equations relate the real to observed numbers:
| (1) |
| (2) |
where and are the numbers of observed decays in the and channels respectively, and and are the number of real decays produced times the efficiency to observe them in the corresponding signal decay channels. The coefficients and are the feed up and feed down probabilities relative to the reconstruction efficiency for the respective signal modes. We note that these relations represent first-order approximations; higher-order corrections, such as that due to the scenario where the system from a real decay is combined with an unrelated photon to form a feed up candidate, are negligible in the present case.
The observed number of decays in the channel is , obtained from the fit to the peak in Fig. 4(a) described above. For , it is desirable to obtain a sample selected with criteria that most closely match those used to select combinations, and that is enriched in decays relative to feed down from decays. Thus we apply the same selection criteria that were used for the sample, but without selecting the photon from the transition. To measure the event yield in this sample, we fit the peak in the distribution to a Gaussian with its width fixed to the Monte Carlo expectation for decays. In this fit, a significant fraction of feed down combinations is counted as part of the combinatoric background rather than as signal. We obtain candidates. This sample effectively constitutes the source of potential feed up candidates. The difference between this yield and the events reported in Section III is consistent with the different acceptances for the two sets of selection criteria.
From the Monte Carlo simulations we measure for the probability that a reconstructed can be combined with a random photon to mimic a decay. The first error is due to limited Monte Carlo statistics while the second is due to systematic uncertainties associated with: (1) the modeling of extra photons in the simulations, and (2) the fraction of such combinations that are counted by the fit to the distribution as contributing to the Gaussian signal. As indicated above, this fraction counted by the fit is less than one due to the smearing of that results when an unrelated photon is added to the system. The agreement between the data and Monte Carlo distributions in Fig. 1 lends confidence in the modeling of extra photons. We assign a relative systematic uncertainty of based on this and on studies of combinations entering side bands described in the following section. To study the second source of systematic uncertainty, we have carried out fits to the distribution in which the width of the Gaussian signal function was fixed to relative to the central value obtained from the nominal fit. Based on the resulting variation in event yields, we have estimated a relative uncertainty on of from this source.
We also obtain from Monte Carlo simulations, where the first error is statistical and the second is due to systematic errors. This includes the probability of feed down as well as the photon finding efficiency. If all decays with a reconstructed plus combination were to be counted as decays, would simply be one divided by the acceptance for finding the photon from the transition. However, because the distribution for the feed down background is broadened, a significant fraction of these combinations are not counted as part of the Gaussian signal, instead being absorbed into the polynomial background. The contributions to the relative systematic error on are estimated to be from the uncertainty on the photon-finding efficiency and from the uncertainty on the probability of feed down, obtained by performing alternate fits to the distribution.
Inverting Equations 1 and 2, we find that decays and decays, where the uncertainties include both statistical and systematic sources. The result for demonstrates the existence of a state at 2463 MeV/c2. The significance of the signal for this state, accounting for statistical and systematic errors, is determined to be in excess of by computing the probability for the combinatoric background plus the feed up background to fluctuate up to give the observed yield in the signal region in Fig. 4(a).
V.2 Further evidence for the decay
We conclude from the analysis described in the preceding section that a new state, the , exists in addition to the state reported by BaBar, because feed up from the is only a minor background component () of the narrow peak observed in Fig. 4(a). To provide further support for this conclusion, we have directly measured the feed up background in Fig. 4(a) due to plus random photon combinations, by selecting combinations in side band regions in the sample. The distribution for this sample, plotted in Fig. 4(b), shows only a small enhancement in the region of the , demonstrating that the background from decays indeed constitutes only a small fraction of the entries in the peak.
We performed a binned likelihood fit of the spectrum in Fig. 4(a) to a Gaussian signal shape plus a second-order polynomial plus the spectrum from the side band region in Fig. 4(b) with its normalization fixed. From this fit, we obtain decays, consistent with the value of obtained from Equations 1 and 2. From the change in the likelihood of fits performed with and without the signal contribution, we infer that the statistical significance of the signal is .
Finally we note that the width of the peak in Fig. 4(a), MeV/c2, is consistent with the detector resolution. If the origin of this peak was feed up from decays, then the effect of including unrelated photons to form candidates would be to smear out the distribution, in the same way that the feed down background to the state is broadened as described in the preceding section. From fits to Monte Carlo simulations of this feed up process, the expectation for the width is determined to be MeV/c2. Thus, the narrowness of the peak in Fig. 4(a) also rules out the possibility that the peak is dominantly due to feed up from decays.
VI Properties of the and States
VI.1 Mass and width of the
Having obtained evidence for the state, and having characterized the background that it contributes in the mass difference spectrum, we are now able to further address properties of the state. We recall that our measurement of the width of the peak in Fig. 1 is MeV/c2, somewhat larger than our mass difference resolution, MeV/c2. This difference is consistent with predictions from Monte Carlo simulations where we include both and production, since roughly of the observed decays in the signal region enter as feed down from the state, this ‘background’ peak having an expected width of MeV/c2.
To better determine the mass and natural width of the , we carry out a binned likelihood fit of the peak in the spectrum in Fig. 1(b) to a sum of two Gaussians, one for the signal, and one to account for the feed down from the . Allowing the means and widths of both Gaussians to float, we obtain MeV/c2 with MeV/c2 for the component. The mean mass difference and width for the feed down component are MeV/c2 and MeV/c2, respectively. The errors in the above values are due to statistics only; systematic errors are discussed below. Both widths are consistent with predictions from Monte Carlo simulations in which the two states are modeled with a natural width of zero.
We have also carried out fits in which one or both of the widths of the Gaussians were fixed to values determined by the Monte Carlo. In all cases the results were consistent with the results from the fit described above. We have also tried to obtain a purer sample by vetoing combinations with photons that can be combined with the candidate to form a , thereby removing some of the feed down background from the . This veto marginally improves the signal when we fit with two Gaussians, and the mass and width change by only a small fraction of the statistical uncertainty. The systematic uncertainty for receives contributions from uncertainties in the characterization of the feed down and from uncertainties in the modeling of the energy resolution of the calorimeter. We estimate the total systematic error on the mass difference to be 1.0 MeV/c2. Based on these studies, we limit the natural width of the to be MeV at the confidence level (C.L.).
VI.2 Mass and width of the
From the fit to the distribution resulting from the subtraction of Fig. 4(b) from Fig. 4(a) reported in Section V.2, we obtain MeV/c2 for the mass difference between the and the . The first error is statistical and the second is the systematic uncertainty which is the same as that presented in the previous section for the mass difference. From our fits to data and Monte Carlo distributions, we also infer a C.L. upper limit on the natural width () of the state to be MeV.
VI.3 Production Properties
We now give a measure of the production rates of and mesons. A full understanding would require the determination of the fragmentation functions of both particles and their branching ratios into the final states we observe. To minimize systematic errors, we report the relative yields with respect to production, where all putative charmed-antistrange systems have momenta greater than 3.5 GeV/c. We use all observed events for each channel, which includes direct production and any contributions from decays of higher mass objects. Then
| (3) | |||||
| (4) |
We also note that
| (5) |
here and above, the first error includes the statistical and systematic errors on the event yields while the second includes the systematic errors for photon detection (), and for detection ().
VI.4 Decays of to other final states
With regard to the alternate decay channels described earlier, in which no signals were observed, we summarize the limits on the branching fractions relative to the mode in Table 1. The normalization for these limits is based on the determination that of the observed yield of entries in the peak of the spectrum in Fig. 1(b) are attributable to decay after accounting for the feed down from decays of the state to . We have estimated the systematic error on this yield to be entries by varying selection criteria and the parameterization of signal and background shapes used in the fit to Fig. 1.
| Final State | Yield | Efficiency | Ratio ( C.L.) | Prediction |
|---|---|---|---|---|
| — | ||||
| 0 | ||||
| 0.08 | ||||
| 0 | ||||
| 0 |
The event yields for the various final states are obtained by fitting the mass difference distributions to Gaussians with each mean fixed to the result from the channel and each width given by the resolution determined from the simulation of the corresponding decay mode. Uncertainties are dominated by the statistical error on the fitted yields and limits on the relative rates are calculated assuming a Gaussian distribution with negative values not allowed.
VI.5 Decays of to other final states
Unlike the case of a state, the decay mode, as well as both radiative decay modes and are allowed for a state with . From fits to the mass difference distributions displayed in Figs. 2 and 3 for peaks in the regions where a contribution from the would appear, we find no evidence of decays to any of these final states. We summarize the limits obtained on these decays, relative to , in Table 2.
| Final State | Yield | Efficiency | Ratio ( C.L.) | Prediction |
|---|---|---|---|---|
| — | ||||
| 0.24 | ||||
| 0.22 | ||||
| 0.20 | ||||
| 0.13 |
Despite a high relative efficiency, the limit on the decay is less stringent than those on the decays to and . This is due to an excess of combinations in the signal region. From fits performed with and without the signal Gaussian, we determine that the statistical significance of this excess is 2.4 standard deviations.
If the is a state, then it is also possible for it to undergo a P-wave radiative decay to noteonxfeed . We have looked for this transition in our sample. To reduce backgrounds from , we required that the system be consistent with the decay of the , namely that MeV/c2 ( based on Monte Carlo simulations). We also required that the system be inconsistent with decay at the level (the corresponding must deviate from the expected value for this decay by more than MeV/c2), and that the momentum of the be inconsistent with the transistion, also at the level. The distribution, plotted in Fig. 5, provides no evidence for a signal in the vicinity of 150 MeV/c2.

Due to the tightness of these cuts, the efficiency for detecting this decay is roughly a factor of three smaller than for the decay mode. The C.L. upper limit for this channel is reported in the bottom row of Table 2.
VII Conclusions and Discussion
In summary, data from the CLEO II detector have provided confirming evidence for the existence of a new narrow resonance decaying to , with a mass near 2.32 GeV/c2. This state is consistent with being the member of the lowest-lying -wave multiplet. As summarized in Table 1, we have set upper limits on other decay modes of this state. We have measured the mass splitting of this state with respect to the meson to be MeV/c2, and we find its natural width to be MeV at C.L.
We have observed and established the existence of a new narrow state with a mass near 2.46 GeV/c2 in its decay to , which we have denoted . We have demonstrated that the signal for this decay cannot be interpreted as a reflection from the decay. The measured properties of this state are consistent with its interpretation as the partner of the state in the spin multiplet with light quark angular momentum of . We have measured the mass splitting of this state with respect to the meson to be MeV/c2. The natural width of this state is found to be MeV at C.L. Since the mass lies above the kinematic threshold for decay to (but not for ), the narrow width suggests this decay does not occur. Since angular momentum and parity conservation laws forbid a state from decaying to two pseudoscalars, this provides additional evidence for the compatibility of the with the hypothesis.
In the model of Bardeen, Eichten and Hill bardeeneichtenhill , a state is predicted with the same mass splitting with respect to the state as that between the and states. Taking the difference between the two mean mass differences reported above, we obtain MeV/c2 for the difference between the and mass splittings, where the dominant uncertainty is due to statistics. Thus our observations are consistent with these predictions.
We gratefully acknowledge the effort of the CESR staff in providing us with excellent luminosity and running conditions. We thank W. Bardeen, E. Eichten, S. Godfrey, C. Hill and J. Rosner for useful discussions. M. Selen thanks the Research Corporation, and A.H. Mahmood thanks the Texas Advanced Research Program. This work was supported by the National Science Foundation, and the U.S. Department of Energy.
References
- (1) BaBar Collaboration, B. Aubert et al., Phys. Rev. Lett. 90, 242001 (2003).
- (2) J. Bartelt and S. Shukla, Ann. Rev. Nucl. Part. Sci. 45, 133 (1995).
- (3) A. DeRujula, H. Georgi and S. L. Glashow, Phys. Rev. Lett. 37, 785 (1976).
- (4) S. Godfrey and N. Isgur, Phys. Rev. D 32, 189 (1985).
- (5) N. Isgur and M. B. Wise, Phys. Rev. Lett. 66, 1130 (1991).
- (6) S. Godfrey and R. Kokoski, Phys. Rev. D 43, 1679 (1991).
- (7) M. Di Pierro and E. Eichten, Phys. Rev. D 64, 114004 (2001).
- (8) Particle Data Group, K. Hagiwara et al., Phys. Rev. D 66, 010001 (2002).
- (9) CLEO Collaboration, Y. Kubota et al., Phys. Rev. Lett. 72, 1972 (1994).
- (10) M. A. Nowak, M. Rho and I. Zahed, Phys. Rev. D 48, 4370 (1993).
- (11) W. A. Bardeen and C. T. Hill, Phys. Rev. D 49, 409 (1994).
- (12) R. N. Cahn and J. D. Jackson, hep-ph/0305012.
- (13) T. Barnes, F. E. Close and H. J. Lipkin, hep-ph/0305025.
- (14) E. van Beveren and G. Rupp, hep-ph/0305035.
- (15) W. A. Bardeen, E. J. Eichten, and C. T. Hill, hep-ph/0305049.
- (16) A. P. Szczepaniak, hep-ph/0305060.
- (17) S. Godfrey, hep-ph/0305122.
- (18) P. Colangelo and F. De Fazio, hep-ph/0305140.
- (19) G. S. Bali, hep-ph/0305209.
- (20) S. Okubo, Phys. Lett. 5, 165 (1963); J. Iizuka, Prog. Theor. Phys. Suppl. 37-38, 21 (1966); J. Iizuka et al., Prog. Theor. Phys. 35, 1061 (1966); G. Zweig, CERN Report No. TH-401 and TH-412, 1964 (unpublished).
- (21) The results presented here supersede those reported in: CLEO Collaboration, D. Besson et al., CLEO CONF 03-01, hep-ex/0305017, submitted to the 8th Conference on the Intersections of Particle and Nuclear Physics, New York, May 2003.
- (22) CLEO Collaboration, Y. Kubota et al., Nucl. Instrum. Meth. A 320, 66 (1992).
- (23) T. S. Hill, Nucl. Instrum. Meth. A 418, 32 (1998).
- (24) R. Brun et al., Geant 3.15, CERN Report No. DD/EE/84-1 (1987).
- (25) CLEO Collaboration, J. Gronberg et al., Phys. Rev. Lett. 75, 3232 (1995).
- (26) P. Cho and M. B. Wise, Phys. Rev. D 49, 6228 (1994).
- (27) The calculation of cross feed backgrounds in Section V.1 did not account for the possibility of decays. However, the impact of ignoring this channel is insignificant based on our upper limit.