A ROOT-based Client-Server Event Display for the ZEUS Experiment
Abstract
A new event visualization tool for the ZEUS experiment is nearing completion, which will provide the functionality required by the new detector components implemented during the recently achieved HERA luminosity upgrade. The new design is centered around a client-server concept, which allows to obtain random access to the ZEUS central event store as well as to events taken online via the HTTP protocol, even from remote locations. The client is a lightweight C++ application, and the ROOT system is used as underlying toolkit. Particular attention has been given to a smooth integration of 3-dimensional and layered 2-dimensional visualizations. The functionality of server and client application with its graphical user interface are presented.
I Introduction
Event displays are indispensable tools for analysis in high energy physics experiments. They help to understand the physics of a recorded interaction, to diagnose the apparatus, to make the detector geometry imaginable and to illustrate the whole matter to general audiences. For these rather heterogeneous requirements, the application must be versatile and offer both 2-dimensional (2D) and 3-dimensional (3D) representations. On the other hand, in today’s large collaborations’ distributed environments, it should be possible to obtain event displays regardless of the question whether the workstation is on site or somewhere else in the world. This is in general a challenge, since displaying events requires access to the experiment’s event store and geometry constants.
In the ZEUS experiment, new requirements have emerged with the installation of new detector components, in particular the silicon micro-vertex detector (MVD) and the forward straw tube tracker (STT), which require more elaborate 3-dimensional visualizations than the previous tool provided.
In the following, we describe the ZeVis program suite (ZeVis standing for ZEUS Visualization), which is a distributed application designed to meet the above challenges.
II Design Criteria
The design of the new event display is governed by two key criteria which are detailed in the following.
II.1 Client Server Capability
The system should consist of a highly portable light-weight client, capable of running on many different platforms with the host residing on-site or somewhere in the internet, and a server application which lives on a stationary host in direct contact with the event store. The term “light-weight” implies that the client should be independent of the huge legacy libraries making up the main reconstruction and analysis code. The server application, on the other hand, should incorporate standard analysis tools. The connection protocol between client and server should be standardized and likely not to be stopped by firewalls.
II.2 Integration of 2D/3D Views
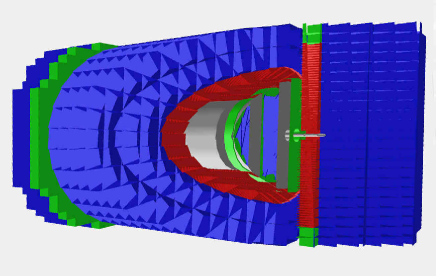
Perspective 3-dimensional views with hidden lines and hidden surface removal are very useful for understanding detector geometry, and provide attractive pictures for public relation purposes (fig. 1). Analyzing the event itself is often less successful in this mode, since the geometry tends to obscure the tracks and hits.
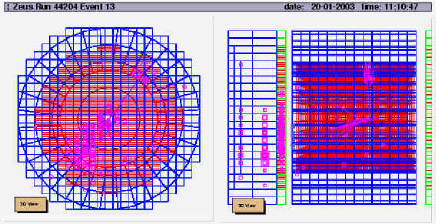
Standard projections in the straight-forward sense, e.g. along the beam line or transverse to it, present detector and event in such a way that coordinates could be measured, and every item is in principle visible (fig. 2). However, straight-forward projections can be very complex to look at in a multi-component detector, and do not go all too well with the cylindrical geometry of many colliding-beam experiments.
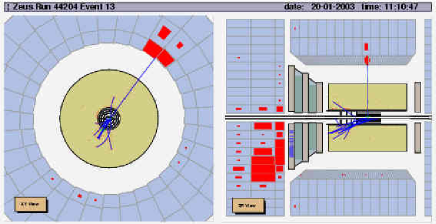
Very favourable for physics analysis are layered projections, which make use of filled areas to show geometry and event but arrange them in suitable layers such that all relevant information is visible (fig. 3). An excellent review on how to design useful projections for cylindrical detector designs has been given in drevermann . The ideal system should integrate all three viewing variants.
III Architecture And Design
The ROOT system root was chosen as underlying graphics, GUI and persistency package, since it provides drawing capabilities both for 2-dimensional graphics primitives as well as 3-dimensional graphics in wireframe mode and with hidden lines and surface removal. The ZeVis package is structured such that the client application depends only on one common library, which contains the geometry and event classes. Other libraries contain the classes to build the geometry and event in ROOT format from the ZEUS internal data model, and the server application which will be discussed later.
The data structures are designed using the builtin ROOT containers, in particular the TClonesArray. The geometry, which normally needs to be loaded only once per session, is designed such that it can be drawn quickly without further modification, hence the data structures are all directly derived from ROOT geometry classes which are able to draw themselves. The present size of the geometry file is about 450 kB.
For the event, compact size is important since a typical event display session will involve access to many events. The data content is therefore strongly reflecting the event information in the official ZEUS mini-DST format, with about 30 kB/evt.
In layered projections, each geometry object acquires a 2-dimensional shape which can be different in each projection, e.g. the drift chamber outline is a circle in view while it becomes two rectangles in the view.111The coordinate is defined by the proton beam direction, and are transverse to it. , signed according to azimuthal region. The parallel implementation of 3-dimensional and 2-dimensional representations is achieved by overloading the Paint() member function in the derived geometry classes.
A fish-eye view introduces a nonlinear transformation of radius and coordinate in the layered and projections, with the aim to enable simultaneous inspection of inner (e.g. micro-vertex detector) and outer tracking components (muon system) within the same picture. It is implemented by overloading the TView::WCtoNDC member function of ROOT.
IV The Server
The central server provides the access to the geometry and event data for the client program which may be running somewhere in the internet. It provides the following functionalities:
-
•
detector geometry service
-
•
single event service
-
•
download of event files
-
•
access to online events
-
•
access to events of the week scan results (see explanation below)
IV.1 Internal Structure
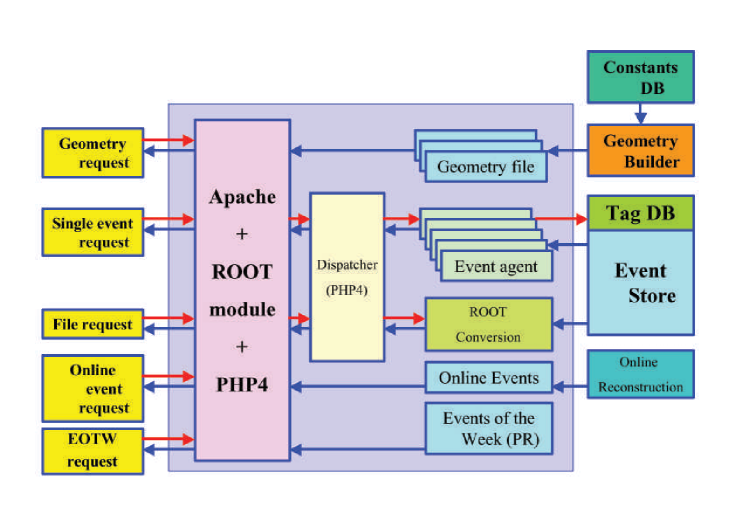
The internal structure of the ZeVis server is shown in fig. 4. The server is based on a normal Apache application apache which has been extended by a ROOT module and PHP4. On the client side, requests to the server are handled by the TWebFile class embedded in ROOT which has been slightly extended to allow for passing of parameters and version qualifiers. The server operates its own cache, where a copy of each created event file is kept for some time. A repeated request from a client will be satisfied with the cached result of an identical earlier request if it still exists. Different components of the server provide the functionality described above.
IV.2 Geometry Service
The detector geometry is normally requested by the client automatically on startup. The geometry resides statically on the server, and is subject to version control. Each client binary has the schema version it is based upon compiled in, and requests the geometry explicitly in the required version. The server keeps the geometry in several currently supported schema versions, which have been generated offline.
IV.3 Single Event Service
Particular care has been invested to provide a prompt return of single events. The client requests a single event specified by run number and event number, and a server application named dispatcher passes it to a pre-initialized event agent, which uses the tag database zes1 ; zes2 to obtain the whereabouts of the event, retrieves it from the event store and converts it into ROOT format on-the-fly. The dispatcher then returns the event to the client. The event agent is based on a normal ZEUS analysis application and has access to all standard analysis code. It also uses the normal I/O layers of all ZEUS applications, which initiate automatically staging of a tape file if it should become necessary through the dCache dcache . Since the initialization phase would introduce a sizeable latency, event agents are always pre-initialized and work in daemon fashion. As an individual process could be kept busy for some time if e.g. a file needs to be staged, several event agents are operated in parallel. Similar as with the geometry, the server supports several schema versions for event information. Typically, ten event agents are working in parallel for each supported schema. Besides run number and event number, the client can specify cuts on physical quantities of the event, which the server evaluates as a query on the tag database. Thus, the client is able to select e.g. only DIS events in a certain kinematical range, or only diffractive events with candidates in the muon channel, etc.
IV.4 Other Services
In the download service, the client specifies the name of an event file in the event store in one of several formats, which the server converts into ROOT format on the fly. Also raw data files can be requested, which the server passes through an on-demand reconstruction.
During data taking, the ZEUS online system splits random events off the stream with a typical frequency of 0.1 Hz. These events are passed through an automatic reconstruction on a dedicated machine, converted to ROOT and placed within the web area of the server. In online mode, the client retrieves the latest online event periodically (this has become a standard data quality control measure in the ZEUS control room).
In regular running mode, teams of specialists scan preselected ZEUS events visually and produce a selection named events of the week. The client application can retrieve this selection file directly from the server, which is also a useful mode for public relation purposes.
IV.5 Hardware and Performance
The present event display server hardware is a dual processor PC with Intel Xeon 2.2 GHz CPU and a fast IDE RAID controller with 240 GB of disk space, connected by a gigabit ethernet interface.
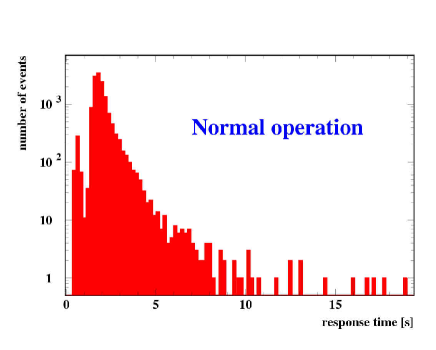
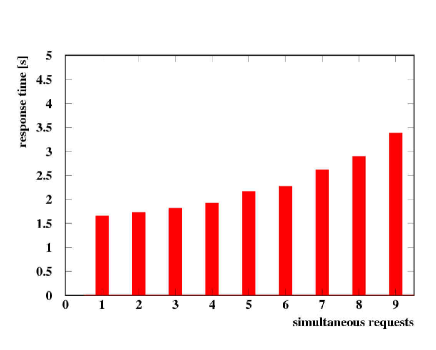
The performance of the server under varying load conditions has been investigated systematically. Figure 5 shows the histogrammed response time of non-identical events requested in random order, with the server cache deactivated. The response time is measured on the server and includes access to the tag database and event store, event analysis and conversion to ROOT format, but not the network transfer to the client (which is almost negligible for 30 kB event size on a normal local area network which can easily transfer several MB/s). The average response time is less than 2s, and will be even shorter when the event happens to be in the cache. There are no significant tails in the distribution. Figure 6 shows the behaviour under an artificial stress test. While the response time increases with increasing concurrency of demands, it is still below 4s with nine simultaneous requests. With up to four requests in parallel, hardly any degradation of performance is noticeable. This stress test is however of rather artificial nature, since during normal operation, concurrency of requests has hardly been observed at all.
V The Graphical User Interface (GUI)
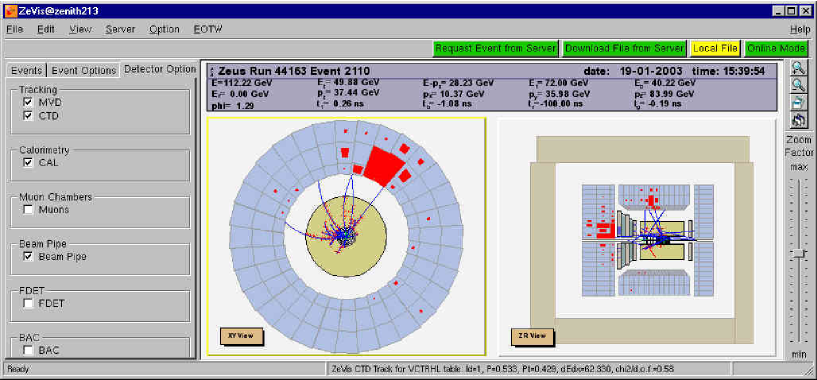
The general layout of the GUI is shown in fig. 7. The largest item is the event display canvas which consists of two pads containing two selectable views of the event, and the header. Above the canvas, four radio buttons allow selection of the event retrieval mode, where the choice can be made between single event request, file download, local and online modes. On the left side of the display canvas, three register cards contain toggles for the display of individual detector components and the corresponding event information, and permit steering of the event retrieval, which will be discussed in more detail below. The bottom edge of the frame shows the general status on the left, and a description of the object currently below the mouse pointer (in this case a track reconstructed in the drift chamber). The right side of the display canvas features buttons for zoom functions, and a slider to adjust the zoom factor. A set of pull-down menus gives access to less frequently used options. The mouse buttons can be used to pick displayed objects and inspect their properties, in extension of a builtin ROOT feature. The context menu also allows changing between the view modes.
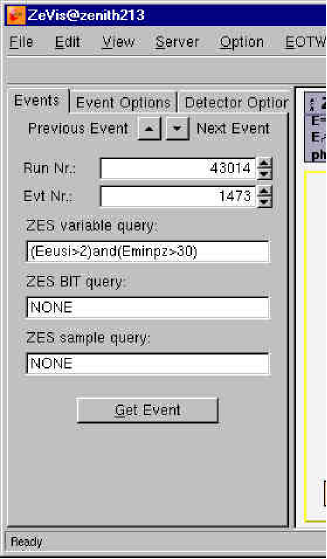
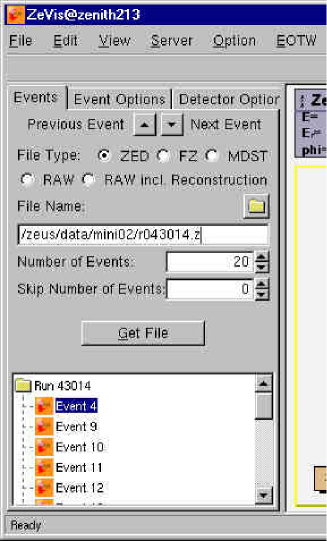
The steering panel for single event requests is shown in fig. 8. The minimal specification consists of run and event number. Optionally, a query on event tag variables can be entered in three fields, whereupon the server returns the first event satisfying the query with an event number equal or greater than the one specified. At the top, arrow-marked buttons allow navigation to the next or previous event. In presence of a query, the server will provide the next or previous event within the scope of the query.
A different panel (fig. 9) is used for requesting complete files from the server in various formats. The file name can be chosen with a file browser panel if the event store inventory is visible from the host on which the client is running. Figure 9 also shows the graphical event directory tree, which allows to move directly to any event in the downloaded file.
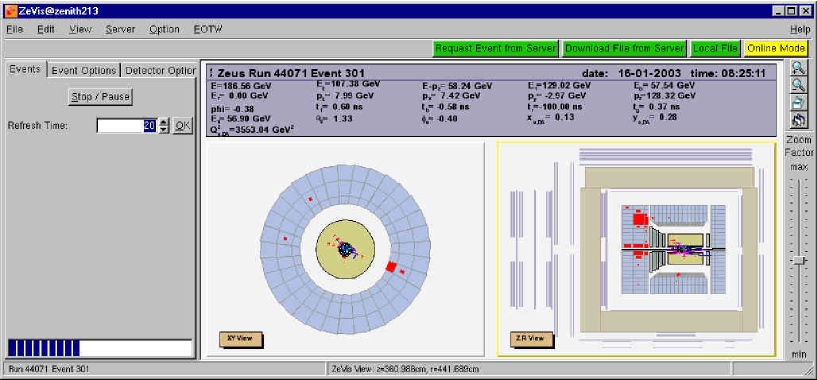
The GUI for the online mode is shown is fig. 10. In this mode, the client periodically requests the latest online event from the server (here every 20 seconds).
VI Visualization of Events
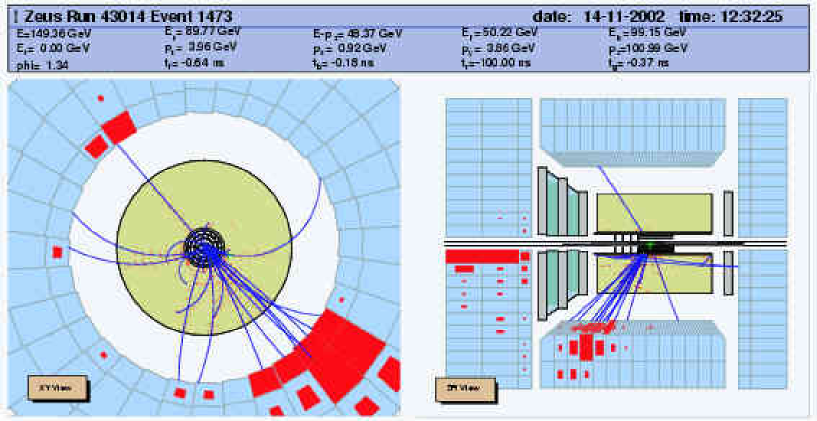
A very typical event display for daily work is shown in fig. 11. It shows layered projections in (left) and (right). The calorimeter energies are represented by the size of the shapes within the cell images, and are summed over all corresponding cells in in case of the view, and azimuth in case of the view.
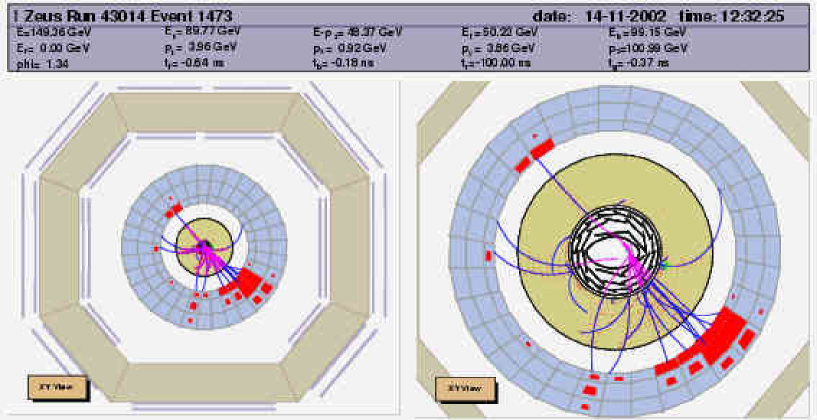
The fish-eye view allows simultaneous inspection of the inner MVD tracking layers together with the outer components (fig. 12). The fish-eye transformation blows up the inner part of the detector, it is available in both and projections.
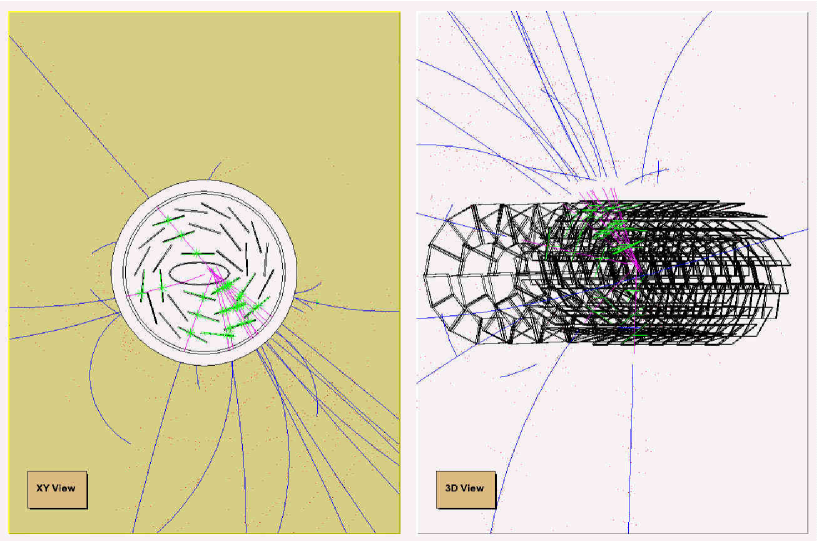
The micro-vertex detector benefits particularly from the capability to display 2-dimensional and 3-dimensional views together. Figure 13 shows the MVD simultaneously in projection and at an arbitrary spatial viewing angle.
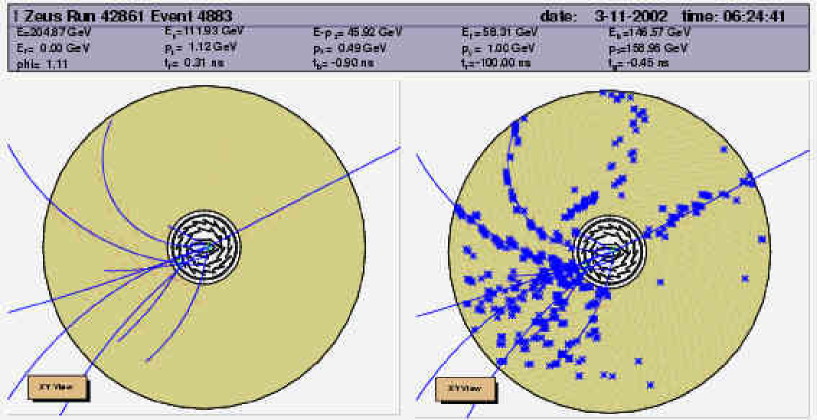
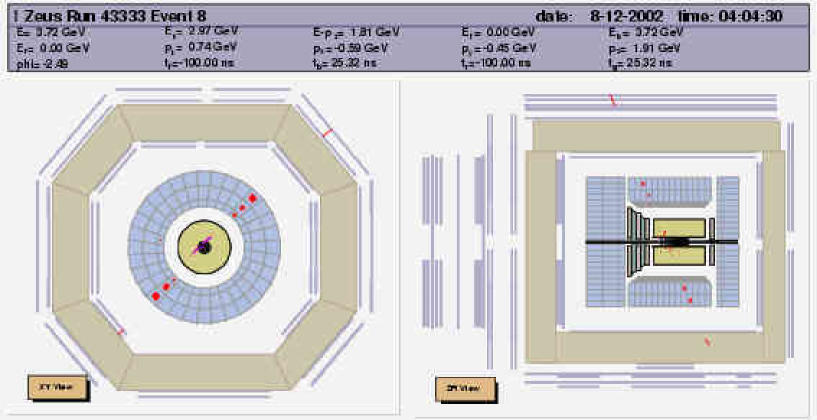
Special modes enable display of the raw hit information, as illustrated in fig. 14 in case of the central drift chamber. A display of a cosmic muon event with track segments in the muon chambers is shown in fig. 15.
Three-dimensional views with hidden lines and surface removal are possible through the special viewers X3D and OpenGL which are integrated in view. Figure 1 has been obtained using OpenGL. With these modes, live rotations are possible, and a suitable hardware acceleration, as available in the graphics adapters of most contemporary PCs, provides instantaneous response.
VII Summary
We have developed and deployed a client-server event display for the ZEUS experiment, which is based on the ROOT framework. Its main features are a portable, lightweight client, smooth integration of 2-dimensional and 3-dimensional views and an ergonomic graphical user interface. The performance of the server is excellent and leaves plenty of reserves for future increase in usage.
Acknowledgements.
It is a pleasure to thank the ZEUS detector and physics groups for their help and many useful suggestions about the most efficent implementation of detector geometry and event data, and the ROOT team for help and advice in connection with ROOT, as well as for providing the system in the first place. We would also like to thank our summer students Aleksandra Adametz, Valentin Sipica and Ildar Tamendarov for their contributions to the program.References
- (1) H. Drevermann, B.S. Nilsson and D. Kuhn, Is there a Future for Event Display?, Proceedings of Cern Computing School, L’Aquila 1992, 102-134.
- (2) http://root.cern.ch
- (3) http://www.apache.org
- (4) L. Bauerdick et al., Event Indexing Systems For Efficient Selection and Analysis of HERA Data, Comput.Phys.Commun.137:236-246,2001.
- (5) U. Fricke, Upgrade of the ZEUS OO Tag Database for Physics Analysis at HERA, Proceedings of the CHEP01 Conference, Beijing 2001, 252-255.
- (6) http://www.dcache.org