Measurement of the ratio with the KLOE detector
Abstract
We have measured the ratio using the KLOE detector. From a sample of -mesons produced at DANE, the Frascati factory, we select -mesons tagged by observing following the reaction . From this sample we select 27,375 events and obtain . Using the world average value for , we obtain where the second error is due to the uncertainty on the branching fraction.
PACS:
keywords:
, , , , , , , , , , , , , , , , , , , , , , , , , , , , , , , , , , , , , , , , , , , , , , , , , , , , , , , , , , 111Corresponding author: G. Lanfranchi, e-mail Gaia.Lanfranchi@lnf.infn.it, , , , , , , , , , , , , , , , , , , , , , , , , , , , , , , , , , , , , , , , , , , , , , , ,
1 Introduction and experimental setup
The decays and provide interesting tests [1] of chiral perturbation theory, ChPT. The dominant contribution to the decay is and can therefore be computed with reasonable accuracy in ChPT. The term vanishes for in the SU(3) limit. However large contributions mediated by pseudoscalar mesons [2] are expected for with values depending on the amount of singlet-octet mixing [3]. A precise measurement of the decay rate is also of interest in connection with the decay. In fact the absorptive part of the decay rate, , is proportional to . This constrains the dispersive part, and eventually the possibility of determining the Vtd parameter of the CKM matrix [1]. Measurements of and have been recently published by the NA48 Collaboration [4]. We describe a new measurement of obtained with -mesons from decays at DANE, the Frascati factory.
In DANE the electron and positron beams have energy where = 12.5 mrad is half of the beam crossing angle. -mesons are produced with a cross section of 3 b and a momentum of 12.5 MeV/c toward the center of the rings.
The center of mass energy, , the position of the beam crossing point () and the momentum are determined by measuring Bhabha scattering events. In a typical run of integrated luminosity dt 100 nb-1, lasting about 30 minutes, we have keV, keV/c, m, and m.
The detector consists of a large cylindrical drift chamber, DC [6], surrounded by a lead-scintillating fiber sampling calorimeter, EMC [7], both immersed in a solenoidal magnetic field of 0.52 T with the axis parallel to the beams. The DC tracking volume extends from 28.5 to 190.5 cm in radius and is 340 cm in length. For charged particles the transverse momentum resolution is and vertices are reconstructed with a spatial resolution of 3 mm. The calorimeter is divided into a barrel and two endcaps and covers 98 of the solid angle. Photon energies and arrival times are measured with resolutions and respectively. The photon entry points are determined with an accuracy along the fibers, and cm in the transverse directions. A photon is defined as a calorimeter cluster not associated to a charged particle, by requiring that the distance along the fibers between the cluster centroid and the impact point of the nearest extrapolated track be greater than 3. Two small calorimeters, QCAL [8], made with lead and scintillating tiles are wrapped around the low-beta quadrupoles to complete the hermeticity.
The trigger [9] uses information from both the calorimeter and the drift chamber. The EMC trigger requires two local energy deposits above threshold ( MeV in the barrel, MeV in the endcaps). Recognition and rejection of cosmic-ray events is also performed at the trigger level, checking for the presence of two energy deposits above 30 MeV in the outermost calorimeter plane. The DC trigger is based on the multiplicity and topology of the hits in the drift cells. The trigger has a large time spread with respect to the beam crossing time. It is however synchronized with the machine radio frequency divided by four, = 10.85 ns, with an accuracy of 50 ps. During the period of data taking the bunch crossing period at DANE was = 5.43 ns. The of the bunch crossing producing an event is determined offline during the event reconstruction.
2 Data analysis
The -meson decays into of the time. The production of a is tagged by the observation of a decay. and decay vertices are reconstructed along the direction opposite to the in the rest frame and required to be inside a given fiducial volume, . We call the ratio of interest. The numerators and denominators are found from:
where and are the numbers of observed events and estimated background, , , and are respectively the trigger efficiency, the tagging efficiency, the acceptance in the fiducial volume and the selection efficiency for the two decays. The efficiencies and are equal at the few per mil level and cancel in the ratio . Background and selection efficiencies must be separately determined.
For this analysis the drift chamber is used to measure the decay and to determine the direction of the , the calorimeter is used to measure the photon energies and impact points and to reconstruct the decay vertex by time of flight.
The data sample was collected during 2001 and 2002 for an integrated luminosity of 362 pb-1 corresponding to the production of . Details of the analysis can be found in reference [10]. events have a very clear signature, being the only source of 250 MeV photon pairs that balance the momentum of the observed . This allows the use of very loose selection criteria. On the other hand , the dominant neutral decay, is characterised by a large multiplicity of lower energy photons. The final error on is dominated by the error on the number of events.
Before full event reconstruction, the data are passed through a filter to reject machine background and cosmic ray events. As discussed later, this filter has a modest impact on the events of interest for this analysis.
decays are selected with the following requirements:
-
-
two tracks with opposite charge that form a vertex with cylindrical coordinates cm, cm, and no other tracks connected to the vertex;
-
-
momentum 100 MeV/c 120 MeV in the rest system, and invariant mass 490 MeV 505 MeV.
The decay provides an unbiased tag for the when it decays into neutral particles and a good measurement of the momentum, , where is the central value of the momentum determined with Bhabha scattering events. The angular resolution on the direction is determined from events by measuring the angle between and the line joining the vertex and the reconstructed vertex. The widths of the angular distributions are , .
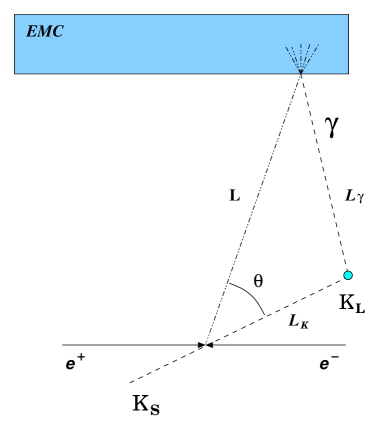
The position of the vertex for and decays is measured using the photon arrival times on the EMC. Each photon defines a time of flight triangle shown in Fig. 1. The three sides are the decay length, ; the distance from the decay vertex to the calorimeter cluster centroid, ; and the distance from the cluster to the vertex, . The equations to determine the unknowns and are:
where is the photon arrival time on the EMC, is the velocity and is the angle between and . Only one of the two solutions is kinematically correct. The value of is obtained from the energy weighted average, where i is the photon index.
The accuracy of this method is checked by comparing in the decays the position of the decay vertex measured both by timing with the calorimeter and, with a much better precision, by tracking with the drift chamber.
The resolution function, , is determined with and events by the distribution of the residuals where is the average obtained with all the photons but the . We measure for the sample (cm) and for the sample (cm).
The FV is defined in cylindrical coordinates as 30 cm 170 cm, 140 cm. The fraction of -mesons decaying in the FV is .
The identification of the bunch crossing that originated the event is crucial to locate the vertex in space. An error by one bunch crossing period results in a displacement of the vertex of about 33 cm and decreases the probability of correctly associating the photon clusters. The bunch crossing is determined by identifying one of the two pions of the decay and by measuring its track length, momentum and time of flight. Thus an error of one (or more) crossing periods can occur if there is an incorrect track-to-cluster association or the track parameters are poorly measured.
To minimise the number of events with an incorrect bunch-crossing assignment, we perform a consistency check of the time of flight of the pions along their trajectory measured with the DC, with the corresponding cluster time measured by the calorimeter, . Requiring ns for at least one pion, the probability of correctly identifying the bunch crossing is . This additional cut retains of the original event sample. The probability of identifying the correct bunch crossing was measured with a sample of decays where the position of the vertex, , is reconstructed by tracking in the DC and the position of the two-photon vertex, , by timing with the EMC. The difference is used to isolate the events in which the bunch crossing is incorrectly determined.
3 selection
The decay has a large branching fraction, 21%, and thus has very small background. Given the large statistics we retain only 1 out of 10 decays. The selection of events requires at least three calorimeter clusters with the following properties
-
-
energy larger than 20 MeV;
-
-
distance from any other cluster larger than 40 cm;
-
-
no association to a charged track;
-
-
in the fiducial volume and .
The main sources of inefficiencies are: 1) geometrical acceptance; 2) cluster energy threshold; 3) merging of clusters; 4) accidental association to a charged track; 5) Dalitz decay of one or more ’s. The effect of these inefficiencies is to modify the relative population for events with 3, 4, 5, 6, 7 and , clusters without significant loss of efficiency. Monte Carlo simulation shows that the selection efficiency is .
A comparison between data and Monte Carlo of the relative populations and of the distribution of the total energy, , shows that only events with 3 and 4 clusters are contaminated by background. This is due to decays where one or two charged pions produce a cluster not associated to a track and neither track is associated to the vertex or to decays, possibly in coincidence with machine background particles ( or ) that shower in the QCAL and generate soft neutral particles.
To reduce this background, for the 3-cluster population we further require at least two clusters in the barrel with at least one of them with energy MeV and for the 4-cluster population at least one cluster in the barrel with energy MeV. The probability to have a cluster with MeV has been evaluated using the 6-cluster events. The probability of having a given number of clusters in the barrel depends only on geometry and has been evaluated by Monte Carlo simulation. We obtain and . Additionally, an event with 3 clusters is accepted only if an additional cluster is found in QCAL within a time window of 10 ns with respect to the decay time. The probability of such an occurrence is .
The background is rejected by imposing a veto (track veto) on the events with charged tracks not associated to the decay and with the first hit in the drift chamber at a distance of less than 30 cm from the position of the vertex. The track veto also rejects about of the events with Dalitz decays.


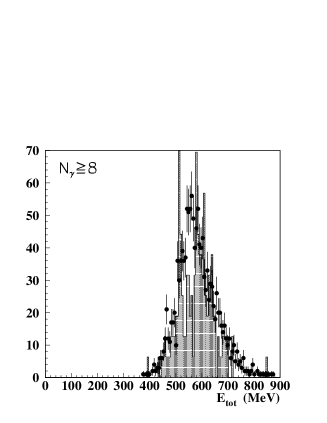
Fig. 2 shows the distribution of the total energy for
events with different numbers of clusters together with the results of the
Monte Carlo simulation. The relative fraction of events is shown in
Table 1. The difference between data and Monte Carlo simulation
for events with 5 clusters is due to split clusters.
The contamination from accidental clusters originated by machine
background is negligible. The residual background contamination in
events with 3 and 4 clusters is evaluated by Monte Carlo simulation and
amounts to and respectively.
| Number of clusters | Data | Monte Carlo |
|---|---|---|
| 3 | ||
| 4 | ||
| 5 | ||
| 6 | ||
| 7 | ||
A subsample of events has been processed and analysed without passing through the initial filter. The fractional loss due to the filter is found to be less than . The trigger efficiency for events was measured in two different ways. A detailed description of the methods is given in reference [9]. The first method uses only the data and the information provided by the combined EMC + DC trigger. In the second method the Monte Carlo is used to evaluate the correlation between the EMC and the DC trigger showing that the correlation factor is very small. The results obtained with the two methods, , , are in good agreement. Since the two methods are independent, and the results consistent, we combined the two results.
The number of events is:
where and are corrected for the background subtraction and the additional cuts quoted before. , a small addition of of the total count, is obtained using the Monte Carlo result that of the Dalitz decays are included in events while of them are rejected by the track veto. We find .
4 selection
events are preselected by requiring at least two calorimeter clusters with energy MeV not associated to tracks. For the two most energetic clusters we require:
-
-
total energy, MeV;
-
-
angle between the photon momenta projected onto the plane normal to the direction, ;
-
-
time difference smaller than 15 ns;
-
-
decay vertex in the fiducial volume and .
The geometrical acceptance and the selection efficiency are evaluated by Monte Carlo simulation. The values of the efficiency are shown in table 2.
| preselection | efficiency |
|---|---|
| MeV) | (92.6 0.1stat) % |
| 350 MeV | (99.88 0.02stat) % |
| (98.4 0.1stat 0.4syst) % | |
| (98.5 0.1stat 0.2syst ) % | |
| 15 ns | (99.89 0.02stat) % |
| total | (89.5 0.2stat 0.4syst) % |
With these cuts we obtain 1.7 105 events with a large background due to and decays, being negligible [11].
The signal is further selected using the two body decay kinematics. In fact, photon energies can be computed with better accuracy from cluster and decay vertex coordinates. The laboratory energy is obtained by boosting from the center of mass where to the laboratory. If are unit vectors from the decay vertex to the cluster centroids, the photon energies are
where and are computed from . The has energy , and momentum . Fig. 3 shows the distribution of and of the angle between and , together with the results of the Monte Carlo simulation. The data are fitted with a linear combination of the Monte Carlo distributions for signal and background. The fit gives the relative normalisation for the two populations.


In order to reduce background we further require:
-
-
where MeV and = 1.8 MeV are evaluated from a fit to the distribution;
-
-
.
To extract the signal we fit the invariant mass distribution obtained using calorimeter cluster energies with a linear combination of the Monte Carlo distributions for signal and background. The result of the fit gives the number of events for the two populations. Fig. 4 shows the distribution of before and after the and cuts. From a fit to the second distribution we find events.


The efficiency of the selection cuts are evaluated from the data using a sample of events with high purity (S/B ) selected by applying hard, uncorrelated cuts on other kinematic variables [10].
The systematic error associated with the selection cuts on () is evaluated by moving the cuts around the chosen values and fitting the invariant mass distribution. The maximum displacement of the measured value for the number of signal counts is and for the and the distribution respectively. The systematic error due to the background contamination has been evaluated by changing the shape of the background distribution used as input of the fit. The effect on the signal is 10 times smaller and produces a systematic error of .
The filter and the trigger efficiencies are evaluated as for the
analysis of decay. The results
are , where the statistical and systematic errors are
combined in quadrature.
The efficiencies associated with the
various analysis steps are summarised in Table 3.
| selection | efficiency |
|---|---|
| trigger | (99.44 0.04) % |
| filter | (99.93 0.01) % |
| preselection | (89.5 0.2stat 0.4syst) % |
| (98.5 0.2stat 0.2syst) % | |
| (92.5 0.3stat 0.3syst) % | |
| total | (81.0 0.3stat 0.5syst) % |
The number of events is . For the ratio we find:
in good agreement with the recent result from the NA48 Collaboration [4].
Using the known value for the branching fraction, we obtain where the first error represents the statistical and systematic error on R combined in quadrature and the second is due to the uncertainty in the branching fraction. A decay width of eV is in agreement with predictions of ChPT provided the value of the pseudoscalar mixing angle is close to our recent measurement of [12].
References
- [1] G. D’Ambrosio, G. Ecker, G. Isidori and H. Neufeld, ”Radiative non-leptonic kaon decays”, in The Second DANE Physics Handbook, eds. L. Maiani, G. Pancheri and N. Paver, Vol.I, p.265, 1995.
- [2] E. Ma and B. R. Holstein, Phys. Rev. D 24 (1984) 2346; J. F. Donoghue, B. R. Holstein and Y-C. R. Lin, Nucl. Phys. B277 (1986) 651.
- [3] G. D’Ambrosio and D. Espriu, Phys. Lett. B175 (1986) 237.
- [4] A. Lai et al., Phys. Lett. B551 (2003) 7.
- [5] K. Hagiwara et al., Phys. Rev. D66 (2002) 010001-1.
- [6] The KLOE Collaboration, M. Adinolfi et al., Nucl. Instr. and Meth. A488 (2002) 51.
- [7] The KLOE Collaboration, M. Adinolfi et al., Nucl. Instr. and Meth. A482 (2002) 363.
- [8] The KLOE Collaboration, M. Adinolfi et al., Nucl. Instr. and Meth. A483 (2002) 649.
- [9] The KLOE Collaboration, M. Adinolfi et al., Nucl. Instr. and Meth. A492 (2002) 134.
- [10] S. Di Falco, G. Lanfranchi and E. Santovetti, Measurement of the ratio , KLOE note n 182, January 2003.
- [11] G. D. Barr et al., Phys. Lett. B358 (1995) 399.
- [12] The KLOE Collaboration, A. Aloisio et al., Phys. Lett. B541 (2002) 45.