RARE HADRONIC DECAYS AND DIRECT CPV
FROM BELLE AND BABAR
Recent measurements of branching fractions and -violating partial-rate asymmetries for rare hadronic -meson decays by the asymmetric-energy -factory experiments, Belle and BABAR, are reviewed.
1 Introduction
Recent measurements of the mixing-induced -violating asymmetry parameter (or ) strongly supports the Kobayashi-Maskawa (KM) mechanism. However, a full test of the KM mechanism requires additional measurements for the other angles () and () of the unitarity triangle. Charmless hadronic decays of mesons contain enough information to measure these angles, but the extraction of unitarity angles from these decay modes has some difficulty caused by hadronic uncertainties. However, measurements of enough final states can provide sufficient constraints to the sizes of hadronic amplitudes and strong phases, which are necessary for the extraction of angles.
In the KM scheme, the direct violation (DCPV) is also expected and has already been observed in the meson system. However, this phenomenon has not been observed yet in the meson system. The search for DCPV is an important issue at -factory experiments. Charmless hadronic decays can provide rich sample for the DCPV search, because many of these decays are described by tree and penguin diagrams. The interference between the two diagrams can cause the partial-rate asymmetry as
| (1) |
where denotes the partial width of or decaying into a flavor-specific final state and denotes that of charge conjugate mode, and represent the tree and penguin amplitudes, respectively, and and are the differences in weak and strong phases between two amplitudes. DCPV is also sensitive to the new physics beyond the Standard Model (SM) through the contribution of new particles to the penguin loop.
In this paper, mainly analyses for , , and decays, which are referred to as , are described and the results for other rare hadronic decays are summarized.
2 Analysis
The analyses of Belle are based on data sample collected at the resonance, which corresponds to pairs, by the Belle detector at the KEKB storage ring. The analyses of BABAR are based on data sample corresponding to pairs collected with the BABAR detector at the PEP-II asymmetric-energy collider. The detail of the reconstruction of mesons and the event selection is described elsewhere.
Reconstructed candidates are identified using two kinematic variables: the beam-energy constrained mass (or the beam-energy substituted mass) and the energy difference , where is the beam energy, and are the momentum and energy of the reconstructed meson in the center-of-mass system (cms).
The dominant background comes from (, , , ) continuum process. These backgrounds are suppressed by the event topology. Belle uses the likelihood ratio calculated from two variables: the modified Fox-Wolfram moments that are combined using a Fisher discriminant into a single variable and the angle of the flight direction with respect to the beam axis. BABAR uses the angle between the sphericity axis of the candidate and the sphericity axis of the remaining particles in that event and the Fisher discriminant calculated from the momenta of remaining particles and the angles between their momenta and the thrust axis of candidate in the cms.
For the final states that include a charged pion or kaon, high momentum particle identification (PID) is important. PID of Belle is based on the light yield in the aerogel Cherenkov counter (ACC) and measurements in the central drift chamber (CDC). PID of BABAR is accomplished with the Cherenkov angle measurement from a detector of internally reflected Cherenkov light (DIRC).
3 Result
3.1 Branching Fraction
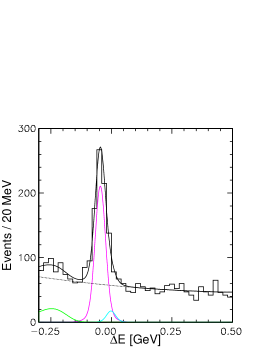
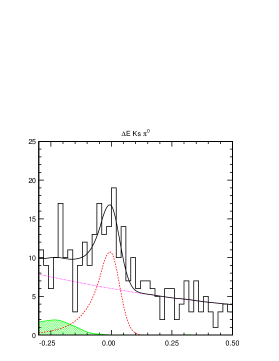
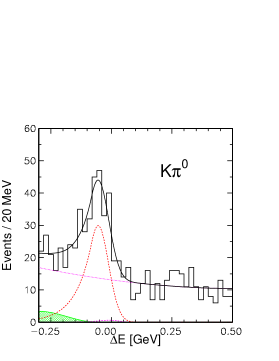
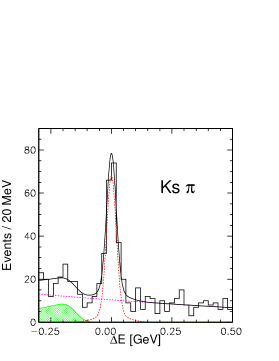
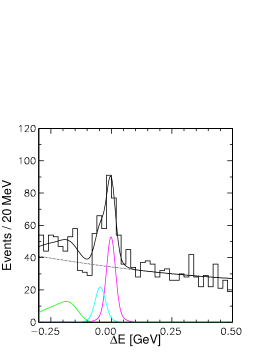
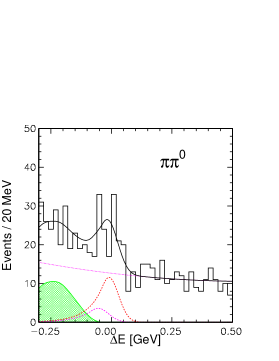
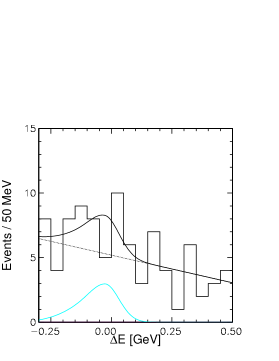
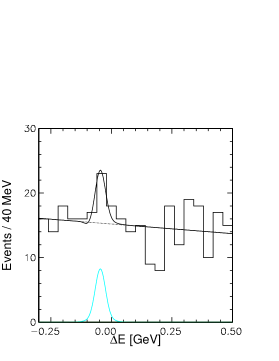
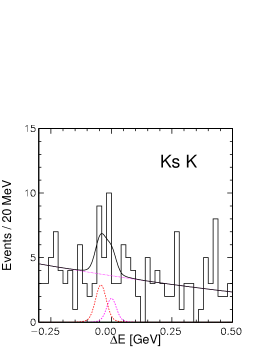
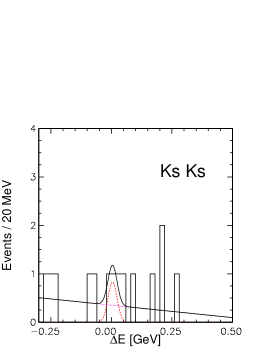
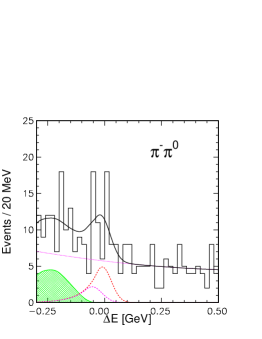
Figure 1 shows the distributions obtained by the Belle experiment for modes in the signal region.
(a) (b) (c)
(d) (e) (f)
(g)
(h)
(i)
(j)
The signal yields are extracted by a binned maximum likelihood fit to the distribution. The fits include four components: signal, crossfeed from other misidentified signals, continuum background, and backgrounds from multibody and radiative charmless decays. The results of the fits are also shown in Fig. 1.
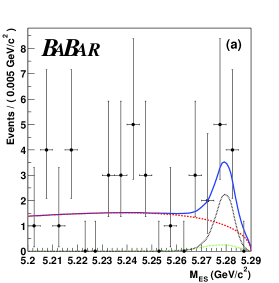
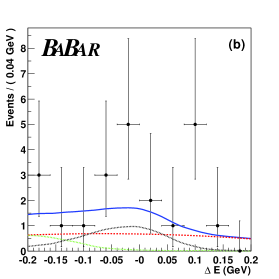
Figure 2 shows the distributions of and obtained by the BABAR experiment after the selection to enhance the signal purity.


(a) (b) (c)


(d) (e) (f)
BABAR uses an unbinned extended maximum likelihood fit to extract the signal yields. The input variables to the fit are , , Fisher discriminant of the event shape parameter, Cherenkov angles for the charged tracks. The projections of the fit results are also shown in Fig. 2.
Using the signal yields obtained from the fit and the reconstruction efficiencies, the branching fractions are derived and listed in Table 1.
| Mode | [] (BABAR) | [] (Belle) |
|---|---|---|
| — |
The branching fractions for other hadronic rare decay modes are reported by Belle and BABAR as listed in Table 2.
| Mode | [] (BABAR) | [] (Belle) |
| — | ||
| — | ||
| — | ||
| — | ||
| — | ||
| — | ||
For modes with significance below three standard deviations, 90% confidence level (C.L.) upper limits are reported.
The ratios of partial widths for decays are calculated using the measurements of branching fractions from Belle and listed in Table 3.
| Modes | Ratio |
|---|---|
For the calculation of the ratio between and decays, and are applied, where () is the lifetime of () and () is the branching fraction of (). These ratios of branching fractions can be used to give constraints on the weak phases. For example, the QCD factorization gives model-dependent constraint on (). Figure 3 shows the dependence of these ratios on () obtained from the BBNS QCD factorization approach.
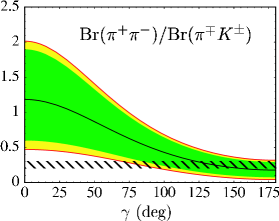
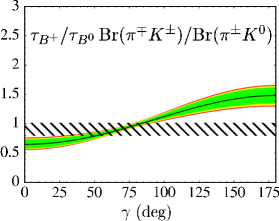
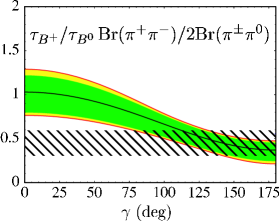
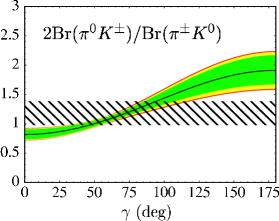
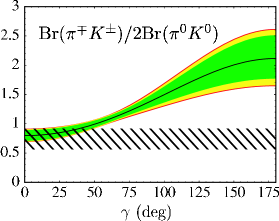
The results of ratios of branching fractions from Belle are also displayed in Fig. 3.
The branching fractions for , , and can be used for the constraint on the size of the penguin “pollution” in the () measurement using time-dependent asymmetry in decay. The upper bound on , where is the measured parameter from the asymmetry in the time-evolution of decay, is calculated using the results from Belle: and obtained with the constraint to the physically allowed region. The obtained allowed region for and is shown in Fig. 4,
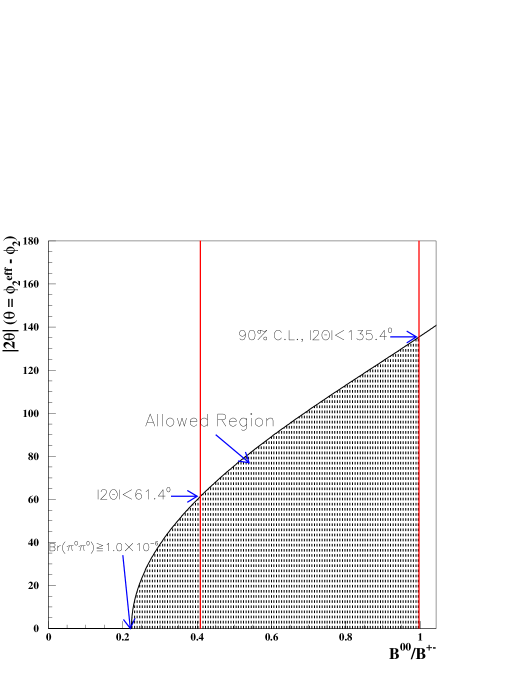
and the typical values of the upper limit on are
| (for ) | (2) | ||||
| (3) |
The lower bound on can be estimated to be from Fig. 4.
3.2 Direct Violation
Belle measures the partial-rate asymmetry by fitting the distributions and extracting signal yields separately for () and (). Figure 5 shows the distributions separately for () and () modes for decays from Belle.
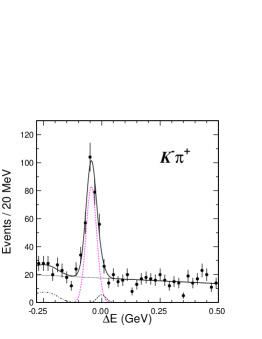
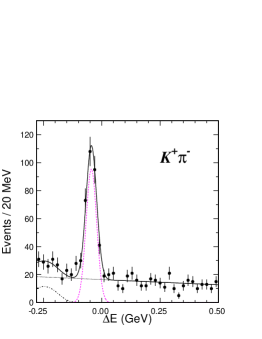
(a)
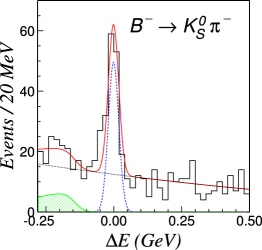
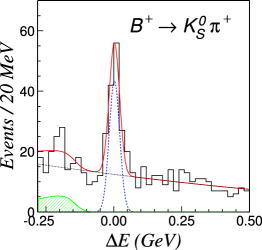
(b)
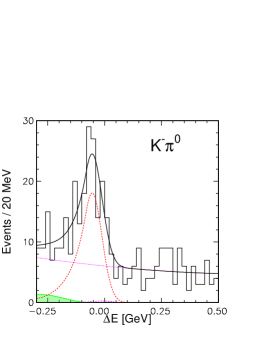
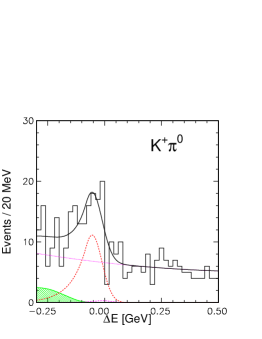
(c)

(d)
The fitting results and partial-rate asymmetries from Belle are listed in Table 4.
| Mode | ( C.I.) | |||
|---|---|---|---|---|
| () | ||||
| () | ||||
| () | ||||
| () |
BABAR uses an unbinned maximum likelihood fit to determine the partial-rate asymmetry . The input parameters are the same as those used in the measurement of branching fractions. Table 5 lists for modes from BABAR.
| Mode | |
|---|---|
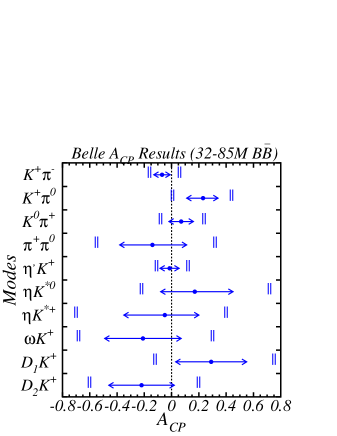
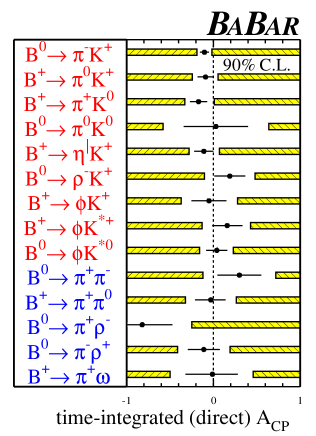
Figure 6 shows the summary plots of for rare hadronic decays from Belle and BABAR including the modes other than .
4 Summary
The -factory experiments provide the most precise measurements of branching fractions and partial-rate asymmetries for rare hadronic decays. The measured partial-rate asymmetries are consistent with zero with the current statistics. The statistical precisions for these measurements have reached below 10% level in several decay modes.
References
References
-
[1]
Belle Collaboration, K. Abe et al.,
Phys. Rev. D 66, 071102(R) (2002);
BABAR Collaboration, B. Aubert et al., Phys. Rev. Lett. 89, 201802 (2002). - [2] M. Kobayashi and T. Maskawa, Prog. Theor. Phys. 49, 652 (1973).
- [3] H. R. Quinn and A. I. Sanda, Eur. Phys. J. C 15, 626 (2000).
-
[4]
NA48 Collaboration, J. R. Batley et al.,
Phys. Lett. B 544, 97 (2002);
KTeV Collaboration, A. Alavi-Harati et al., Phys. Rev. Lett. 83, 22 (1999). - [5] Belle Collaboration, K. Abe et al., Nucl. Instrum. Methods A 479, 117 (2002).
- [6] E. Kikutani ed., Nucl. Instrum. Methods A 499, 1 (2003).
- [7] BABAR Collaboration, B. Aubert et al., Nucl. Instrum. Methods A 479, 1 (2002).
- [8] PEP-II Conceptual Design Report, SLAC-R-418 (1993).
- [9] Belle Collaboration, B. C. K. Casey et al., Phys. Rev. D 66, 092002 (2002).
- [10] BABAR Collaboration, B. Aubert et al., Phys. Rev. Lett. 89, 281802 (2002).
- [11] G. C. Fox and S. Wolfram, Phys. Rev. Lett. 41, 1581 (1978).
- [12] BABAR Collaboration, B. Aubert et al., hep-ex/0206053 (2002); hep-ex/0207063 (2002); hep-ex/0207065 (2002).
- [13] Averages prepared by the Heavy Flavor Averaging Group for rare decays for Winter 2003 Conferences, http://www.slac.stanford.edu/xorg/hfag/rare/.
- [14] Particle Data Group, K. Hagiwara et al., Phys. Rev. D 66, 010001 (2002).
- [15] M. Gronau and J. L. Rosner, Phys. Rev. D 65, 013004 (2002).
- [16] M. Beneke, G. Buchalla, M. Neubert, and C. T. Sachrajda, Nucl. Phys. B 606, 245 (2001).
- [17] M. Gronau, D. London, N. Sinha, and R. Sinha, Phys. Lett. B 514, 315 (2001).
- [18] Belle Collaboration, K. Abe et al., hep-ex/0301032 (2003) [submitted to Phys. Rev. D].