2002
Abstract
An update of measurements of the strong coupling constant is given, representing the status of September 2002. The results convincingly prove the energy dependence of and are in excellent agreement with the expectations of Quantum Chromodynamics, QCD. Evolving all results to the rest energy of the boson, the new world average of is determined from measurements which are based on QCD calculations in complete NNLO perturbation theory, giving
Talk presented at the QCD 02 High-Energy Physics International Conference in Quantum Chromodynamics, Montpellier (France) July 2-9, 2002.
MPI-PhE/2002-17
November 2002
1 INTRODUCTION
The coupling constant of the Strong Interactions, , is one of the most fundamental parameters of nature which must be determined by experiment. Many new results, experimental studies as well as improved theoretical calculations, continue to be provided each year, such that regular updates of summaries of measurements of are mandatory.
In this contribution, an update of the most recent results on determinations of which were published since summer 2000 is given. It is organised as an incremental addition to a more complete and concise review published in Ref. [1]. For a detailed introduction into the field and for an overview and definition of basic concepts, equations and references, the reader is therefore referred to [1]. Based on those results and on the current update, a new world average of , the value of the running (i.e. energy dependent) coupling constant at the rest energy of the boson, GeV, will be given.
2 NEW RESULTS
New or updated measurements of are available from almost all major classes of high energy particle reactions. In the following subsections, the respective results will be shortly reviewed. In the summary of all relevant measurements of given in Table 1, these updates and new results are underlined for better visibility.
2.1 Deep Inelastic Scattering (DIS)
A new global analysis of all available precision data for deep inelastic and related hard scattering processes includes recent measurements of structure functions at HERA and of the inclusive jet cross sections at the Tevatron [2]. Apart from an improved determination of the gluon distribution function, is quantified, in next-to-leading order (NLO) of perturbative QCD, to be
where the theoretical error is estimated from alternative theoretical treatments, like NNLO fits or those including resummation techniques.
Other studies [3, 4] based on subsets of data used in [2] provide results which are less precise but are compatible with the one above.
Several new QCD studies [5, 6, 7]
based on data of the structure function
from neutrino-nucleon scattering [8] were published,
which are all based on complete next-next-to-leading order (NNLO) QCD
calculations.
They result in:
The result from [6] is based on Jacobian polynomials and moments of . It includes renormalisation scale uncertainties in the assigned theoretical error. The value of obtained in [5] is based on a method using Berstein polynomials; it is systematically smaller and only compatible with [6] within the assigned total errors. The most recent result [7] agrees with [6], however has no theoretical error assigned yet. Until further clarification, the result of [6] is taken as the final value of from .
A previous study based on Bernstein polynomials and moments of the structure function from deep inelastic electron- and muon-scattering data was recently updated [5], giving in NNLO QCD. The systematic error includes higher twist effects and an estimate of the NNNLO corrections, however does not include studies of renormalisation scale nor scheme uncertainties which cannot be estimated at the current state of the theoretical calculations [9]. In order to account for the incomplete assessment of the theoretical uncertainty, the quoted value of will be doubled such that
will be taken as the final result.
2.2 Annihilation
New results from studies of event shape distributions and jet production
in annihilations where reported from a reanalysis of JADE data, at
c.m. energies of 14 and of 22 GeV [12], in resummed NLO QCD,
giving
The four LEP experiments have reportet new results on from event
shapes and jet rates [13, 14, 15, 16], in resummed NLO QCD,
in the c.m. energy range from 192 to 208 GeV.
Most of these results are still preliminary; here they are summarised as
A dedicated QCD working group at LEP (LEPQCDWG) currently prepares combined values of which are summarised over all four LEP experiments taking full account of correlations between observables, energies and experiments, using identical analysis methods and definitions of theoretical uncertainties, see e.g. [17]. Once the outcome of those studies will become official, they will superseed the respective numbers given in this and the previous [1] report.
The latest update of the combined LEP measurement of the ratio of the hadronic and the leptonic partial decay widths of the boson, results in
from which - assuming strict validity of the electroweak standard model predictions for a top-quark mass of and a Higgs boson mass of - is being determined to be, in complete NNLO QCD,
whereby the systematic uncertainty is determined as described in section 4.3 and Table 2 of [1].
A novel determination of from 4-jet observables [18] in (i.e. NLO) QCD results in , where the systematic error includes variation of the renormalisation scale factor between 0.5 and 2.0, differences between two major hadronisation models, experimental systematic uncertainties and quark mass dependences. At the claimed precision, the amount of systematic studies, however, seems rather optimistic; e.g. the hadronisation uncertainty may be accidentally small for the two (optimised) models being investigated. The influence of model parameter variations should also have been included, and higher order QCD uncertainties should be studied more intensively then by small variations of the renormalisation scale. Until more experience with this type of analysis is available, the claimed systematic uncertainty is doubled such that the final result included in this summary is
Finally, a new determination of from measurements of the photon structure function in two photon reactions at LEP [19] became available, where was determined to be, in NLO QCD,
2.3 Hadron Collisions
An updated study of inclusive jet production at the Tevatron [20], in the transverse energy range of and based on NLO QCD, resultet in
where the theoretical error includes renormalisation and parton density function uncertainties.
2.4 Heavy Quarkonia Mass Splittings
A new determination of from mass splittings and lattice QCD calculations with 3 dynamic quark flavours [21], which for the first time do not have to rely on extrapolations of calculations with 0 or 2 to 3 physical quark flavours, results in
3 SUMMARY AND THE NEW WORLD AVERAGE
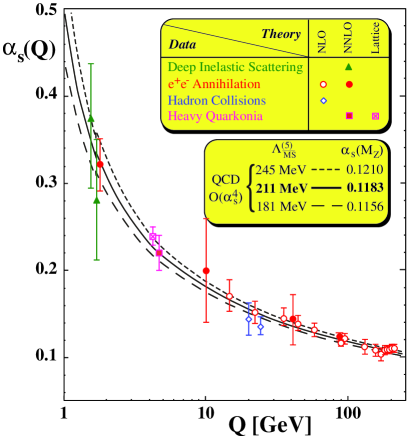
A summary of all measurements of , as discussed in [1] but with all updates and new measurements presented in the previous section, is given in Table 1. The values of are presented in Figure 1, as a function of the energy scale where the measurement was carried out111Results which were determined from data in of energy depend on the explicit assumption of the energy dependence of as predicted by QCD; they are not shown in Figure 1 but are included in Table 1 and in Figure 2.. As already seen in previous summaries of , the data provide significant evidence for the running of , in good agreement with the QCD prediction.
Therefore it is appropriate to extrapolate all results of to a common value of energy, which is usually the rest energy (or mass, using the convention ) of the boson, . As done and described in [1], the QCD evolution of with energy, using the full 4-loop expression [22] with 3-loop matching [23] at the pole masses of the charm- and the bottom-quark, and , is applied to all results of which were obtained at energy scales .
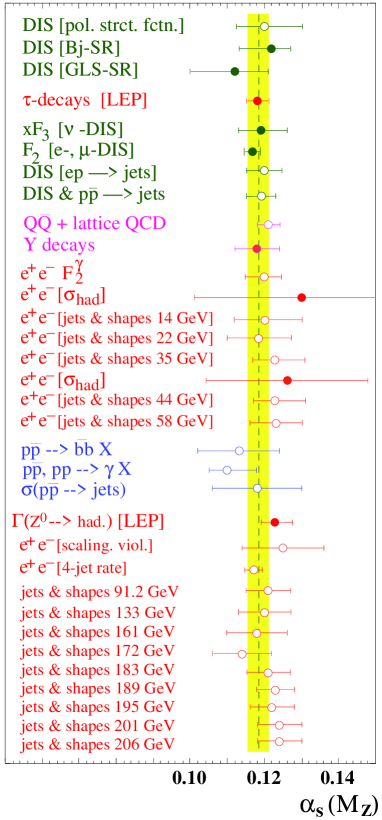
The corresponding values of are tabulated in the column of Table 1; column 5 and 6 indicate the contributions of the experimental and the theoretical unceratinties to the overall errors assigned to . All values of are graphically displayed in Figure 2. Within their individual uncertainties, there is perfect agreement between all results. This justifies to evaluate an overall world average value, . As discussed e.g. in [1], however, the combination of all these results to an overall average, and even more so for the overall uncertainty to be assigned to this average, is not trivial due to the supposedly large but unknown correlations between invidual results, especially through common prejudices and biases within the theoretical calculations.
For combining all or subsets of the results summarised in Table 1 into average values of , the same procedures as utilised in [1] are being used:
-
•
An error weighted average and an “optimized correlation” error is calculated from the error covariance matrix, assuming an overall correlation factor between the total errors of all measurements. This factor is adjusted so that the overall equals one per degree of freedom [24]. The resulting mean values, overall uncertainties and optimized correlation factors are given in columns 3 to 5 of Table 2, respectively.
-
•
For illustrative purposes only, an overall error is calculated assuming that all measurements are entirely uncorrelated and all quoted errors are gaussian. The results are displayed in column 6.
-
•
The simple, unweighted root mean squared of the mean values of all measurements is calculated and shown in column 7, labelled “simple rms”.
-
•
Assuming that each result of has a rectangular-shaped rather than a gaussian probability distribution, the resulting weights (the inverse of the square of the total error) are summed up in a histogram, and the resulting of that distribution is quoted as “rms box” [25].
Averages for all and for subsets of -results, together with the corresponding uncertainties are summarised in Table 2. As already discussed in [1], the overall uncertainties decrease if the averaging process is restricted to those which accomplished a minimum precision, i.e. a total error of , while the value of is almost unaffected by such a restriction - c.f. rows 1 and 2.
The second observation is that there is one single result, the one derived from moments of structure functions [5], which influences the average and its uncertainty most significantly. Therefore, in Table 2, averages for all and for subsets of data are also given excluding the result from (indicated by “”).
There is a sufficiently large number of redults which is based on complete NNLO QCD, such that can be reliably calculated from this subset (see rows 5 to 8 of Table 2). Due to the improved completenes of the perturbation series, these results are believed to be more reliable and better defined than all the others which are complete to (resummed) NLO. The new world average of is finally quoted from those NNLO results which have total errors less than 0.008, giving
| (1) |
c.f. row 6 of Table 2. The average value is practically indentical to the final result of the previous summary [1], , in spite of the many updates and new results presented above, while the overall assigned, correlated uncertainty decreased by about 10%.
The result of corresponds to the following values of the QCD scale for different numbers of quark flavours , evaluated using the full 4-loop expansion of and 3-loop matching at the quark thresholds (c.f. Equations 4 and 8 of [1]):
4 CONCLUDING REMARKS
There is a remarkable agreement of all single results with the new world average value; no result deviates by more than one standard deviation of its assigned uncertainty. This indicates that the uncertainties must be either overestimated or strongly correlated. Because most quoted errors are dominated by theoretical uncertainties which are based on estimates that are for sure non-gaussian, the latter of these two possibilities is probably true.
This taken for granted, the results should not be averaged using standard methods of gaussian error propagation and error reduction, as done in other reviews of measurements [26, 27]. Such a procedure systematically underestimates the resulting overall error on , even if it is generously rounded up as done in [26, 27]. The method of introducing an overall correlation between all results, such that the error matrix calculation provides a total per degree of freedom of unity [24], as it is used to determine the results above, should provide - in the absence of any concrete knowledge of these correlations - a more realistic estimate of the overall remaining uncertainty .
Some observations made in the process of summarising and averaging are worth mentioning:
Both and increase by about 1% of if the result from moments of [5] is not included in the average, c.f. rows 1 and 3, rows 5 and 7 or rows 6 and 8 of Table 2. This is the largest systematic change due to the omission of one single result which was observed in this study, which is, however, fully compatible within the quoted errors and uncertainties. Nevertheless, since the result from lacks studies of renormalisation scale and scheme uncertainties and their inclusion in the quoted overall error, and since it’s influence on the final average values is dominant - although the originally quoted theoretical uncertainty was doubled in this report - there is a grain of salt left when including this measurement in the overall summary. While the result included in the final value of , it is worth mentioning that omission of that result leads to sligthly higher values of , c.f. Table 2.
With very few exceptions, the most recent results summarised in this report (c.f. the underlined entries in Table 1) all tend towards values of , especially those from DIS processes and the one based on improved lattice gauge theory. In the past, those results typically arrived at values smaller than found e.g. in annihilation processes. Accordingly, there is no significant systematic difference between results form DIS and from annihilations any more, c.f. rows 12 to 13 of Table 2. The same is true for determined from results based on complete NNLO or from (resummed) NLO QCD calulcations only, c.f. rows 5 and 9 or 6 and 10 of Table 2. These observations are even more exact when the result from moments of is not included, c.f. rows 12 and 13 as well as rows 7 and 9.
Concluding, and leaving aside the small effects discussed in this section, the observed stability of and the significant energy dependence of , which is in perfect agreement with the QCD prediction of the running of , constitute a major success of uncovering nature’s intrinsic basic parameters and features!
| Q | ||||||
|---|---|---|---|---|---|---|
| Process | [GeV] | exp. | theor. | Theory | ||
| DIS [pol. strct. fctn.] | 0.7 - 8 | NLO | ||||
| DIS [Bj-SR] | 1.58 | – | – | NNLO | ||
| DIS [GLS-SR] | 1.73 | NNLO | ||||
| -decays | 1.78 | 0.0007 | 0.0030 | NNLO | ||
| DIS [; ] | 2.2 - 12.3 | NNLO | ||||
| DIS [e/; ] | 1.9 - 15.2 | NNLO | ||||
| DIS [e-p jets] | 6 - 100 | NLO | ||||
| DIS & jets | 1 - 400 | NLO | ||||
| states | 4.1 | 0.000 | 0.003 | LGT | ||
| decays | 4.75 | – | – | NNLO | ||
| [] | 1.4 - 28 | 0.0028 | NLO | |||
| [] | 10.52 | 0.002 | NNLO | |||
| [jets & shapes] | 14.0 | 0.002 | resum | |||
| [jets & shapes] | 22.0 | 0.003 | resum | |||
| [jets & shapes] | 35.0 | 0.002 | resum | |||
| [] | 42.4 | 0.002 | NNLO | |||
| [jets & shapes] | 44.0 | 0.003 | resum | |||
| [jets & shapes] | 58.0 | 0.003 | 0.007 | resum | ||
| 20.0 | NLO | |||||
| 24.3 | 0.004 | NLO | ||||
| 40 - 250 | NLO | |||||
| [] | 91.2 | NNLO | ||||
| scal. viol. | 14 - 91.2 | 0.009 | NLO | |||
| 4-jet rate | 91.2 | 0.0001 | 0.0026 | NLO | ||
| [jets & shapes] | 91.2 | resum | ||||
| [jets & shapes] | 133 | 0.003 | 0.006 | resum | ||
| [jets & shapes] | 161 | 0.005 | 0.006 | resum | ||
| [jets & shapes] | 172 | 0.005 | 0.006 | resum | ||
| [jets & shapes] | 183 | 0.002 | 0.005 | resum | ||
| [jets & shapes] | 189 | 0.001 | 0.005 | resum | ||
| [jets & shapes] | 195 | 0.001 | 0.006 | resum | ||
| [jets & shapes] | 201 | 0.002 | 0.006 | resum | ||
| [jets & shapes] | 206 | 0.001 | 0.006 | resum | ||
| opt. corr. | overall | uncorrel. | simple rms | rms box | |||
|---|---|---|---|---|---|---|---|
| row | sample (entries) | correl. | |||||
| 1 | all (33) | 0.1189 | 0.0037 | 0.65 | 0.0009 | 0.0042 | 0.0051 |
| 2 | ” (25) | 0.1189 | 0.0033 | 0.58 | 0.0009 | 0.0035 | 0.0044 |
| 3 | all - (32) | 0.1194 | 0.0042 | 0.67 | 0.0010 | 0.0042 | 0.0052 |
| 4 | ” (24) | 0.1194 | 0.0037 | 0.62 | 0.0010 | 0.0035 | 0.0045 |
| 5 | NNLO only (9) | 0.1183 | 0.0031 | 0.67 | 0.0015 | 0.0053 | 0.0049 |
| 6 | ” (6) | 0.1183 | 0.0027 | 0.60 | 0.0015 | 0.0022 | 0.0035 |
| 7 | NNLO - (8) | 0.1196 | 0.0042 | 0.75 | 0.0020 | 0.0055 | 0.0052 |
| 8 | ” (5) | 0.1197 | 0.0038 | 0.75 | 0.0020 | 0.0020 | 0.0037 |
| 9 | NLO only (24) | 0.1194 | 0.0042 | 0.64 | 0.0011 | 0.0038 | 0.0050 |
| 10 | ” (19) | 0.1193 | 0.0037 | 0.57 | 0.0012 | 0.0038 | 0.0047 |
| 11 | DIS only (7) | 0.1178 | 0.0034 | 0.81 | 0.0016 | 0.0031 | 0.0042 |
| 12 | DIS - (6) | 0.1192 | 0.0054 | 0.90 | 0.0024 | 0.0033 | 0.0049 |
| 13 | only (22) | 0.1195 | 0.0041 | 0.66 | 0.0012 | 0.0040 | 0.0050 |
References
- [1] S. Bethke, hep-ex/0004021; J. Phys. G26 (2000) R27.
- [2] A.D. Martin et al., hep-ph/0110215; Eur. Phys. J. C23 (2002) 73.
- [3] S. Forte et al., hep-ph/0205286; Nucl. Phys. B643 (2002) 477.
- [4] V.G. Krivokhijine, A.V. Kotikov, hep-ph/0208188.
- [5] J. Santiago, F.J. Yndurain, hep-ph/0102247; Nucl. Phys. B611 (2001) 447.
- [6] A.L. Kataev et al., hep-ph/0106221.
- [7] C.J. Maxwell, A. Mirjalili, hep-ph/0207069 v2.
- [8] W.G. Seligman et al., Phys. Rev. Lett. 79 (1997) 1213.
- [9] F.J. Yndurain, private communication.
- [10] H1 collaboration, C. Adloff et al., hep-ex/0010054 ; Eur. Phys.J .C19 (2001) 289.
- [11] ZEUS collaboration, S. Chekanov et al., hep-ex/0208037.
- [12] P.A. Movilla Fernandez, hep-ex/0205014.
- [13] ALEPH collaboration, ALEPH-2000-017, ALEPH-2001-007.
- [14] DELPHI collaboration, DELPHI-2000-116, DELPHI-2001-065.
- [15] L3 collaboration, P. Achard et al., hep-ex/0206052; Phys. Lett. B536 (2002) 217.
- [16] OPAL collaboration, OPAL PN420, OPAL PN496.
- [17] G. Dissertori, hep-ex/0209070.
- [18] A. Heister et al., CERN-EP-2002-029.
- [19] S. Albino et al., hep-ph/0205069; Phys. Rev. Lett. 89 (2002) 122004.
- [20] T. Affolder et al., CDF collaboration, hep-ex/0108034; Phys. Rev. Lett. 88 (2002) 042001.
- [21] C. Davies et al., hep-lat/0209122.
- [22] T. van Ritbergen et al., Phys. Lett. B400 (1997) 379.
- [23] K.G. Chetyrkin et al., Phys. Rev. Lett. 79 (1997) 2184.
- [24] M. Schmelling, Phys. Scripta 51 (1995) 676.
- [25] S. Bethke, Proc. QCD Euroconference 97, Montpellier, France, July (1997), Nucl. Phys. B (Proc.Suppl.) 64 (1998) 54; hep-ex/9710030.
- [26] K. Hagiwara et al., Review of Particle Physics, Phys. Rev. D66 (2002) 010001.
-
[27]
I. Hinchliffe, A.V. Manohar, Ann. Rev. Nucl. Part. Sci. 50 (2000) 643.
I. Hinchliffe, P. Richardson, Eur. Phys. J. C15 (2000) 85.