Measurements of inelastic and photoproduction at HERA
Abstract
The cross sections for inelastic photoproduction of and mesons have been measured in collisions with the ZEUS detector at HERA, using an integrated luminosity of 38.0 pb-1. The events were required to have 0.1 0.9 and 50 180 GeV, where is the fraction of the incident photon energy carried by the in the proton rest frame and is the photon-proton centre-of-mass energy. The to cross-section ratio was measured in the range . The data, for various ranges of transverse momentum, are compared to theoretical models incorporating colour-singlet and colour-octet matrix elements. Predictions of a next-to-leading-order colour-singlet model give a good description of the data, although there is a large normalisation uncertainty. The helicity distribution for 0.4 is compared to leading-order QCD predictions.
DESY–02–163
October 2002
post reading
The ZEUS Collaboration
S. Chekanov,
D. Krakauer,
S. Magill,
B. Musgrave,
J. Repond,
R. Yoshida
Argonne National Laboratory, Argonne, Illinois 60439-4815 n
M.C.K. Mattingly
Andrews University, Berrien Springs, Michigan 49104-0380
P. Antonioli,
G. Bari,
M. Basile,
L. Bellagamba,
D. Boscherini,
A. Bruni,
G. Bruni,
G. Cara Romeo,
L. Cifarelli,
F. Cindolo,
A. Contin,
M. Corradi,
S. De Pasquale,
P. Giusti,
G. Iacobucci,
A. Margotti,
R. Nania,
F. Palmonari,
A. Pesci,
G. Sartorelli,
A. Zichichi
University and INFN Bologna, Bologna, Italy e
G. Aghuzumtsyan,
D. Bartsch,
I. Brock,
S. Goers,
H. Hartmann,
E. Hilger,
P. Irrgang,
H.-P. Jakob,
A. Kappes1,
U.F. Katz1,
O. Kind,
E. Paul,
J. Rautenberg2,
R. Renner,
H. Schnurbusch,
A. Stifutkin,
J. Tandler,
K.C. Voss,
M. Wang,
A. Weber
Physikalisches Institut der Universität Bonn,
Bonn, Germany b
D.S. Bailey3,
N.H. Brook3,
J.E. Cole,
B. Foster,
G.P. Heath,
H.F. Heath,
S. Robins,
E. Rodrigues4,
J. Scott,
R.J. Tapper,
M. Wing
H.H. Wills Physics Laboratory, University of Bristol,
Bristol, United Kingdom m
M. Capua,
A. Mastroberardino,
M. Schioppa,
G. Susinno
Calabria University,
Physics Department and INFN, Cosenza, Italy e
J.Y. Kim,
Y.K. Kim,
J.H. Lee,
I.T. Lim,
M.Y. Pac5
Chonnam National University, Kwangju, Korea g
A. Caldwell6,
M. Helbich,
X. Liu,
B. Mellado,
Y. Ning,
S. Paganis,
Z. Ren,
W.B. Schmidke,
F. Sciulli
Nevis Laboratories, Columbia University, Irvington on Hudson,
New York 10027 o
J. Chwastowski,
A. Eskreys,
J. Figiel,
K. Olkiewicz,
P. Stopa,
L. Zawiejski
Institute of Nuclear Physics, Cracow, Poland i
L. Adamczyk,
T. Bołd,
I. Grabowska-Bołd,
D. Kisielewska,
A.M. Kowal,
M. Kowal,
T. Kowalski,
M. Przybycień,
L. Suszycki,
D. Szuba,
J. Szuba7
Faculty of Physics and Nuclear Techniques,
University of Mining and Metallurgy, Cracow, Poland p
A. Kotański8,
W. Słomiński9
Department of Physics, Jagellonian University, Cracow, Poland
L.A.T. Bauerdick10,
U. Behrens,
I. Bloch,
K. Borras,
V. Chiochia,
D. Dannheim,
M. Derrick11,
G. Drews,
J. Fourletova,
A. Fox-Murphy12, U. Fricke,
A. Geiser,
F. Goebel6,
P. Göttlicher13,
O. Gutsche,
T. Haas,
W. Hain,
G.F. Hartner,
S. Hillert,
U. Kötz,
H. Kowalski14,
G. Kramberger,
H. Labes,
D. Lelas,
B. Löhr,
R. Mankel,
I.-A. Melzer-Pellmann,
M. Moritz15,
D. Notz,
M.C. Petrucci16,
A. Polini,
A. Raval,
U. Schneekloth,
F. Selonke17,
H. Wessoleck,
R. Wichmann18,
G. Wolf,
C. Youngman,
W. Zeuner
Deutsches Elektronen-Synchrotron DESY, Hamburg, Germany
A. Lopez-Duran Viani19,
A. Meyer,
S. Schlenstedt
DESY Zeuthen, Zeuthen, Germany
G. Barbagli,
E. Gallo,
C. Genta,
P. G. Pelfer
University and INFN, Florence, Italy e
A. Bamberger,
A. Benen,
N. Coppola
Fakultät für Physik der Universität Freiburg i.Br.,
Freiburg i.Br., Germany b
M. Bell, P.J. Bussey,
A.T. Doyle,
C. Glasman,
S. Hanlon,
S.W. Lee,
A. Lupi,
G.J. McCance,
D.H. Saxon,
I.O. Skillicorn
Department of Physics and Astronomy, University of Glasgow,
Glasgow, United Kingdom m
I. Gialas
Department of Engineering in Management and Finance, Univ. of
Aegean, Greece
B. Bodmann,
T. Carli,
U. Holm,
K. Klimek,
N. Krumnack,
E. Lohrmann,
M. Milite,
H. Salehi,
S. Stonjek20,
K. Wick,
A. Ziegler,
Ar. Ziegler
Hamburg University, Institute of Exp. Physics, Hamburg,
Germany b
C. Collins-Tooth,
C. Foudas,
R. Gonçalo4,
K.R. Long,
F. Metlica,
A.D. Tapper
Imperial College London, High Energy Nuclear Physics Group,
London, United Kingdom m
P. Cloth,
D. Filges
Forschungszentrum Jülich, Institut für Kernphysik,
Jülich, Germany
M. Kuze,
K. Nagano,
K. Tokushuku21,
S. Yamada,
Y. Yamazaki
Institute of Particle and Nuclear Studies, KEK,
Tsukuba, Japan f
A.N. Barakbaev,
E.G. Boos,
N.S. Pokrovskiy,
B.O. Zhautykov
Institute of Physics and Technology of Ministry of Education and
Science of Kazakhstan, Almaty,
Kazakhstan
H. Lim,
D. Son
Kyungpook National University, Taegu, Korea g
F. Barreiro,
O. González,
L. Labarga,
J. del Peso,
I. Redondo22,
E. Tassi,
J. Terrón,
M. Vázquez
Departamento de Física Teórica, Universidad Autónoma
Madrid,Madrid, Spain l
M. Barbi, A. Bertolin,
F. Corriveau,
A. Ochs,
S. Padhi,
D.G. Stairs,
M. St-Laurent
Department of Physics, McGill University,
Montréal, Québec, Canada H3A 2T8 a
T. Tsurugai
Meiji Gakuin University, Faculty of General Education, Yokohama, Japan
A. Antonov,
P. Danilov,
B.A. Dolgoshein,
D. Gladkov,
V. Sosnovtsev,
S. Suchkov
Moscow Engineering Physics Institute, Moscow, Russia j
R.K. Dementiev,
P.F. Ermolov,
Yu.A. Golubkov,
I.I. Katkov,
L.A. Khein,
I.A. Korzhavina,
V.A. Kuzmin,
B.B. Levchenko,
O.Yu. Lukina,
A.S. Proskuryakov,
L.M. Shcheglova,
N.N. Vlasov,
S.A. Zotkin
Moscow State University, Institute of Nuclear Physics,
Moscow, Russia k
C. Bokel, J. Engelen,
S. Grijpink,
E. Koffeman,
P. Kooijman,
E. Maddox,
A. Pellegrino,
S. Schagen,
H. Tiecke,
N. Tuning,
J.J. Velthuis,
L. Wiggers,
E. de Wolf
NIKHEF and University of Amsterdam, Amsterdam, Netherlands h
N. Brümmer,
B. Bylsma,
L.S. Durkin,
T.Y. Ling
Physics Department, Ohio State University,
Columbus, Ohio 43210 n
S. Boogert,
A.M. Cooper-Sarkar,
R.C.E. Devenish,
J. Ferrando,
G. Grzelak,
T. Matsushita,
M. Rigby,
O. Ruske23,
M.R. Sutton,
R. Walczak
Department of Physics, University of Oxford,
Oxford United Kingdom m
R. Brugnera,
R. Carlin,
F. Dal Corso,
S. Dusini,
A. Garfagnini,
S. Limentani,
A. Longhin,
A. Parenti,
M. Posocco,
L. Stanco,
M. Turcato
Dipartimento di Fisica dell’ Università and INFN,
Padova, Italy e
E.A. Heaphy,
B.Y. Oh,
P.R.B. Saull24,
J.J. Whitmore25
Department of Physics, Pennsylvania State University,
University Park, Pennsylvania 16802 o
Y. Iga
Polytechnic University, Sagamihara, Japan f
G. D’Agostini,
G. Marini,
A. Nigro
Dipartimento di Fisica, Università ’La Sapienza’ and INFN,
Rome, Italy
C. Cormack26,
J.C. Hart,
N.A. McCubbin
Rutherford Appleton Laboratory, Chilton, Didcot, Oxon,
United Kingdom m
C. Heusch
University of California, Santa Cruz, California 95064 n
I.H. Park
Department of Physics, Ewha Womans University, Seoul, Korea
N. Pavel
Fachbereich Physik der Universität-Gesamthochschule
Siegen, Germany
H. Abramowicz,
A. Gabareen,
S. Kananov,
A. Kreisel,
A. Levy
Raymond and Beverly Sackler Faculty of Exact Sciences,
School of Physics, Tel-Aviv University,
Tel-Aviv, Israel d
T. Abe,
T. Fusayasu,
S. Kagawa,
T. Kohno,
T. Tawara,
T. Yamashita
Department of Physics, University of Tokyo,
Tokyo, Japan f
R. Hamatsu,
T. Hirose17,
M. Inuzuka,
S. Kitamura27,
K. Matsuzawa,
T. Nishimura
Tokyo Metropolitan University, Deptartment of Physics,
Tokyo, Japan f
M. Arneodo28,
M.I. Ferrero,
V. Monaco,
M. Ruspa,
R. Sacchi,
A. Solano
Università di Torino, Dipartimento di Fisica Sperimentale
and INFN, Torino, Italy e
R. Galea,
T. Koop,
G.M. Levman,
J.F. Martin,
A. Mirea,
A. Sabetfakhri
Department of Physics, University of Toronto, Toronto, Ontario,
Canada M5S 1A7 a
J.M. Butterworth, C. Gwenlan,
R. Hall-Wilton,
T.W. Jones,
M.S. Lightwood,
J.H. Loizides29,
B.J. West
Physics and Astronomy Department, University College London,
London, United Kingdom m
J. Ciborowski30,
R. Ciesielski31,
R.J. Nowak,
J.M. Pawlak,
B. Smalska32,
J. Sztuk33,
T. Tymieniecka34,
A. Ukleja34,
J. Ukleja,
A.F. Żarnecki
Warsaw University, Institute of Experimental Physics,
Warsaw, Poland q
M. Adamus,
P. Plucinski
Institute for Nuclear Studies, Warsaw, Poland q
Y. Eisenberg,
L.K. Gladilin35,
D. Hochman,
U. Karshon
Department of Particle Physics, Weizmann Institute, Rehovot,
Israel c
D. Kçira,
S. Lammers,
L. Li,
D.D. Reeder,
A.A. Savin,
W.H. Smith
Department of Physics, University of Wisconsin, Madison,
Wisconsin 53706 n
A. Deshpande,
S. Dhawan,
V.W. Hughes,
P.B. Straub
Department of Physics, Yale University, New Haven, Connecticut
06520-8121 n
S. Bhadra,
C.D. Catterall,
S. Fourletov,
S. Menary,
M. Soares,
J. Standage
Department of Physics, York University, Ontario, Canada M3J
1P3 a
1 on leave of absence at University of
Erlangen-Nürnberg, Germany
2 supported by the GIF, contract I-523-13.7/97
3 PPARC Advanced fellow
4 supported by the Portuguese Foundation for Science and
Technology (FCT)
5 now at Dongshin University, Naju, Korea
6 now at Max-Planck-Institut für Physik,
München/Germany
7 partly supported by the Israel Science Foundation and
the Israel Ministry of Science
8 supported by the Polish State Committee for Scientific
Research, grant no. 2 P03B 09322
9 member of Dept. of Computer Science
10 now at Fermilab, Batavia/IL, USA
11 on leave from Argonne National Laboratory, USA
12 now at R.E. Austin Ltd., Colchester, UK
13 now at DESY group FEB
14 on leave of absence at Columbia Univ., Nevis Labs.,
N.Y./USA
15 now at CERN
16 now at INFN Perugia, Perugia, Italy
17 retired
18 now at Mobilcom AG, Rendsburg-Büdelsdorf, Germany
19 now at Deutsche Börse Systems AG, Frankfurt/Main,
Germany
20 now at Univ. of Oxford, Oxford/UK
21 also at University of Tokyo
22 now at LPNHE Ecole Polytechnique, Paris, France
23 now at IBM Global Services, Frankfurt/Main, Germany
24 now at National Research Council, Ottawa/Canada
25 on leave of absence at The National Science Foundation,
Arlington, VA/USA
26 now at Univ. of London, Queen Mary College, London, UK
27 present address: Tokyo Metropolitan University of
Health Sciences, Tokyo 116-8551, Japan
28 also at Università del Piemonte Orientale, Novara, Italy
29 supported by Argonne National Laboratory, USA
30 also at Łódź University, Poland
31 supported by the Polish State Committee for
Scientific Research, grant no. 2 P03B 07222
32 now at The Boston Consulting Group, Warsaw, Poland
33 Łódź University, Poland
34 supported by German Federal Ministry for Education and
Research (BMBF), POL 01/043
35 on leave from MSU, partly supported by
University of Wisconsin via the U.S.-Israel BSF
| a | supported by the Natural Sciences and Engineering Research Council of Canada (NSERC) |
|---|---|
| b | supported by the German Federal Ministry for Education and Research (BMBF), under contract numbers HZ1GUA 2, HZ1GUB 0, HZ1PDA 5, HZ1VFA 5 |
| c | supported by the MINERVA Gesellschaft für Forschung GmbH, the Israel Science Foundation, the U.S.-Israel Binational Science Foundation and the Benozyio Center for High Energy Physics |
| d | supported by the German-Israeli Foundation and the Israel Science Foundation |
| e | supported by the Italian National Institute for Nuclear Physics (INFN) |
| f | supported by the Japanese Ministry of Education, Science and Culture (the Monbusho) and its grants for Scientific Research |
| g | supported by the Korean Ministry of Education and Korea Science and Engineering Foundation |
| h | supported by the Netherlands Foundation for Research on Matter (FOM) |
| i | supported by the Polish State Committee for Scientific Research, grant no. 620/E-77/SPUB-M/DESY/P-03/DZ 247/2000-2002 |
| j | partially supported by the German Federal Ministry for Education and Research (BMBF) |
| k | supported by the Fund for Fundamental Research of Russian Ministry for Science and Education and by the German Federal Ministry for Education and Research (BMBF) |
| l | supported by the Spanish Ministry of Education and Science through funds provided by CICYT |
| m | supported by the Particle Physics and Astronomy Research Council, UK |
| n | supported by the US Department of Energy |
| o | supported by the US National Science Foundation |
| p | supported by the Polish State Committee for Scientific Research, grant no. 112/E-356/SPUB-M/DESY/P-03/DZ 301/2000-2002, 2 P03B 13922 |
| q | supported by the Polish State Committee for Scientific Research, grant no. 115/E-343/SPUB-M/DESY/P-03/DZ 121/2001-2002, 2 P03B 07022 |
1 Introduction
In the HERA photoproduction regime, where the virtuality of the exchanged photon is small, the production of inelastic mesons, where can be either a or a , arises mostly from direct and resolved photon interactions. In leading-order (LO) Quantum Chromodynamics (QCD), the two processes can be distinguished: in direct photon processes, the photon couples directly to a parton in the proton; in resolved photon processes, the photon acts as a source of partons, one of which participates in the hard interaction. Diffractive production, , where is a proton-dissociative state, contributes significantly to the inelastic production of mesons by the direct photon process.
Direct and resolved photon cross sections can be calculated using perturbative QCD (pQCD) in the colour-singlet (CS) and colour-octet (CO) frameworks [1, 2, *np:b459:3, 4, 5, *pr:d54:4312, *pr:d60:119902, 8, 9, 10, 11]. In the CS model, the colourless pair produced by the hard subprocess is identified with the physical state. In the CO model, the pair emerges from the hard process with quantum numbers different from those of the and evolves into the physical state by emitting one or more soft gluons. At LO, only the photon-gluon-fusion diagram, , contributes to the direct photon cross section, as shown in Fig. 1a). Figure 1b) shows the LO diagram for the resolved photon process in the CS framework. A diagram for the direct photon process in the CO framework is shown in Fig. 1c). Although a full next-to-leading-order (NLO) calculation of photoproduction is not available for all processes, the NLO corrections to the direct photon process, carried out in the framework of the CS model, have been calculated [2, *np:b459:3].
The production of mesons has been measured in collisions by the CDF collaboration [12, 13]. Predictions of the CS model, which for collisions exist only at LO in QCD, underestimate the data by factors of between 10 and 80. However, after adjustment of the corresponding matrix elements, this difference can be accounted for by the CO contributions [5, *pr:d54:4312, *pr:d60:119902]. Currently, the matrix elements governing the strength of this process cannot be calculated, but have to be determined from experiment. Since they are expected to be universal, the comparison of the values extracted from cross-section measurements in different environments constitutes a stringent test of this approach.
The helicity distributions predicted by the CS and CO models have a different dependence on the of the . Furthermore, the dependence of the polarisation on its transverse momentum is sensitive to the virtuality of the initial gluon in the photon [11]. Results from the CDF collaboration [14] show some discrepancies between the helicity measurements and predictions [10] using CO matrix elements extracted from the CDF cross-section data.
The various photoproduction processes can be distinguished using the inelasticity variable, , defined as:
| (1) |
where , and are the four-momenta of the incoming proton, the meson and the exchanged photon. In the proton rest frame, is the fraction of the photon energy carried by the . Previous HERA data [15, 16, 17] have shown that the diffractive process populates the high- region, 0.9. The direct and resolved photon processes are expected to dominate in the regions and 0.2, respectively [4].
In this study, mesons were identified using the decay mode and were measured in the range 50 180 GeV, where is the centre-of-mass energy. The differential cross sections are given for 0.1 and for different regions of transverse momentum, , of the . The helicity distributions in the ranges 1 and 0.9 are presented and compared to model predictions with or without CO contributions.
2 Theoretical models
2.1 Leading–order Colour Singlet calculations
The LO matrix element for the photon-gluon-fusion process, as computed in the CS framework, is singular for and [1]. Therefore, the comparisons with these theoretical calculations are restricted to the region GeV.
Calculations of direct processes at LO in the CS model have been available for some time [1]. In this paper, the data are compared to the LO prediction from Krämer et al. [2, *np:b459:3, 4] (KZSZ (LO, CS)), including both direct and resolved processes. This calculation used the parton density functions (PDFs) GRV94 LO[18] for the proton and GRV LO[19, *pr:d46:1973] for the photon, the QCD scale parameter, , was set to 0.2 GeV and the factorisation and renormalisation scales were set to , where , the charm-quark mass, was set to 1.5 GeV. Recently, the calculation has been extended to include predictions of the helicity-angle distributions[10] (BKV (LO, CS)).
In the CS framework the distributions of the helicity angle have been calculated by Baranov [11] for the direct photon process. This calculation uses the -unintegrated gluon densities satisfying the BFKL[21, *sovjnp:28:822] evolution equations. Compared to traditional (collinear) parton models, gluons have a transverse-momentum component (or virtuality), which results in an increase in the fraction of longitudinally polarised mesons as increases.
2.2 Next–to–leading–order Colour Singlet calculation
The NLO corrections to the direct photon process in the CS framework have been calculated by Krämer et al. [2, *np:b459:3] (KZSZ (NLO, CS)). This is the only NLO calculation currently available for any production process. The uncertainties in the cross sections arise from uncertainties in the non-perturbative QCD parameters. Upper bounds were obtained by setting 1.3 GeV and the strong coupling constant, , to 0.121 in accordance with the MRST01 () [23] set of proton PDFs. The lower bounds were obtained by setting 1.6 GeV and 0.117, in accordance with the MRST01 () set of PDFs. The dominant uncertainty is due to the variation of the charm-quark mass. For the calculation of the cross-section , the factorisation and renormalisation scales were set to the larger of and . For the prediction of the cross-sections , the factorisation and renormalisation scales were set to [2, *np:b459:3].
2.3 Non–relativistic Quantum Chromodynamics calculations
The LO calculation from Krämer et al. has also been extended to include the CO contributions, (KZSZ (LO, CS+CO)), from both direct and resolved photon processes [4]. The CO matrix elements were extracted by fitting the cross-section for prompt production measured by CDF [13]. The matrix elements for the hard subprocesses were computed at LO, while the CO matrix elements were corrected for initial- and final-state gluon radiation by a Monte Carlo (MC) technique [5, *pr:d54:4312, *pr:d60:119902]. The spread in the predictions is due to theoretical uncertainties in the extraction of the CO matrix elements obtained by comparing the values extracted by different groups; this spread is often larger than the error quoted by each individual group. This calculation has also been extended to predict the helicity-angle distributions[10] (BKV (LO, CS+CO)).
A LO calculation by Beneke, Schuler and Wolf [8] (BSW (LO, CS+CO)) includes only the direct photon process for the CS and CO contributions. Here, the CO matrix elements were extracted from measurements by the CLEO collaboration [24] on meson decays to mesons. The matrix elements extracted using the data from CLEO and CDF are consistent [4]. This calculation models the so-called shape functions that resum an infinite class of CO contributions that are important at high . These functions are responsible for the decrease of the CO contributions towards , due to the lack of phase space for gluon radiation. This treatment introduces an additional parameter into the model called the shape-function parameter which was varied in the range MeV, based on an evaluation[8] of the CLEO data.
Kniehl and Kramer [9] (KK (LO, CS+CO)), like Krämer et al., have calculated CS and CO terms in LO for both direct and resolved photon processes. The CO matrix elements were similarly extracted by fitting the differential cross section for prompt production measured by CDF [13]. The spread in the predictions is due to theoretical uncertainties in the extraction of the CO matrix elements. The calculation approximately takes into account dominant higher-order (HO) QCD effects and was performed in the renormalisation and factorisation scheme, using CTEQ4LO[25] and GRV LO as the proton and photon PDFs, respectively; the QCD scale parameter was set to 296 MeV; common factorisation and renormalisation scales were used and were set to with .
3 Experimental conditions
The data were collected during the 1996 and 1997 running periods, when HERA operated with protons of energy and positrons of energy GeV, and correspond to an integrated luminosity of . This represents more than a tenfold increase with respect to the previous ZEUS analysis [15]. A detailed description of the ZEUS detector can be found elsewhere [26, 27]. A brief outline of the components that are most relevant for this analysis is given below.
Charged particles are tracked in the central tracking detector (CTD) [28, *npps:b32:181, *nim:a338:254], which operates in a magnetic field of provided by a thin superconducting coil. The CTD consists of 72 cylindrical drift chamber layers, organized in 9 superlayers covering the polar angle111The ZEUS coordinate system is a right-handed Cartesian system, with the axis pointing in the proton beam direction, referred to as the “forward direction”, and the axis pointing left towards the centre of HERA. The coordinate origin is at the nominal interaction point. The pseudorapidity is defined as , where the polar angle, , is measured with respect to the proton beam direction. region . The transverse-momentum resolution for full-length tracks is , with in GeV.
The high-resolution uranium–scintillator calorimeter (CAL) [31, *nim:a309:101, *nim:a321:356, *nim:a336:23] consists of three parts: the forward (FCAL), the barrel (BCAL) and the rear (RCAL) calorimeters. Each part is subdivided transversely into towers and longitudinally into one electromagnetic section (EMC) and either one (in RCAL) or two (in BCAL and FCAL) hadronic sections (HAC). The smallest subdivision of the calorimeter is called a cell. The CAL energy resolutions, as measured under test beam conditions, are for electrons and for hadrons ( in GeV). The timing resolution of the CAL is better than 1 ns for energy deposits greater than 4.5 GeV.
The muon system consists of tracking detectors (forward, barrel and rear muon chambers: FMUON [26], B/RMUON [35]), which are placed inside and outside a magnetized iron yoke surrounding the CAL and cover polar angles from 10∘ to 171∘. The barrel and rear inner muon chambers cover polar angles from 34∘ to 135∘ and from 135∘ to 171∘, respectively.
The luminosity was determined from the rate of the bremsstrahlung process , where the photon was measured by a lead–scintillator calorimeter [36, *acpp:b32:2025] located at m.
4 Event selection and reconstruction
The candidates were selected using a three-level trigger system [26]. In the first-level trigger (FLT), the barrel and rear inner muon chambers, BMUI and RMUI, were used to tag the muons from decays by matching segments in the muon chambers with tracks in the CTD, as well as with energy deposits in the CAL consistent with the passage of a minimum ionising particle (m.i.p.). Events satisfying this regional matching and having tracks in the CTD pointing to the nominal interaction vertex were selected.
In the second-level trigger (SLT), the total energy in the calorimeter () and the component of the momentum () were calculated. The sums run over all calorimeter cells with an energy, , and polar angle, , measured with respect to the nominal vertex. To remove proton-gas interactions, events with the ratio greater than 0.96 were rejected. The cosmic-ray background was partially rejected at the SLT by using the time differences of energy deposits in the upper and the lower halves of the BCAL.
In the third-level trigger (TLT), a muon candidate was selected when a track found in the CTD matched both a m.i.p. in the CAL and a track in the inner muon chambers. An event containing a muon candidate in the rear (barrel) region was accepted if the momentum (transverse momentum) of the CTD track exceeded 1 GeV.
In the offline analysis, the TLT algorithm was again applied to the results of the full event reconstruction. In addition, the tracks corresponding to the two muons from the decay had to satisfy several criteria. One track was matched to both a m.i.p. cluster in the CAL and a track in the inner muon chambers. This track was required to have a momentum greater than 1.8 GeV if it was in the rear region, or a transverse momentum greater than 1.4 GeV if in the barrel region. The other muon track was matched to a m.i.p. cluster in the CAL and was required to have a transverse momentum of greater than 0.9 GeV. Both tracks were restricted to the pseudorapidity region . To reject cosmic rays, events in which the angle between the two muon tracks was larger than were removed. Events were also required to have an energy deposit greater than 1 GeV in a cone of around the forward direction (excluding calorimeter deposits due to the decay muons). Elastically produced mesons were thus excluded.
The kinematic region considered was defined by the inelasticity variable , given in Eq. (1), and by the photon-proton centre-of-mass energy:
and were computed from
and
where . The quantity is the sum over the hadronic final state, calculated using all CAL cells excluding those belonging to the decay-muon clusters; was calculated using the decay tracks measured by the CTD.
The events were required to have GeV, which restricts to be less than 180 GeV and GeV2, with a median value of GeV2. The elimination of deep inelastic scattering events was independently confirmed by searching for scattered positrons in the CAL[38]; none was found. As the analysis uses only the B/RMUON, the polar angle coverage of these detectors restricts to be greater than 50 GeV.
5 Monte Carlo models
The production of mesons from direct interactions was simulated using the HERWIG 5.8 [39] MC generator, which generates events according to the LO diagrams of the photon-gluon-fusion process, , as computed in the framework of the CS model. The hadronisation process is simulated by the cluster model [40]. Events were generated in the range of starting from the kinematic limit ( GeV2) up to 10 GeV2. Events were generated for to avoid a singular phase-space region. The GRV94 LO PDF for the proton was used. The HERWIG MC sample was reweighted in and to the data.
The production of mesons from resolved photon interactions was simulated using the PYTHIA 6.146 [41, *cpc:46:43] MC generator (resolved photon interactions for production are not implemented in HERWIG). The GRV94 LO and GRV LO PDFs were used for the proton and photon, respectively. The matrix elements for the resolved photon processes were computed at LO in the framework of the CS model.
Diffractive production of mesons with proton dissociation was simulated with the EPSOFT [43] MC generator, which has been tuned to describe such processes at HERA [44]. Data in the region were used to determine the dependence of the cross section on the invariant mass of the dissociative system, on the photon-proton centre-of-mass energy and on the of the meson.
6 Signal determination and cross-section calculation
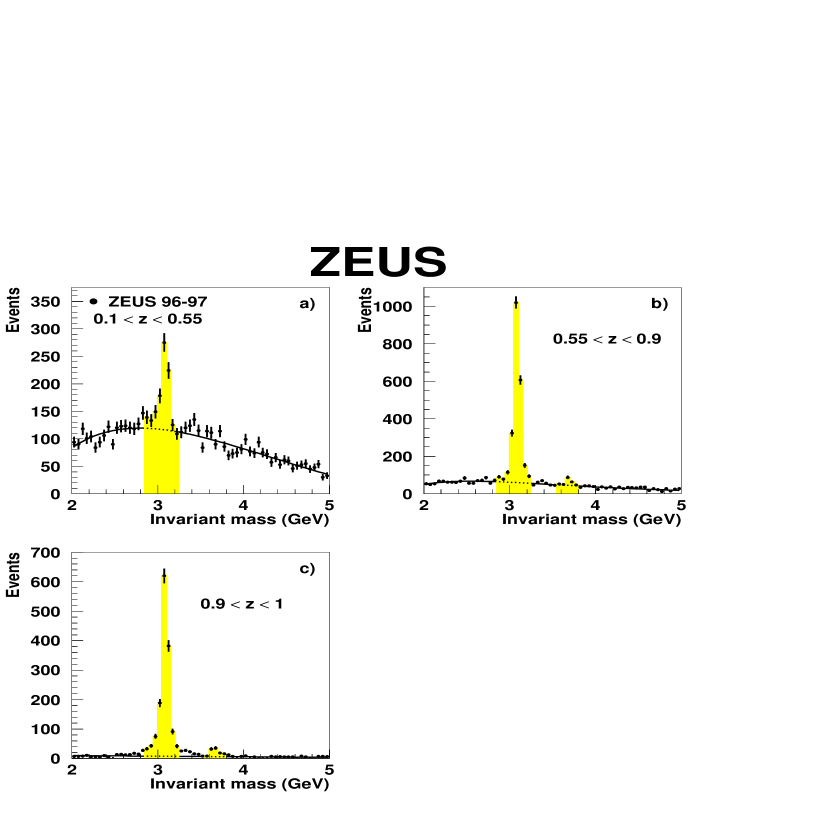
The invariant-mass spectra of the muon pairs measured for 50 180 GeV and three ranges are shown in Fig. 2. The is clearly seen in all ranges. The higher ranges (Figs. 2b) and 2c)) also show a peak.
To estimate the number of events in the signal regions (the mass ranges 2.9 to 3.25 GeV and 3.6 to 3.8 GeV for the and , respectively), an accurate description of the combinatorial background was necessary. This was estimated by fitting the invariant-mass distribution of the data outside the corresponding windows of the mesons, using a function which is the product of a second-order polynomial and an exponential.
The data were corrected bin by bin for geometric acceptance, detector, trigger and reconstruction efficiencies, as well as for detector resolution. The correction factor, as a function of an observable in a given bin , is . The variable is the number of generated events and is the number of reconstructed events passing the selection requirements detailed in Section 4. Both numbers were computed using the MC generators described in Section 5. In this range and the three regions of , 0.1 0.4, 0.4 0.9 and 0.9 1, the acceptance (defined as ) was typically 30 and always above 10.
For 0.9 1, the events are largely diffractive. Therefore, the analysis of inelastic production was restricted to the region . The remaining contamination from diffractive processes was estimated by fitting the relative fractions of HERWIG and EPSOFT MC event samples to the data. A fit was performed to the inelasticity distribution in the region 0.4 1 and three ranges: , and GeV. Figure 3 shows, for events in the region 50 180 GeV and 0.4 1, that the resulting mixture of HERWIG and EPSOFT gives a reasonable description of the relevant event observables. For , with no cut, the diffractive contribution, as estimated with the EPSOFT MC, was 17%, concentrated at low . The diffractive contribution was subtracted bin by bin for all cross-section measurements.
Resolved photon processes are also present in the region of the cross-section measurement. In the region , the resolved photon component was estimated by fitting the relative fractions of direct and resolved photon events in the MC samples to the inelasticity distribution in the data. The fraction of resolved photon events is , reaching up to for , in good agreement with theoretical expectations [4]. In this low range the contribution from decays can be as large as ; it is negligible at higher . The photoproduction cross section was obtained from the measured electron-proton cross section by dividing by the integrated effective photon flux [15].
7 Systematic uncertainties
A detailed study of possible sources of systematic uncertainties was carried out for all measured differential cross sections. The following sources were considered:
-
•
muon-chamber efficiencies: the BMUI and RMUI muon-chamber efficiencies were extracted from the data using muon pairs coming from elastic events and from the process . For GeV, the product of the geometrical and chamber efficiency for the BMUI is greater than , reaching at high transverse momentum. For GeV, this product for the RMUI is greater than , reaching at high momentum. The associated uncertainty of about is independent of the phase-space region;
-
•
analysis cuts: this class comprises the systematic uncertainties due to the uncertainties in the measurement of momentum, transverse momentum and pseudorapidity of the muon decay tracks. Each cut was varied within a range determined by the resolution in the appropriate variable. The pseudorapidity contribution gave an uncertainty below , while variation of the appropriate momentum or transverse momentum cut gave a contribution;
-
•
CAL energy scale: CAL energy measurements were used in the and reconstruction. This leads to a systematic uncertainty in the measured cross section due to the uncertainty on the energy scale of the CAL. This effect was investigated by varying the quantity by in the MC sample, leading to a variation of the cross sections of for . Integrated over , the effect is typically below ;
-
•
CAL energy resolution: the and resolutions are dominated by the CAL energy resolution through the quantity . The resolution in the MC was smeared event by event by . This estimated any possible mismatch between the resolution in the data and MC simulation, giving an uncertainty of ;
-
•
diffractive subtraction: the fraction of HERWIG and EPSOFT MC events, fixed by the fitting procedure described in Section 6, is known to a precision limited by the number of events in the data and the process modelling. All possible fractions giving a in the interval were considered and the largest change in the cross section was quoted as the systematic uncertainty. This gave an uncertainty which was at most at high and low , where the diffractive contribution peaks;
-
•
diffractive simulation: the EPSOFT MC simulation parameters were varied within ranges allowed by the comparison between the data and the EPSOFT MC simulation in the region . The fraction of HERWIG and EPSOFT MC events was re-evaluated. This gave an uncertainty which was at most at high and low ;
-
•
and spectra: the and spectra of the meson in the HERWIG MC simulation were varied within ranges allowed by the comparison between the data and the simulation and the correction factors re-evaluated. This gave an uncertainty of ;
-
•
helicity parameterisation uncertainty: in the HERWIG MC, the helicity parameter is set to 0. As a systematic check, the helicity in the HERWIG MC was reweighted according to the upper and lower limits of error in the measured distribution and the correction factors re-evaluated. This gave an uncertainty of , independent of the phase-space region.
All of the above individual sources of systematic uncertainty were added in quadrature. The following sources resulted in an overall shift of the cross section and were therefore treated separately:
-
•
the integrated luminosity determination gave an uncertainty of ;
-
•
the branching ratio of gave an uncertainty of [45].
8 Results
8.1 Total cross-section measurement at high
A cross-section measurement in the region is particularly interesting because the CO mechanism is expected to contribute significantly at high [4], whereas for the sensitivity to this production mechanism is reduced. In particular, at large , the impact of the soft-gluon emission on the hadronisation of CO pairs is not well understood [4, 8, 46]. In the region , the resolution is comparable to the width of the interval and the diffractive process is dominant; hence the separation of the direct and diffractive components is not reliable. Therefore, only the visible cross section in the region , including the diffractive component, is given. Furthermore, due to the requirement of an energy deposit in the direction of the outgoing proton, necessary to remove the elastic component, only diffractive events with a high-enough invariant mass, , of the final-state hadronic system were included here. Monte Carlo studies showed that the requirement of an energy deposit exceeding 1 GeV in a 35∘ cone around the outgoing proton direction corresponds to a threshold in of 4.4 GeV, above which all correction factors were independent of . The following cross sections, corresponding to the phase–space region defined by 50 180 GeV, 0.9 1, 4.4 GeV were obtained:
The uncertainties on the value of the threshold and the CAL energy resolutions are of similar importance and dominate the systematic uncertainty.
8.2 Measurement of production
The production of with subsequent decay to has been measured using the rates of and . The to cross-section ratio was determined in the region 0.55 0.9 with no cut on the mesons. The range was not included, because it has a large non-resonant background. The to cross-section ratio was computed in bins of , and from
where, for the considered bin , () is the number of () events observed, () is the correction factor (see Section 6) computed using HERWIG MC () events, () is the () muonic branching ratio and is the branching ratio. The values used were , and [45].
With this technique, the cross-section ratio is corrected for the cascade decay. The results are shown in Fig. 4 and listed in Table 1; all cross-section ratios are consistent with being independent of the kinematic variable, as expected if the underlying production mechanisms for the and are the same. For the range and GeV, the to cross-section ratio is
| (2) |
in agreement with the expectation of the LO CS model of 0.24 [2, *np:b459:3].
Even though the NLO corrections to the CS model for production are known to be large, similar large NLO corrections are expected to affect the rate of production [47]. Hence the to cross-section ratio at NLO is not expected to differ significantly from that at LO. From the cross-section ratio and the branching ratio [45], it is estimated that the observed cross section for mesons is increased by (18.45.6 (stat.)) due to mesons originating from cascade decays. This is consistent with the expected value of [2, *np:b459:3], which has been added to all predictions of the differential cross sections presented in this paper.
8.3 Measurement of inelastic cross sections
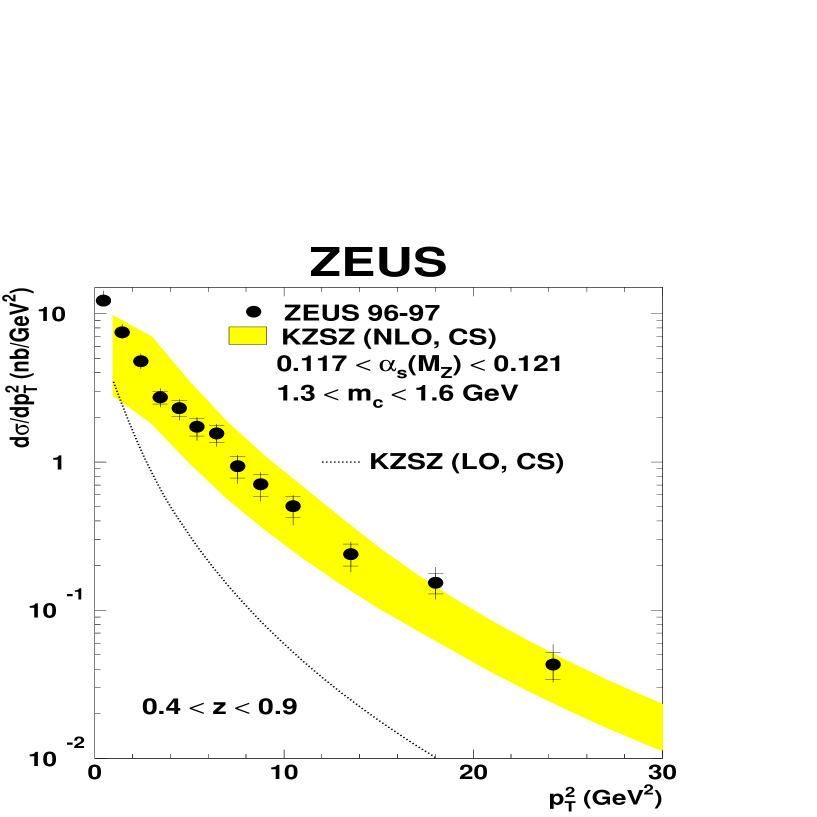
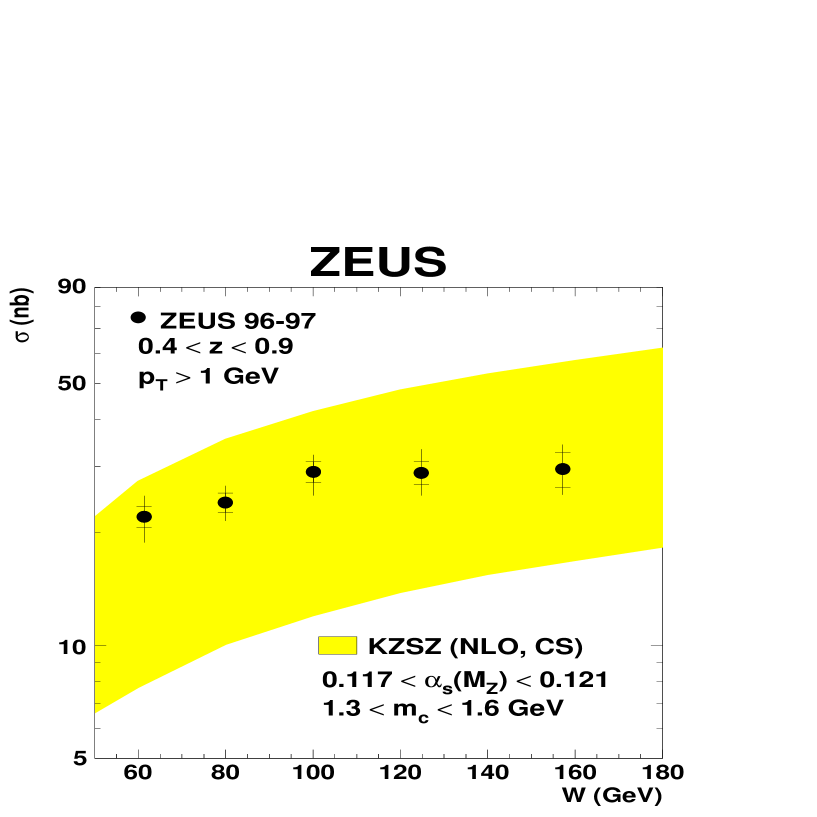
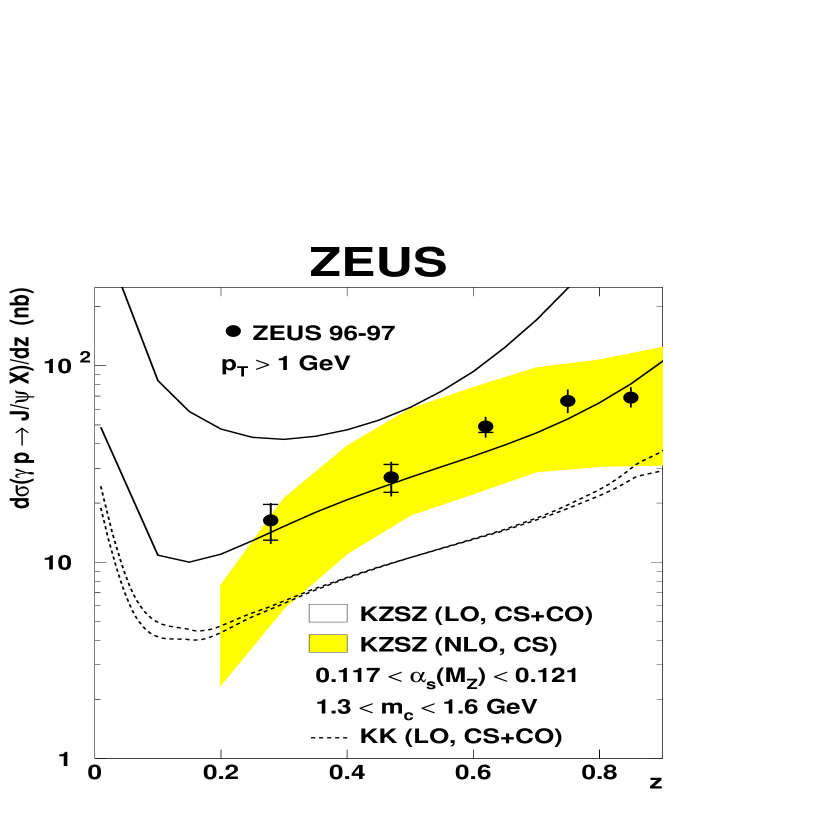
The differential cross-sections for three different regions in and 0.1 0.9 are shown in Figs. 5,8 and 9 and listed in Tables 2,3 and 4. All data sets show a cross section increasing with . The differential cross-section , measured in the region 0.4 0.9, is shown in Fig. 6 and listed in Table 5. The measurement extends to , where the cross section has fallen by two orders of magnitude. The cross-section has a function of , for GeV and 0.4 0.9, is given in Table 6 and shown in Fig. 7. The differential cross-section in the region and GeV is shown in Fig. 10 and listed in Table 7. The rapidity, , of the is given by
where and are the energy and component of the momentum of the , respectively.
The helicity distribution can be parameterised as
| (3) |
The helicity-parameter was determined by reweighting the HERWIG MC generator-level distribution according to Eq. (3) for different values of . The for the distribution in data and MC was then calculated for each value of in the MC and the minimum gave the central value of . The procedure was repeated for each bin in the range GeV. The systematic uncertainties were negligible with respect to the error obtained from the fit.
Figure 11 shows the measured parameter plotted as a function of the of the . In Fig. 11a) and b), the quantisation axis is chosen to be the opposite of the incoming proton direction in the rest frame, is the opening angle between the quantisation axis and the direction of flight in the rest frame and is the helicity parameter. This frame is known as the “target frame”. The parameter was determined in bins of , for 1 GeV and 0.4 1 (Fig. 11a)). The parameter was also measured in the range (Fig. 11b)), where the diffractive contamination is reduced. The values of the helicity-parameter are summarized in Table 8. The CDF helicity-angle definition was also used, where the quantisation axis was defined as the direction of flight in the ZEUS coordinate system; this frame is known as the “helicity basis”[14]. The parameter measured in this frame is shown in Fig. 11c) and d) and listed in Table 9. The values and correspond to fully longitudinal and transverse polarisation, respectively. Within the large experimental uncertainties, the data are consistent with a trend from transverse to longitudinal polarisation with increasing .
These results are consistent with the previous ZEUS measurements [15], but have an improved precision and extend to higher . Recently, the H1 collaboration has also published a measurement of inelastic production [17] showing similar features to those presented here.
8.3.1 Comparison with leading–order Colour Singlet calculations
Figure 6 shows a comparison of the KZSZ (LO, CS) predictions with the data. For , the prediction underestimates the data by a factor of about two, although this is within the range of the theoretical uncertainties. For higher values, the calculation falls increasingly below the data. At , the LO CS prediction undershoots the data by a factor of .
The prediction of BKV (LO, CS) for the helicity-parameter as a function of in the target frame is shown in Figs. 11a) and b). The prediction lies somewhat below the data at low and somewhat above at high , although the data have large statistical uncertainties. This general trend appears for both 0.4 1 and 0.4 0.9 regions. The prediction from Baranov also lies below the data at low , but gives a good description of the data for GeV.
The LO CS prediction from Baranov is also shown in Fig. 11c) and d) compared to the data for the helicity-base frame. The GRV prediction was obtained by adding [48] a dependence to the GRV (collinear) gluon density. The KMS prediction was obtained from the -unintegrated gluon density [49]. The data is reasonably well described by both predictions.
8.3.2 Comparison with the next–to–leading–order Colour Singlet calculation
The KZSZ (NLO, CS) prediction is compared to the data for in Fig. 6. The prediction is not reliable in the limit[2, *np:b459:3] and hence is only shown for GeV. The predicted shape, controlled by QCD gluon radiation, is in good agreement with the data. The normalisation of the predicted cross sections is sensitive to the assumed values of the non-perturbative QCD input parameters, such as the mass of the charm quark and the value of . The uncertainty resulting from the variation of the renormalisation and factorisation scales is small by comparison [47]. The overall normalisation of the data is well described by the calculation, although the prediction suffers from large uncertainties. The discrepancy between the data and the LO CS prediction can therefore be explained by large NLO corrections.
The prediction is also compared to the cross-section as a function of in Fig. 7. The prediction again suffers from large theoretical uncertainties but describes the shape and normalisation of the data. Similar conclusions can be drawn from the comparison with the differential cross-sections shown in Figs. 8–9.
8.3.3 Comparison with non–relativistic Quantum Chromodynamics calculations
The inelasticity distributions in Figs. 8–9 are compared with different predictions including CO matrix elements extracted by fitting independent data sets. In Fig. 8, for GeV is compared with the KZSZ (LO, CS+CO) and KK (LO, CS+CO) calculations. The rise of the predicted cross section for 0.1 is due to resolved photon processes. Within the large theoretical uncertainties, the prediction KZSZ (LO, CS+CO) gives a good description of the data. The KK (LO, CS+CO) result lies significantly below the data, but describes the shape reasonably well.
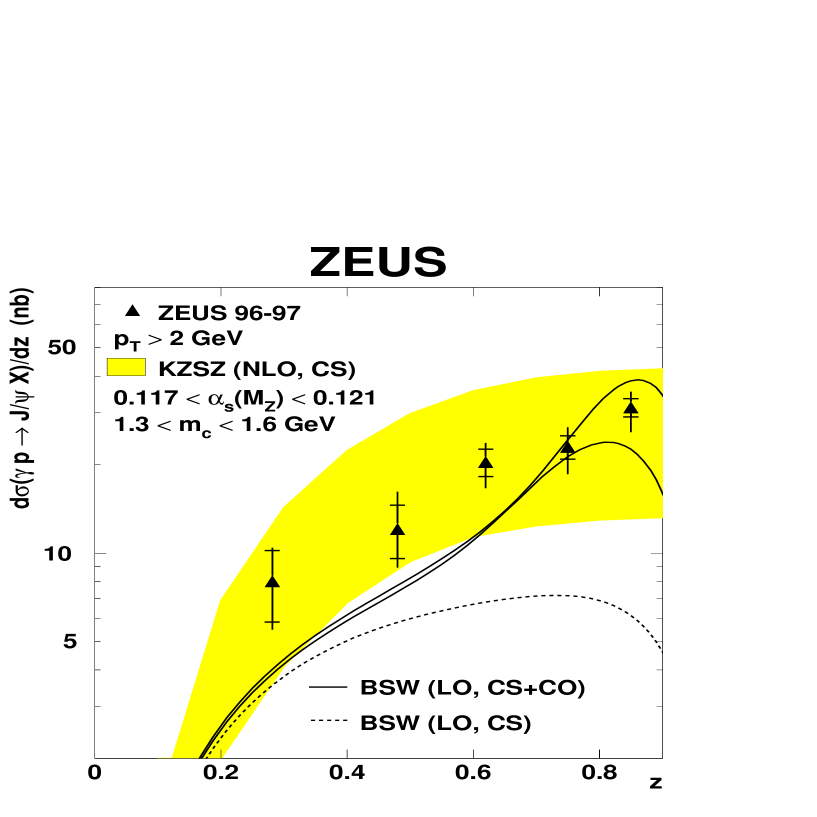
In Fig. 9, the differential cross-section for GeV is compared with the BSW (LO, CS) and BSW (LO, CS+CO) calculations[8]. The CS prediction clearly lies below the data, whilst the inclusion of the CO terms gives a better description. The spread in the prediction, which is largest at high , is due to the uncertainty on the value of the shape-function parameter. The overall shape of the spectrum is weakly dependent on the CO matrix elements, which primarily affect the global normalisation of the spectrum.
The KK (LO, CS+CO) prediction is compared to the cross-section in Fig. 10 for the kinematic region 50 180 GeV, 0.4 0.9 and 1 GeV. The calculation includes both direct and resolved photon processes, but the resolved photon contribution is negligible in the selected phase-space region (due to the lower cut). The predicted cross section falls well below the data, although the shape is reasonably reproduced, as shown when the prediction is multiplied by a factor of three.
In Figs. 11a) and b), the BKV (LO, CS+CO) prediction is compared to the data for the helicity-parameter distribution as a function of . The spread in the prediction is due to theoretical uncertainties on the values of the CO matrix elements. In the currently accessible range, the CS plus CO predictions are similar to those of the CS only, although the prediction from the CS model rises with , while the CS plus CO prediction decreases slightly.
9 Conclusions
Cross sections of inelastic photoproduction have been measured and compared with LO and NLO QCD predictions. The LO CS prediction does not describe the spectrum. A NLO QCD calculation in the framework of the CS model, including only the direct photon process, gives a good description of the and differential cross sections and of the cross section as a function of . However, given the large theoretical uncertainties affecting the NLO calculation, it is currently not possible to constrain the size of the CO contributions. Furthermore, LO calculations including CO contributions, as determined from data, describe the data, albeit with large theoretical uncertainties. Although the helicity distribution at high is sensitive to the underlying production mechanism, the data are unable to distinguish between the two mechanisms. These results agree with the measurements recently published by the H1 collaboration after taking into account, by MC extrapolation, the small ( 10 %) normalisation differences due to the different phase–space regions probed by the two experiments.
Acknowledgements
The design, construction and installation of the ZEUS detector have been made possible by the ingenuity and dedicated efforts of many people from inside DESY and from the home institutes who are not listed as authors. Their contributions are acknowledged with great appreciation. The experiment was made possible by the inventiveness and the diligent efforts of the HERA machine group. The strong support and encouragement of the DESY directorate have been invaluable. We are grateful to M. Krämer for providing his theoretical curves and for many useful discussions. We want to thank B. A. Kniehl, G. Kramer, S. P. Baranov, M. Cacciari, M. Beneke, G.A. Schuler, S. Wolf and M. Vanttinen for making their theoretical calculations available to us.
10
References
- [1] E. L. Berger and D. Jones, Phys. Rev. D 23, 1521 (1981)
- [2] M. Krämer et al., Phys. Lett. B 348, 657 (1995)
- [3] M. Krämer, Nucl. Phys. B 459, 3 (1996)
- [4] M. Krämer, Prog. Part. Nucl. Phys., 47, 141 (2001)
- [5] M. Cacciari and M. Krämer, Phys. Rev. Lett. 76, 4128 (1996)
- [6] P. Ko, J. Lee and H. S. Song, Phys. Rev. D 54, 4312 (1996)
- [7] P. Ko, J. Lee and H. S. Song, Phys. Rev. D 60, 119902 (1999)
- [8] M. Beneke, G. A. Schuler and S. Wolf, Phys. Rev. D 62, 34004 (2000)
- [9] B. A. Kniehl and G. Kramer, Eur. Phys. J. C 6, 493 (1999)
- [10] M. Beneke, M. Krämer and M. Vanttinen, Phys. Rev. D 57, 4258 (1998)
- [11] S. P. Baranov, Phys. Lett. B 428, 377 (1998)
- [12] CDF Collab., F. Abe et al., Phys. Rev. Lett. 79, 572 (1997)
- [13] CDF Collab., F. Abe et al., Phys. Rev. Lett. 79, 578 (1997)
- [14] CDF Collab., T. Affolder et al., Phys. Rev. Lett. 85, 2886 (2000)
- [15] ZEUS Collab., J. Breitweg et al., Z. Phys. C 76, 599 (1997)
- [16] H1 Collab., S. Aid et al., Nucl. Phys. B 472, 3 (1996)
- [17] H1 Collab., C. Adloff et al., Eur. Phys. J. C 25, 25 (2002)
- [18] M. Glück, E. Reya and A. Vogt, Z. Phys. C 67, 433 (1995)
- [19] M. Glück, E. Reya and A. Vogt, Phys. Rev. D 45, 3986 (1992)
- [20] M. Glück, E. Reya and A. Vogt, Phys. Rev. D 46, 1973 (1992)
- [21] E.A. Kuraev, L.N. Lipatov and V.S. Fadin, Sov. Phys. JETP 45, 199 (1977)
- [22] Ya.Ya. Balitskiĭ and L.N. Lipatov, Sov. J. Nucl. Phys. 28, 822 (1978)
- [23] A. D. Martin et al., Eur. Phys. J. C 23, 73 (2002)
- [24] CLEO Collab., R. Balest et al., Phys. Rev. D 52, 2661 (1995)
- [25] H.L. Lai et al., Phys. Rev. D 55, 1280 (1997)
- [26] ZEUS Collab., U. Holm (ed.), The ZEUS Detector. Status Report (unpublished), DESY, 1993, available on http://www-zeus.desy.de/bluebook/bluebook.html
- [27] ZEUS Collab., M. Derrick et al., Phys. Lett. B 293, 465 (1992)
- [28] N. Harnew et al., Nucl. Instr. and Meth. A 279, 290 (1989)
- [29] B. Foster et al., Nucl. Phys. Proc. Suppl. B 32, 181 (1993)
- [30] B. Foster et al., Nucl. Instr. and Meth. A 338, 254 (1994)
- [31] M. Derrick et al., Nucl. Instr. and Meth. A 309, 77 (1991)
- [32] A. Andresen et al., Nucl. Instr. and Meth. A 309, 101 (1991)
- [33] A. Caldwell et al., Nucl. Instr. and Meth. A 321, 356 (1992)
- [34] A. Bernstein et al., Nucl. Instr. and Meth. A 336, 23 (1993)
- [35] G. Abbiendi et al., Nucl. Instr. and Meth. A 333, 342 (1993)
- [36] J. Andruszków et al., Report DESY-92-066, DESY, 1992
- [37] J. Andruszków et al., Acta Phys. Pol. B 32, 2025 (2001)
- [38] H. Abramowicz, A. Caldwell and R. Sinkus, Nucl. Instr. and Meth. A 365, 508 (1995)
- [39] G. Marchesini et al., Comp. Phys. Comm. 67, 465 (1992)
- [40] B. R. Webber, Nucl. Phys. B 238, 492 (1984)
- [41] T. Sjöstrand and M. Bengtsson, Comp. Phys. Comm. 43, 367 (1987)
- [42] H.-U. Bengtsson and T. Sjöstrand, Comp. Phys. Comm. 46, 43 (1987)
- [43] M. Kasprzak, Ph.D. Thesis, Warsaw University, Warsaw, Poland, Report DESY F35D-96-16, DESY, 1996
- [44] L. Adamczyk, Ph.D. Thesis, University of Mining and Metallurgy, Cracow, Poland, Report DESY-THESIS-1999-045, DESY, 1999
- [45] Particle Data Group, K. Hagiwara et al., Phys. Rev. D 66, 10001 (2002)
- [46] M. Beneke, I. Z. Rothstein and M. B. Wise, Phys. Lett. B 408, 373 (1997)
- [47] M. Krämer, private communication
- [48] J. Blümlein, Preprint DESY-95-121 (hep-ph/9506403), DESY, 1995
- [49] J. Kwiecinski, A. Martin and A. Stasto, Phys. Rev. D 56, 3991 (1997)
| (GeV) | (GeV) | |
| 0.0 - 1.0 | 0.5 | 0.17 |
| 1.0 - 1.75 | 1.38 | 0.35 |
| 1.75 - 5.0 | 3.38 | 0.26 |
| (GeV) | (GeV) | |
| 50. - 85. | 67.5 | 0.28 |
| 85. - 110. | 97.5 | 0.26 |
| 110. - 180. | 145. | 0.32 |
| 0.55 - 0.7 | 0.625 | 0.39 |
| 0.7 - 0.8 | 0.75 | 0.19 |
| 0.8 - 0.9 | 0.85 | 0.30 |
| bkg | |||
|---|---|---|---|
| % | (nb) | ||
| 0.10–0.40 | 0.28 | 0. | 26.6 |
| 0.40–0.55 | 0.47 | 0. | 45.3 |
| 0.55–0.70 | 0.62 | 3. | 76.3 |
| 0.70–0.80 | 0.75 | 9. | 96.7 |
| 0.80–0.90 | 0.85 | 34. | 97.6 |
| bkg | |||
|---|---|---|---|
| % | (nb) | ||
| 0.10–0.40 | 0.28 | 0. | 16.3 |
| 0.40–0.55 | 0.47 | 0. | 27.1 |
| 0.55–0.70 | 0.62 | 2. | 49.0 |
| 0.70–0.80 | 0.75 | 8. | 66.2 |
| 0.80–0.90 | 0.85 | 28. | 68.9 |
| bkg | |||
|---|---|---|---|
| % | (nb) | ||
| 0.10–0.40 | 0.28 | 0. | 8.0 |
| 0.40–0.55 | 0.48 | 0. | 12.1 |
| 0.55–0.70 | 0.62 | 0. | 20.4 |
| 0.70–0.80 | 0.75 | 6. | 23.0 |
| 0.80–0.90 | 0.85 | 16. | 31.3 |
| bkg | |||
|---|---|---|---|
| (GeV2) | (GeV2) | % | (nb/GeV2) |
| 0. – 1. | 0.46 | 22. | 12.3 |
| 1. – 2. | 1.45 | 18. | 7.5 |
| 2. – 3. | 2.45 | 16. | 4.8 |
| 3. – 4. | 3.46 | 15. | 2.7 |
| 4. – 5. | 4.47 | 14. | 2.3 |
| 5. – 6. | 5.40 | 10. | 1.73 |
| 6. – 7. | 6.45 | 3. | 1.56 |
| 7. – 8. | 7.55 | 0. | 0.94 |
| 8. – 9.5 | 8.78 | 0. | 0.71 |
| 9.5 – 11.5 | 10.48 | 0. | 0.50 |
| 11.5 – 15.5 | 13.53 | 0. | 0.24 |
| 15.5 – 21. | 18.02 | 0. | 0.15 |
| 21. – 30. | 24.22 | 0. | 0.043 |
| bkg | |||
|---|---|---|---|
| (GeV) | (GeV) | (nb) | |
| 50 – 70 | 61.3 | 27. | 22.0 |
| 70 – 90 | 79.9 | 14. | 24.1 |
| 90 – 110 | 100.1 | 10. | 29.1 |
| 110 – 140 | 124.8 | 9. | 28.9 |
| 140 – 180 | 157.2 | 4. | 29.6 |
| bkg | |||
|---|---|---|---|
| % | (nb) | ||
| -1.6 – -1.2 | -1.32 | 7. | 3.3 |
| -1.2 – -0.8 | -0.97 | 9. | 7.9 |
| -0.8 – -0.4 | -0.59 | 9. | 11.1 |
| -0.4 – 0. | -0.20 | 10. | 10.5 |
| 0. – 0.4 | 0.18 | 14. | 10.6 |
| 0.4 – 0.8 | 0.59 | 18. | 10.9 |
| 0.8 – 1.2 | 0.92 | 17. | 8.1 |
| (0.4 1) | (0.4 0.9) | ||
|---|---|---|---|
| (GeV) | (GeV) | ||
| 1.0 – 1.2 | 1.10 | 1.12 | 1.12 |
| 1.2 – 1.4 | 1.30 | 1.02 | 0.82 |
| 1.4 – 1.6 | 1.50 | 0.76 | 1.44 |
| 1.6 – 1.9 | 1.74 | 0.32 | 0.30 |
| 1.9 – 2.4 | 2.13 | -0.09 | -0.21 |
| 2.4 – 3.4 | 2.81 | -0.05 | -0.57 |
| 3.4 – 5.0 | 4.06 | -0.24 | -0.03 |
| (0.4 1) | (0.4 0.9) | ||
|---|---|---|---|
| (GeV) | (GeV) | ||
| 1.0 – 1.2 | 1.10 | 0.24 | 0.37 |
| 1.2 – 1.4 | 1.30 | 0.07 | -0.05 |
| 1.4 – 1.6 | 1.50 | -0.07 | 0.55 |
| 1.6 – 1.9 | 1.74 | -0.09 | -0.13 |
| 1.9 – 2.4 | 2.13 | -0.28 | -0.49 |
| 2.4 – 3.4 | 2.81 | -0.27 | -0.58 |
| 3.4 – 5.0 | 4.06 | 0.39 | 0.74 |