Solar Neutrino Observations at the Sudbury Neutrino Observatory
Abstract
The Sudbury Neutrino Observatory (SNO) is a 1000-tonne heavy water Cherenkov detector. Its usage of D2O as target allows the simultaneous measurements of the flux from 8B decay in the Sun and the total flux of all active neutrino species through the charged-current and the neutral-current interactions on the deuterons. Assuming the standard 8B shape, the component of the 8B solar neutrino flux is measured to be for a kinetic energy threshold of 5 MeV. The non-component is found to be . This difference provides strong evidence for flavor transformation in the solar neutrino sector. The total active neutrino flux is measured with the neutral-current reaction at a neutrino energy threshold of 2.2 MeV. This flux is determined to be , and is consistent with solar model predictions. Assuming an undistorted 8B spectrum, the night minus day rate is 14.06.3(stat.)(sys.)% of the average rate in the charged-current channel. If the total active neutrino flux is constrained to have no asymmetry, the night-day asymmetry in the flux is found to be 7.04.9(stat.)(sys.)%. A global analysis of all the available solar neutrino data in terms of matter-enhanced oscillations of two active flavors strongly favors the Large Mixing Angle (LMA) solution.
1 Introduction
For more than 30 years, solar neutrino experiments [1, 2, 3, 4, 5, 6] have been observing fewer neutrinos than what are predicted by the detailed models [7, 8] of the Sun. This deficit is known as the Solar Neutrino Problem. A comparison of the predicted and observed solar neutrino fluxes for these experiments are shown in Table 1. These experiments probe different parts of the solar neutrino energy spectrum, and show an energy dependence in the observed solar neutrino flux. These observations can be explained if the solar models are incomplete or neutrinos undergo flavor transformation while in transit to the Earth.
The Sudbury Neutrino Observatory[9] was constructed to resolve this solar neutrino puzzle. It is capable of making simultaneous measurements of the electron-type neutrino () flux from 8B decay in the Sun and the flux of all active neutrino flavors through the following reactions:
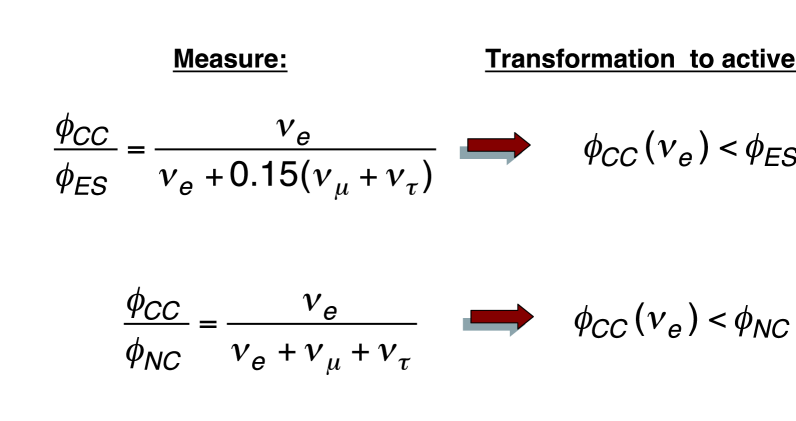
The charged-current (CC) reaction on the deuteron is sensitive exclusively to , and the neutral-current (NC) reaction has equal sensitivity to all active neutrino flavors (; ). Elastic scattering (ES) on electron is also sensitive to all active flavors, but with reduced sensitivity to and .
Because of its equal sensitivity to all active neutrinos, the neutral-current measurement can determine the total neutrino flux, hence resolving the Solar Neutrino Problem, even if neutrinos oscillate[10]. SNO is currently the only experiment that can simultaneously observe the disappearance of and the appearance of another active species. This is illustrated in Figure 1. Another feature of the neutral-current interaction is its low kinematic threshold. By efficiently counting the free neutrons in the final state of the neutral-current reaction, the total active 8B neutrino flux can be inferred for neutrinos with energy above the 2.2-MeV kinematic threshold.
Recent results [11, 12] from the measurements of the solar 8B neutrino flux by the SNO detector using the CC, NC and ES reactions are presented in this paper. The results[13] of a measurement of the day-night asymmetry of the neutrino event rates, which is predicted under certain neutrino oscillation scenarios, are also presented. Finally, the physics implications of these observations will be discussed.
| Experiment | Measured Flux | SSM Flux [7] |
|---|---|---|
| Homestake[1] | 2.560.16(stat.)0.16(sys.) SNU | 7.6SNU |
| SAGE[3] | 70.8(stat.) SNU | 128 SNU |
| Gallex[4] | 77.56.2(stat.)(sys.) SNU | 128 SNU |
| GNO[5] | 65.8(stat.)(sys.) SNU | 128 SNU |
| Kamiokande[2] | 2.800.19(stat.)0.33(sys.)106 | 5.05 |
| Super-Kamiokande[6] | 2.350.03(stat.)(sys.)106 | 5.05 |
2 The Sudbury Neutrino Observatory
2.1 Physical Description of the SNO Detector
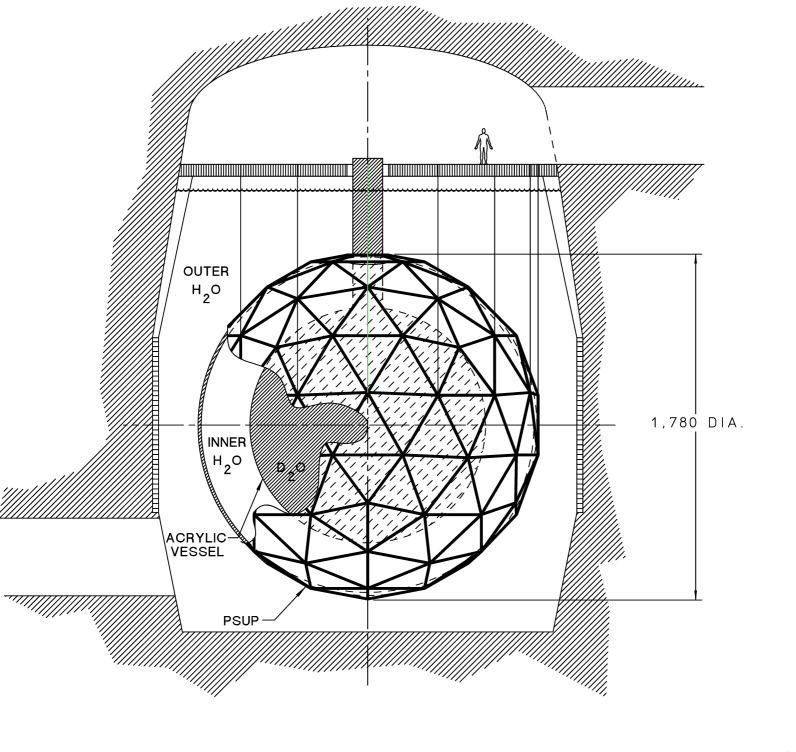
SNO [9] is an imaging water Cherenkov detector located in the Creighton #9 mine, owned by the International Nickel Company (INCO) near Sudbury, ON, Canada. A barrel-shaped cavity with a height of 34 m and a diameter of 22 m was excavated at a depth of 2092 m (or 6000 meters of water equivalent) to house the detector. The muon flux traversing the detector is 67 day-1.
Figure 2 shows a cross-sectional view of the SNO detector. The neutrino detection medium is 1000 metric tons of 99.92% isotopically pure D2O contained in a 12-m diameter acrylic sphere. The acrylic vessel is constructed out of 122 ultraviolet transmitting acrylic panels. This sphere is surrounded by 7000 metric tons of ultra-pure H2O contained in the cavity. This volume of H2O shields the detector from high energy rays and neutrons originating from the cavity wall. A 17.8-m diameter stainless steel structure supports 9456 20-cm diameter inward-facing photomultiplier tubes (PMTs). A non-imaging light concentrator is mounted on each PMT, extending the total photocathode coverage to 55%. An additional 91 PMTs are mounted facing outward on the support structure to serve as a cosmic-ray veto. To cancel the vertical components of the terrestrial magnetic field, 14 horizontal magnetic compensation coils were built into the cavity wall. The maximum residual field at the PMT array is 19T, and the reduction in photo-detection efficiency is about 2.5% from the zero-field value.
A physics event trigger is generated in the detector when there are 18 or more PMTs exceeding a threshold of 0.25 photo-electrons within a coincidence time window of 93 ns. All the PMT hits registered in the 420 ns window after the start of the coincidence time window are recorded in the data stream. This widened time window allows scattered and reflected Cherenkov photons to be included in the event. The mean noise rate of the PMTs is 500 Hz, which results in 2 noise PMT hits in this 420 ns window. The instantaneous trigger rate is about 13-20 Hz, of which 5-8 Hz are physics triggers. The remaining triggers are diagnostic triggers for monitoring the well being of the detector. The trigger efficiency reaches 100% when the PMT multiplicity (Nhits) in the event window is 23.
2.2 Solar Neutrino Physics Program at SNO
The solar neutrino physics program at SNO is designed to exploit its unique NC capability. Because the result of this NC measurement is a definitive statement on the Solar Neutrino Problem and flavor transformation of solar neutrinos, the SNO experiment has implemented a plan to make three independent NC measurements of the total 8B active neutrino flux.
The first NC measurement was made with a pure D2O target. The free neutron from the NC interaction is thermalized, and for 30% of the time, a 6.25-MeV ray is emitted following the neutron capture by a deuteron. Only 50% of the 6.25-MeV observed photopeak is above the neutrino analysis threshold, yielding a detection efficiency of 15%. The results from this NC measurement is presented in this paper. The second NC measurement is being made with 2 tonnes of NaCl added to the D2O. The free neutron is readily captured by 35Cl in this detector configuration, and a cascade of rays with a total energy of 8.6 MeV follow. The neutron detection efficiency is significantly enhanced, and 45% of the NC events have a detectable signal above the analysis threshold. This phase of the experiment is scheduled to complete by the end of 2002. In the third NC measurement, discrete 3He proportional counters will be installed inside the D2O volume [14]. The neutron detection efficiency of the proportional counter array is 40%. In this detector configuration, the detection of the CC and the NC signals are decoupled, and the covariance of the CC and NC signals that appear in the first two detector configurations is eliminated in this case.
3 Solar Neutrino Analysis at SNO
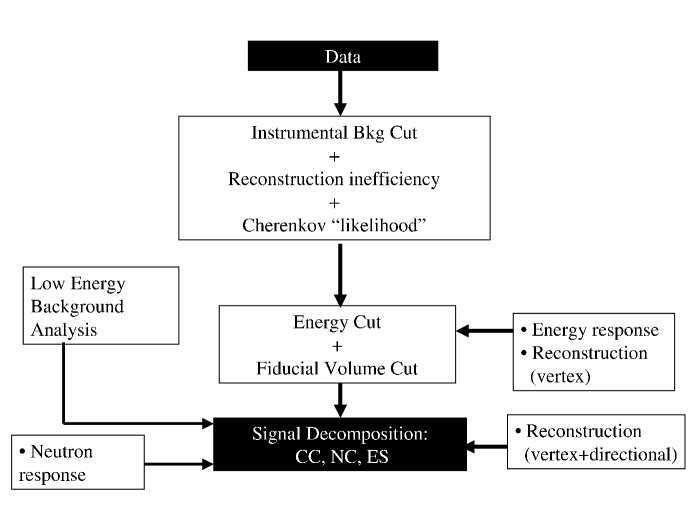
The data presented in this paper were recorded between November 2, 1999 and May 28, 2001. The corresponding livetime is 306.4 days. During this data acquisition period, the Sun was above the detector’s horizon (“day” data set) for 128.5 days, and below the detector horizon (“night” data set) for 177.9 days. The target was pure D2O during this period. Figure 3 summarizes the analysis procedure for extracting the CC, NC and the ES event rates in the SNO detector. In the following, each step in the analysis flow is discussed in detail.
3.1 Data Reduction and Data Loss
After removing all the detector diagnostic triggers from the data stream, a significant portion of the remaining events are instrumental backgrounds. Examples of these backgrounds include electrical discharges in the PMTs (“flashers”) and light emission from discharges in insulating detector materials. Data reduction schemes were developed to remove these backgrounds.
3.1.1 Pass 0 Cut
The instrumental backgrounds have characteristic PMT time and charge distributions that are significantly different from Cherenkov light, and can be eliminated using cuts based on these distributions. For example, the discharge light emitted from a flasher PMT is detected across the detector 70 ns after the initial discharge is registered. Some of these light-emitting instrumental backgrounds are localized near the water piping near the top of the detector. Veto PMTs were installed in this region in order to enhance the rejection efficiency of these non-Cherenkov events. Interference in the electronics system can produce false events. Most of the registered electronic channel charges in these interference events are near the pedestal, and can be removed by a cut on the mean charge of the fired PMTs. Some of these electrical discharge or electronic interference background events also have different event-to-event time correlations from physics events, and time correlation cuts are used to remove these events. Two independent instrumental background rejection schemes are used. An event-by-event comparison of the data sets reduced by these two schemes shows a difference of 0.2%.
The physics loss due to these instrumental background cuts is calibrated with a triggered 16N 6.13-MeV -ray source [15] and a triggered 8Li 13-MeV endpoint source [16] deployed to the D2O and H2O volumes. Further tests of the Nhits dependence in the cuts are performed with an isotropic light source at various intensities. The physics acceptance of the instrumental background cuts, weighted over the fiducial volume, is measured to be 0.9966. Instrumental background rejection is well over 99% at this stage.
3.1.2 High Level Cuts
After passing the instrumental background cuts, all events with Nhits30 (3.5 MeV electron energy) are reconstructed. Once the event reconstruction information becomes available after the reconstruction, several high level physics cuts are applied to the Pass 0-reduced data set to further reduce the instrumental backgrounds. The efficiency of the reconstruction algorithm is calibrated with the 16N and the 8Li sources, and is found to be 0.99850.0015 for neutrino events originated from the central 550 cm of the detector.
The high level cuts test the hypothesis that each event has the properties of electron Cherenkov light. The reconstruction figure-of-merit cuts test for the consistency between the time and angular expectations for an event fitted to the location of the reconstructed vertex and that based on the properties of Cherenkov light and the detector response.
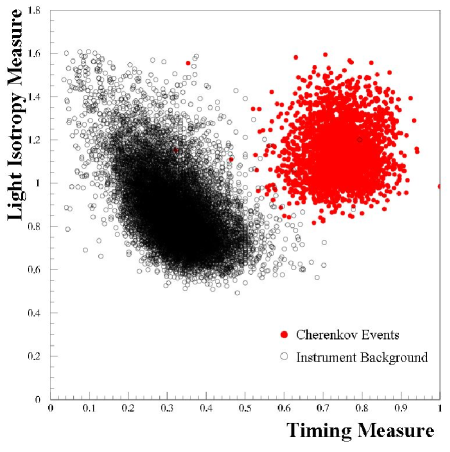
Two parameters are used to further characterize Cherenkov light. The average opening angle between two hit PMTs (), measured from the reconstructed vertex, is used to determine whether the topology of an event is consistent with Cherenkov light. The in-time ratio (ITR) is the ratio of the number of hit PMTs within an asymmetric time window around the prompt light peak to the number of calibrated PMTs in the event. Figure 4 shows the correlations between and ITR for instrumental backgrounds and Cherenkov light events. As shown in the figure, this two dimensional cut has very high instrumental background rejection efficiency.
The total signal loss from the Pass 0 and the high level cuts are calibrated with the 16N and the 8Li sources. Because of the difference in the energy spectrum and spatial distribution for CC, ES and NC events, there is a slight difference in the data loss due to the Cherenkov likelihood cut for the different detection channels. Table 2 summarizes the physics acceptance after the Pass-0, reconstruction and high level cuts for the three neutrino detection channels.
| Channel | Pass-0 | Reconstruction | High Level Cuts | Total |
|---|---|---|---|---|
| CC | 0.9966 | 0.99850.0015 | 0.99060.0005 | 0.9857 |
| ES | 0.9966 | 0.99850.0015 | 0.99030.0007 | 0.9854 |
| NC | 0.9966 | 0.99850.0015 | 0.98210.0011 | 0.9772 |
The residual instrumental background contamination in the neutrino signal after the series of instrument background cuts is estimated by a bifurcated analysis, in which the signal contamination is obtained from cross calibrating the background leakage of two groups of orthogonal cuts. For the same fiducial volume and energy threshold, the instrumental background contamination is estimated to be 3 events (95% C.L.), or 0.1% of the final neutrino candidate data set. Table 3 summarizes the sequence of cuts that are used to reduce the raw data to 2928 neutrino candidate events.
| Analysis step | Number of events |
|---|---|
| Total event triggers | 450 188 649 |
| Neutrino data triggers | 191 312 560 |
| PMT hit multiplicity (Nhits) 30 cut | 10 088 842 |
| Instrumental background (Pass 0) cuts | 7 805 238 |
| Cherenkov likelihood cuts | 3 418 439 |
| Fiducial volume cut | 67 343 |
| Energy threshold cut | 3 440 |
| Cosmic-induced background subtraction | 2 928 |
| Total events | 2 928 |
3.2 Reconstruction and Energy Calibration
After all the instrumental background cuts have been applied to the data, energy and fiducial volume cuts are employed to reduce the physics backgrounds in the neutrino candidate data set. These physics backgrounds include low energy backgrounds from radioactive decays in the natural 238U and 232Th chains, and other backgrounds induced by cosmic rays. Because of progressively lower radioactivity towards the central region of the detector, one can place a fiducial volume cut and an energy threshold sufficiently high that most of the low energy backgrounds are removed from the neutrino candidate data set. These cuts rely upon event reconstruction and detector energy calibration, which we will discuss in the following.
3.2.1 Reconstruction
The calibrated times and positions of the fired PMTs are used to reconstruct the vertex position and the direction of the particle. Two different reconstruction algorithms were developed. An event-by-event comparison shows excellent agreement between the data sets reconstructed by these two algorithms. The neutrino data presented in this paper are reconstructed using a maximum likelihood technique which uses both the time and angular characteristics of Cherenkov light. Vertex reconstruction accuracy and resolution for electrons are measured using Compton electrons from the 16N -ray source, and their energy dependence is verified by the 8Li source. Compton scattered electrons from a 6.13-MeV ray are preferentially scattered in the forward direction relative to the incident -ray direction. Thus they provide information about the accuracy of the direction reconstruction. In order to minimize the effect of finite vertex resolution on this angular resolution measurement, only 16N events that are reconstructed to more than 150 cm from the source are used in the measurement. At the 16N energy (5.5 MeV total electron energy), the vertex reconstruction resolution is 16 cm and the angular resolution is 26.7∘. Reconstruction-related systematic uncertainties to the solar neutrino flux measurement are % for the CC channel and % for the NC channel.
3.2.2 Energy Estimator
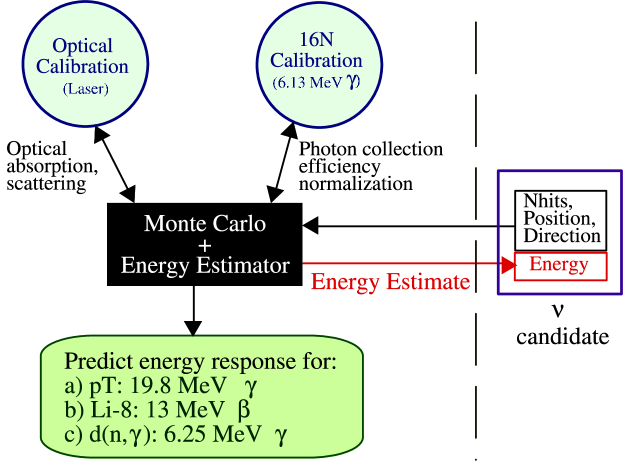
Figure 5 shows the relationship between the detector calibration program and event-by-event energy estimation in the analysis. Optical calibration is obtained using a near-isotropic source of pulsed laser light [17, 18] at 337, 365, 386, 420, 500 and 620 nm. The light source is deployed to locations accessible by the source manipulator system on two orthogonal planes in the D2O, and on a linear grid in the H2O. Optical parameters of different optical media in the detector are obtained at these wavelengths [19]. The attenuation lengths in D2O and H2O are found to be near the Rayleigh scattering limit. These optical parameters are inputs to the Monte Carlo/energy estimator engine.
The triggered 16N source is used to provide the absolute energy calibration. The detector energy response to the photopeak of this source provides a normalization to the PMT photon collection efficiency used in the Monte Carlo, and establish the absolute energy calibration. A long-term stability study of the detector response to the 16N source shows a linear drift of 1.3% year-1. The cause of this effect is under investigation, and a drift correction is applied to the event-by-event energy estimator.
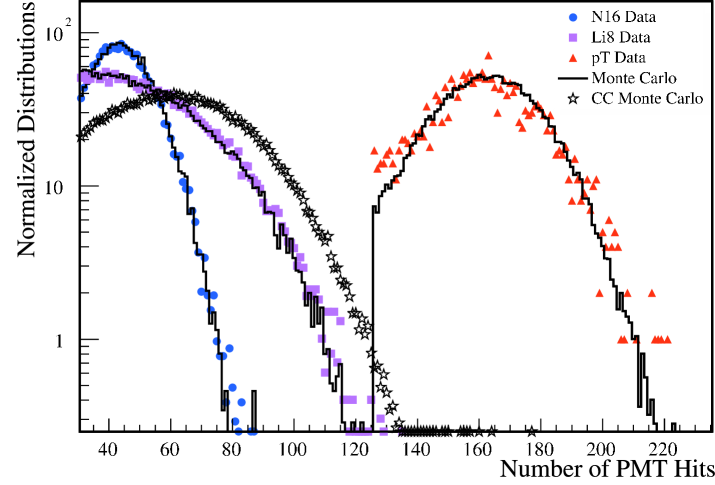
This tuned Monte Carlo is then used to make predictions for the energy response to different calibration sources. The pT source generates 19.8-MeV rays through the 3H(p,)4He reaction [20], and is used to check the linearity of the energy response beyond the endpoint of the 8B neutrino energy spectrum. To probe the regions that are inaccessible to the calibration source deployment system, the 252Cf fission neutron source provides an extended distribution of 6.25-MeV rays from d(n,)t. Figure 6 shows a comparison of the Monte Carlo predictions and the detector responses to these sources.
The energy estimator uses the same input parameters (e.g. optical parameters) as the Monte Carlo. It assigns an effective kinetic energy to each event based upon its position, direction and the number of hit PMTs within the prompt (unscattered) photon peak. For an electron of total energy , the derived detector energy response can be parameterized by a Gaussian:
where =+, and the energy resolution is given by
The systematic uncertainty on this absolute energy calibration is found to be 1.2%, which results in neutrino flux uncertainties of % for the CC channel and % for the NC channel. This is the most significant systematic uncertainty in the flux measurement. Other energy related systematic uncertainties to the flux include the energy resolution and the energy scale linearity. A summary of the systematic uncertainties can be found in Table 7.
A second energy estimator using Nhits is employed for validation purposes. These two energy estimators give consistent results in the neutrino flux measurement.
3.3 Neutron Efficiency
For the NC measurement of the solar neutrino flux, the probability that a neutron produced in the NC interaction will capture on deuterium and the detection efficiency of the 6.25-MeV ray emitted following the neutron capture have to be determined. The capture probability depends on the isotopic abundances of various nuclei in the heavy water and the relevant capture cross sections for each. Near the boundary of the AV, the capture cross sections for neutrons in acrylic and light water become important as well. The detection efficiency of the 6.25-MeV ray can be readily deduced from the 16N calibration data, since the latter produces predominantly 6.13-MeV rays.
Three different methods are used to calibrate the capture efficiency: a method which directly counts the number of neutrons measured with a 252Cf source and compares to source expectations, a purely analytic calculation compared to Monte Carlo, and a multiplicity measurement which extracts the efficiency statistically from the distribution of the number of detected neutrons per fission.
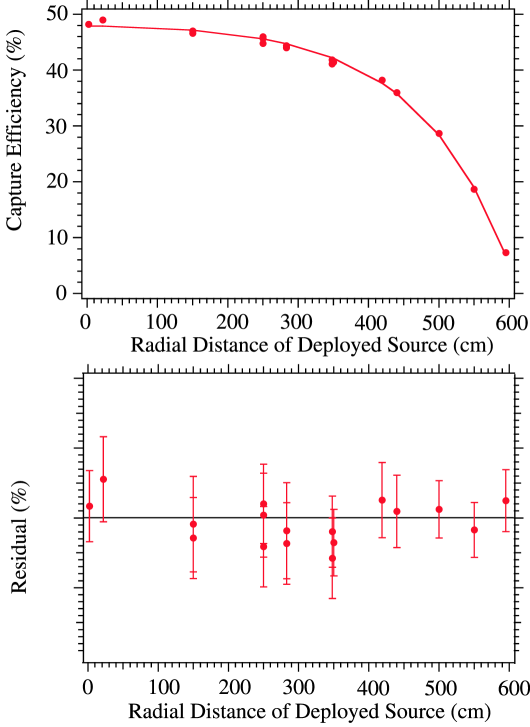
The primary approach to measuring the capture efficiency is the “direct counting” method, in which the number of neutrons detected during a source run is compared to the total number expected to be generated by the source based on the known decay rate. This analysis was performed on 252Cf source data taken at various locations in the detector. Because the 252Cf source is not a triggered source, non-neutron backgrounds associated with the source and the detector were handled using reconstruction and instrumental background cuts, with a proper accounting of the associated acceptance of these cuts in the efficiency measurement. In Figure 7 the neutron capture efficiency on deuterium as a function of radial distance from the center of the detector is shown. The capture efficiency on deuterium for NC events is found to be %, and when the fiducial volume cut of 550 cm and energy threshold cut of MeV are included, the overall detection efficiency is %. The uncertainties on these numbers contribute a relative uncertainty of 3.68% in the extraction of the NC signal in the present analysis.
The analytic calculation uses known cross sections and isotopic abundances of the D2O to calculate the expected efficiency, and propagates uncertainties on the microscopic parameters through the entire calculation. The largest uncertainties in the analytic model are on the fraction of H2O in the heavy water, the capture cross sections on deuterium and 16O, and the diffusion parameter which governs the total number of neutrons escaping the D2O volume. For the NC signal, the total uncertainty determined in this way is 3%.
The third approach is provided primarily as a check because of its limited sensitivity. In this approach the multiplicity distribution of detected neutrons is fit with the expression
where is the probability to detect neutrons per unit time given that neutrons were generated according to Poisson statistics for the 252Cf fission rate and the known 252Cf multiplicity per fission (mean and width ). In this case, both the source fission rate and the neutron detection efficiency are derived from a maximum likelihood fit. The results from this approach and the direct counting approach are consistent.
3.4 Low Energy Backgrounds
Low levels of 232Th and 238U can be found naturally in all materials. The SNO detector has been designed with very stringent radiopurity targets for different components in the detector. Table 4 lists the 232Th and 238U target levels for the D2O, acrylic vessel (AV), and H2O. At these radiopurity levels, the background to the NC signal is approximately 10% of the NC signal predicted by the Standard Solar Model.
| Component | 232Th | 238U |
| (g/g) | (g/g) | |
| D2O | 3.710-15 | 4.510-14 |
| H2O | 3.710-14 | 4.510-13 |
| AV | 1.910-12 | 3.610-12 |
Radioactive decays of the daughters in the natural 232Th and 238U chains are the dominant backgrounds in the neutrino signal window. These decays can contribute to the backgrounds in two different ways.
A ray with energy in excess of the binding energy of the deuteron (=2.2 MeV) can potentially photodisintegrate a deuteron:
The free neutron in the final state is indistinguishable from that in the NC signature. In the natural 232Th and the 238U chains, rays that can photodisintegrate the deuterons are emitted in the decays of 208Tl and 214Bi. To measure the contribution of this photodisintegration background to the NC signal, it is necessary to determine the concentration of the different isotopes in the detector. “Ex-situ” radiochemical assays and ”in-situ” Cherenkov light pattern recognition techniques are used to measure the contribution from this photodisintegration background.
A small fraction of decays with large values (e.g. 208Tl from the 232Th chain and 214Bi from the 238U chain) inside the fiducial volume might generate enough light in the detector and register a calibrated energy above the analysis threshold. Decays that are originated from outside the fiducial volume might get reconstructed to within the fiducial volume due to finite reconstruction resolution. Low energy radioactive sources and simulations are used to understand this class of Cherenkov tail backgrounds.
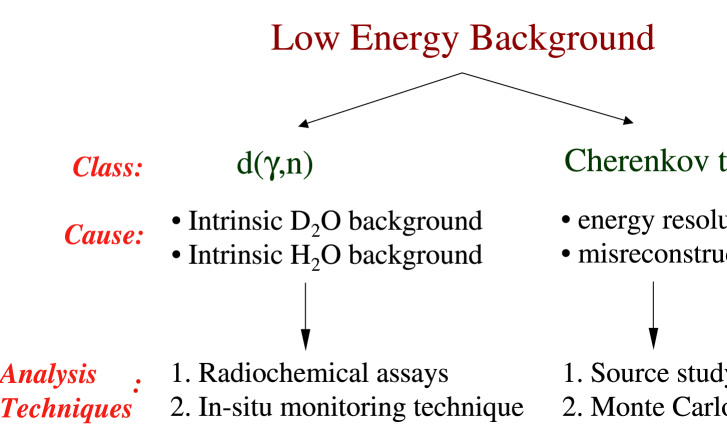
Figure 8 shows the general strategy of the low energy background analysis. In the following, we shall discuss the analysis techniques mentioned above in more details.
3.4.1 Photodisintegration Background
D2O and H2O Radioactivity
Several techniques were developed to measure the 232Th and 238U concentration in the D2O and the H2O. These techniques sample different daughters in the 232Th and 238U chains, and can be broadly classified into two categories:
-
•
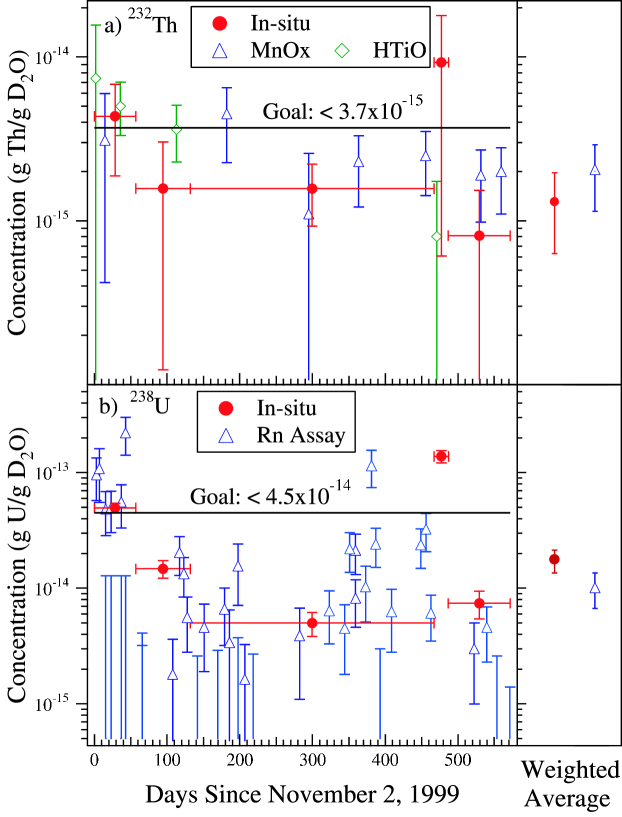
Ex-situ: These are techniques that involve chemical removal of radioisotopes from the D2O and the H2O, and their decays are counted in a system external to the SNO detector. These techniques include the extraction of Ra isotopes using MnO beads (the “MnO” technique [22]), and the extraction of Ra, Th and Pb isotopes using HTiO membranes (the “HTiO” technique [23]). Typical assays circulated approximately 400 tonnes of water through the extraction media. These techniques provide isotopic identification of the decay daughters and contamination levels in the assayed water volumes, presented in Fig. 10 (a). Secular equilibrium in the 238U decay chain is broken by the ingress of long-lived (3.8 day half-life) 222Rn in the experiment. Measurements of this background are made by periodically extracting and cryogenically concentrating 222Rn from the 238U chain (the “Rn assay” [24]). The Rn results are presented (as mass fractions in g(U)/g(D2O)) in Fig. 10(b).
The MnO Technique
In the MnO technique, D2O or H2O is passed through polypropylene columns that contain beads coated with a manganese oxide compound (MnO), which extracts Ra from the flowing water. After a large volume of water has passed through the columns, they are removed and dried. The dried column is then attached to a gas flow loop on an electrostatic counter (ESC). The Rn produced from Ra decay is swept from the columns into the ESC where it decays. The charged Po ions from the decay of Rn are carried by the electric field onto an counter where the decays of the Po are detected, and their energy spectra are collected. For the 232Th chain, the relevant Po decays are 216Po (6.8 MeV ) and 212Po (8.8 MeV ), whereas the relevant ones for the U chain are 218Po (6.0 MeV ) and 214Po (7.7 MeV ).
The HTiO Technique
In this technique, D2O or H2O is passed through hydrous titanium oxide (HTiO) trapped on filtration fibers. The HTiO ion-exchanger is first deposited onto a microfiltration membrane. Then the columns containing the loaded filters are used to extract 224Ra from the Th chain and 226Ra from the U chain from a large volume of D2O or H2O. After extraction, Ra is eluted with nitric acid, and subsequently concentrated down to 10 m of eluate. This is then mixed with liquid scintillator and counted using delayed coincidence counters [27]. For the 232Th chain, the coincidences of the -decay of 212Bi and the -decay of 212Po are counted, whereas the coincidences of the -decay of 214Bi and the -decay of 214Po are counted for the 238U chain.
Rn Assays
Measurements of 226Ra concentration in the D2O and the H2O in the MnO and the HTiO techniques are not sufficient to determine the total radioactive background from the 238U chain. This is because even a small leak of the underground laboratory air (3 pCi/ of 222Rn) can lead to significant disequilibrium between 226Ra and 214Bi. The Rn assay technique was developed to tackle this problem. In this technique, water drawn from discrete sample points in the detector is flowed through a degasser to liberate Rn. The Rn is purified and collected in a cryogenic collector. The subsequent decays are counted in a Lucas cell scintillator (ZnS) chamber on a 2.54-cm diameter photomultiplier tube. Since there is a delay of many 220Rn lifetimes between the preparation of the Lucas cells and their subsequent counting, this method is sensitive only to 222Rn decays.
-
•
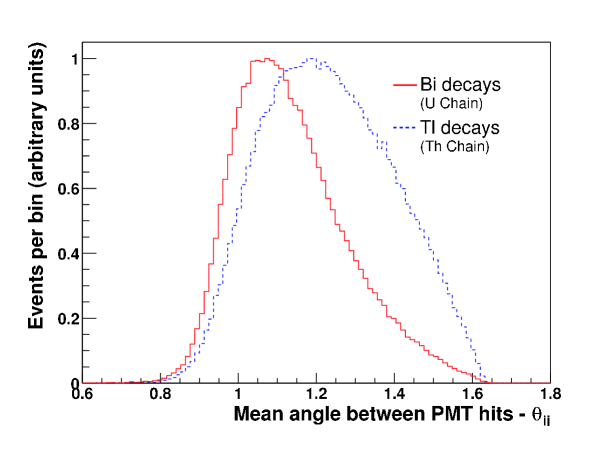
In-situ: This is a technique that uses pattern recognition on the Cherenkov light distribution to determine the concentration of 232Th and 238U in the D2O and the H2O [25, 26]. The 208Tl decay (from the 232Th chain) has a value of 4.9 MeV, and the 214Bi decay (from the 238U chain) has a value of 3.27 MeV. Almost every 208Tl decay emits a 2.614 MeV , several low energy ’s and a with an endpoint of 1-1.8 MeV, whereas there is a unique branch in the 214Bi decay that produces a single with an endpoint energy of 3.27 MeV. A single particle produces more Cherenkov photons than multiple particles with the same total energy because of the Cherenkov kinetic threshold. Also the light isotropy is different for these two cases because multiple particles generate a more isotropic light pattern (multiple Cherenkov cones), whereas a single particle gives a more directional light distribution due to light emission within a single Cherenkov cone. Therefore, by selecting a set of energy and fiducial volume cuts, it is possible to separate 208Tl and 214Bi decays statistically by their differences in light isotropy. The light isotropy parameter that has been developed () is the average angle between all hit PMT pairs within the prompt light time window in an event. Figure 9 shows the difference in between 208Tl and 214Bi decays. In this in-situ analysis, Cherenkov events fitted within 450 cm from the detector center and extracted from the neutrino data set provide a time-integrated measure of these backgrounds over the same time period of the neutrino analysis. Statistical separation of the 208Tl and 214Bi events is obtained by a maximum likelihood fit of the Cherenkov signal isotropy.
Results from the ex situ and in situ methods are consistent with each other as shown on the right hand side of Figs. 10(a) and 10(b). For the 232Th chain, the weighted mean (including additional sampling systematic uncertainty) of the two determinations is used for the background analysis. The 238U chain activity is dominated by Rn ingress which is highly time dependent. Therefore the in situ determination was used for this activity as it provides the appropriate time weighting. For the present data set, the time-averaged equivalent equilibrium 238U and 232Th concentration in the D2O are found to be
Once the 232Th and 238U concentrations are measured, the photodisintegration background can be determined through Monte Carlo calculations that use the photodisintegration cross section, properties of -ray and neutron transport, and the detector response function as inputs. The expected number of observed photodisintegration neutrons are 18.46.5 counts for the 232Th background and 25.9 counts for the 238U background in the pure D2O phase of the experiment.
Daughters in the 232Th and 238U chain in the H2O and the acrylic vessel (AV) can still produce a photodisintegration background. This happens when the ’s with an energy 2.2 MeV enter the D2O volume and photodisintegrate a deuteron. Ex situ assays and in situ pattern recognition techniques described above were used to measure the 232Th and 238U concentrations in the H2O. The photodisintegration background inside the fiducial volume due to radioactivity in the H2O was then determined. The time-averaged equivalent equilibrium 238U and 232Th concentration in the H2O are found to be
At these concentrations, the number of observed photodisintegration neutrons in the fiducial volume are determined to be 5.6 counts for the 232Th chain and 5.6 counts for the 238U chain.
Acrylic Vessel Radioactivity
Prior to the construction of the acrylic vessel, neutron activation analyses were done on samples of the acrylic panels used in the vessel. These results, along with that of a dust density measurement on the vessel subsequent to its construction, indicate that the radioactive load of the acrylic vessel to be 7.5 g of 232Th and 1515 g of 238U. Studies of the Cherenkov data revealed a radioactive hotspot on the acrylic vessel. The radioactivity of this hotspot is equivalent to 10 g of 232Th. Combining the results from radioassays and the hotspot analysis, the expected number of observed photodisintegration background events due to radioactivity in the acrylic vessel is 15.8 counts.
Table 5 is a summary of the photodisintegration background for the data set used in this analysis. In this table, we have also listed the contributions from other sources of neutron backgrounds. Some of these are cosmic ray events and atmospheric neutrinos. To reduce these backgrounds, an additional neutron background cut imposed a 250-ms veto (in software) following every event in which the total number of PMTs which registered a hit was greater than 60. The contribution from these additional sources are very small compared to the photodisintegration background.
| 232Th | 238U | Total | |
| (counts) | (counts) | ||
| D2O photodisintegration | 18.46.5 | 25.9 | 44.3 |
| AV photodisintegration | 14.2 | 1.61.6 | 15.8 |
| H2O photodisintegration | 5.6 | 5.6 | 11.2 |
| Atmospheric ’s and | |||
| sub-Cherenkov threshold ’s | Not applicable | ||
| Spontaneous Fission | Not applicable | ||
| 2H()pn | Not applicable | ||
| 17O(,n) | Not applicable | ||
| Terrestrial and reactor ’s | Not applicable | ||
| External neutrons | Not applicable | ||
| Total | |||
3.4.2 Cherenkov Tail Background
Low energy backgrounds from Cherenkov events in the neutrino signal region were evaluated by using acrylic encapsulated sources of U and Th deployed throughout the detector volume and by Monte Carlo calculations. In the following, we discuss how this class of background is determined for different origins of radioactivity.
Cherenkov Tail Background from D2O Radioactivity
The Cherenkov tail background arising from internal radioactivity in the D2O were determined by a Monte Carlo study. A Monte Carlo study is justified because the detector response in the D2O is well calibrated, and the internal radioactivity is well measured by the ex situ and in situ techniques. In this Monte Carlo calculation, the number of Cherenkov background events is normalized to the number of photodisintegration (pd) neutrons in the neutrino signal window and are found to be:
| 208Tl: | 0.162 Cherenkov tail event/pd neutron event |
| 214Bi: | 0.670 Cherenkov tail event/pd neutron event. |
Given the number of detected photodisintegration neutrons (Th: 18.46.5, U: 25.9), the expected Cherenkov tail backgrounds are:
| 232Th: | 3.0 counts |
|---|---|
| 238U: | 17.4 counts |
| Total: | 20.4 counts. |
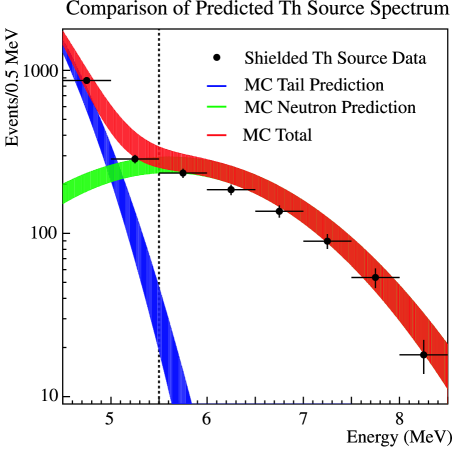
As a consistency check, this Monte Carlo technique was used to make predictions on the energy spectrum of a variety of background sources, including a stainless-steel encapsulated Th source and a Rn spike in the detector during a water circulation pump failure. Figure 11 compares the predicted energy spectrum for the stainless-steel encapsulated Th source run to the actual calibration source data.
Cherenkov Tail Background from External Radioactivity
In principle, one can perform Monte Carlo calculations to predict the Cherenkov tail background in the fiducial volume for radioactivity from the acrylic vessel, the H2O and the PMT support geodesic. However, most of the events in the neutrino signal window with origins in the regions external to the fiducial volume come from the tail of the energy response and the reconstruction response functions. These response functions are not as well understood outside the fiducial volume.
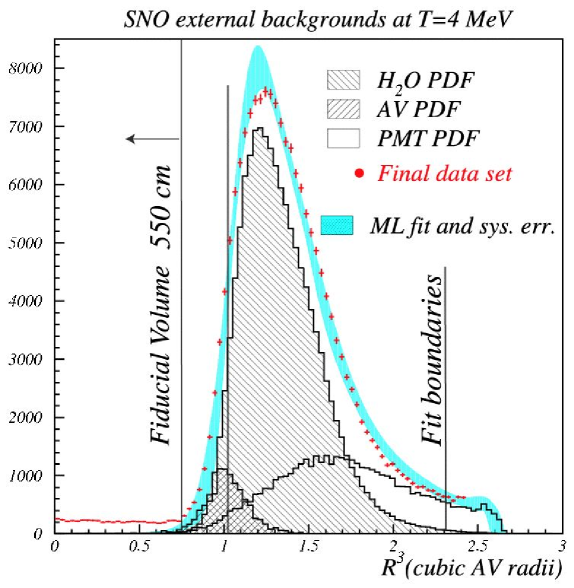
A technique was developed to determine this external (acrylic vessel, H2O and PMT support geodesic) Cherenkov tail backgrounds in the neutrino signal window using the low energy background radial distribution () calibrated by low energy acrylic encapsulated sources. The principle of this technique is to use the acrylic source data to generate the probability distribution functions (PDFs) for the low energy backgrounds in the AV, H2O and the PMT regions. The distribution in these regions in the neutrino data was then fitted to a linear combination of these PDFs by the extended maximum likelihood method. One difficulty of this technique is the lack of sufficient statistics at the intended neutrino analysis threshold (=5 MeV). In order to overcome this, the analysis was proceeded at a lower energy (=4 MeV) and then extrapolated to 5 MeV. The basic assumptions here are that there is no correlation between and energy, and that the reconstruction does not get worse with higher energy. The fit was performed for the range . Figure 12 shows the results of this fit. The band shown in this plot is the range of the systematic uncertainties. The data points are not centered in this band because the systematic uncertainties are not normally distributed. Table 5 is a summary of the Cherenkov tail background (5 MeV) in the fiducial volume (550 cm.) for the pure D2O phase of the experiment.
| 232Th | 238U | Total | |
| (counts) | (counts) | ||
| D2O | 3.0 | 17.4 | 20.4 |
| AV | Not applicable | 6.3 | |
| H2O | Not applicable | 2.8 | |
| PMT | Not applicable | 16.0 | |
| Total | Not applicable | 45.5 | |
Several consistency checks of this external Cherenkov tail analysis were performed. The radial PDF for H2O background was compared to the radial distribution of a radon spike during a water circulation pump failure. This is shown in Figure 13. The expected background rate in Table 6 was also checked against the Monte Carlo calculations and the results of a simultaneous fit of signals and backgrounds in Nhits, and angular correlation to the Sun. All these results are consistent.

3.5 Signal Extraction
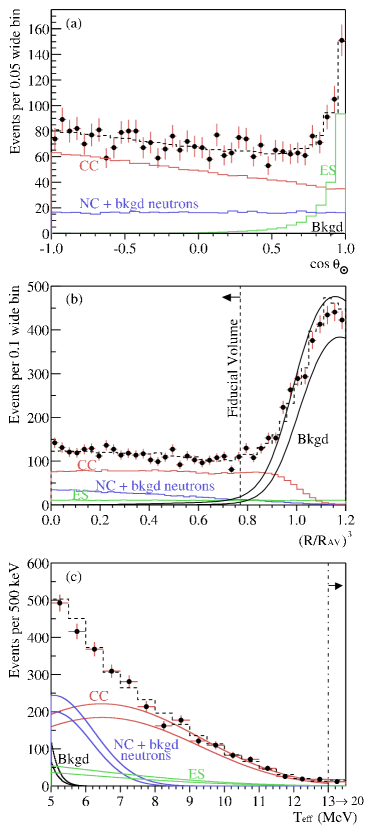
In order to test the null hypothesis, the assumption that there are only electron neutrinos in the solar neutrino flux, the extended maximum likelihood method is used in extracting the CC, ES and neutron (i.e. NC+background) contributions in the candidate data set. Background contributions are constrained to the measured values discussed above. The undistorted 8B spectrum from Ortiz et al. [28] is assumed in the signal decomposition. Data distributions in , the volume-weighted radial variable where cm is the radius of the acrylic vessel, and are simultaneously fitted to the probability density functions (PDFs) generated from Monte Carlo simulations. is the angle between the reconstructed direction of the event and the instantaneous direction from the Sun to the Earth. This distribution is shown in Figure 14(a) for the analysis threshold of MeV and fiducial volume selection of cm, where is the reconstructed event radius. The forward peak (1) arises from the strong directionality in the ES reaction. The distribution for the CC reaction, before accounting for the detector response, is expected to be (1-0.340) [29]. Fig. 14(b) shows the distribution of events in the volume-weighted radial variable , and Figure 14(c) shows the kinetic energy spectrum of the selected events.
The extraction yields CC events, ES events, and NC events ††††††We note that this rate of neutron events also leads to a lower bound on the proton lifetime for “invisible” modes (based on the free neutron that would be left in deuterium[30]) in excess of years, approximately 3 orders of magnitude more restrictive than previous limits[31]. The possible contribution of this mechanism to the solar neutrino NC background is ignored.. The uncertainties given above are statistical only, and the systematic uncertainties are summarized in Table 7. The extracted counts for each neutrino detection channel above can be converted into integrated fluxes above the kinetic energy threshold of 5 MeV. Assuming an undistorted 8B neutrino spectrum [28] and using only cross sections for , the measured neutrino fluxes from each of the channels are (in units of ):
The CC and ES results reported here are consistent with our earlier results [11] for 6.75 MeV. The excess of the NC flux over the CC and ES fluxes implies neutrino flavor transformations.
A direct test of the null hypothesis, i.e. there are only in the solar neutrino flux, can be readily performed with a simple change of variables:
where is the flux of the electron component, is the flux of non-electron component, and =0.1559 is the ratio of the elastic scattering cross sections for and above the kinetic threshold of 5 MeV. Assuming an undistorted 8B energy spectrum, a maximum likelihood extraction using these transformed variables gives the fluxes of the electron and non-electron components as:
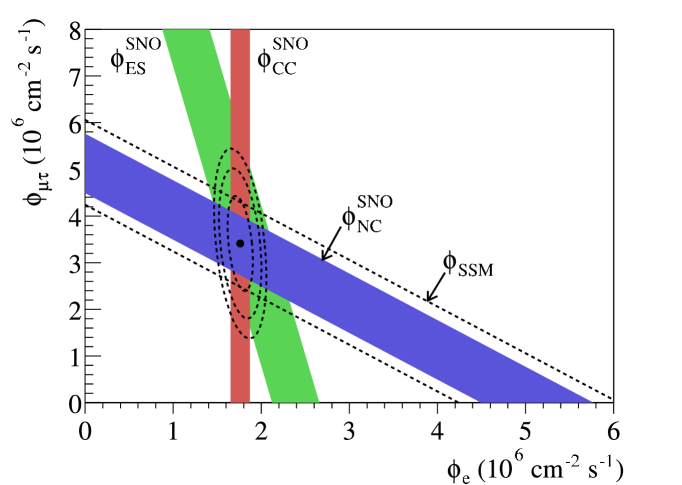
Combining the statistical and systematic uncertainties in quadrature, is , which is 5.3 above zero, and provides strong evidence for flavor transformation consistent with neutrino oscillations [32, 33]. Adding the Super-Kamiokande ES measurement of the 8B flux [6] as an additional constraint, we find , which is 5.5 above zero. Figure 15 shows the flux of non-electron flavor active neutrinos vs. the flux of electron neutrinos deduced from the SNO data. The three bands represent the one standard deviation measurements of the CC, ES, and NC rates. The error ellipses represent the 68%, 95%, and 99% joint probability contours for and .
Removing the constraint that the solar neutrino energy spectrum is undistorted, the signal decomposition is repeated using only the and information. The total flux of active 8B neutrinos measured with the NC reaction is
which is in agreement with the shape constrained value above and with the standard solar model prediction [7] for 8B ’s,
| Source | CC Uncert. | NC Uncert. | Uncert. |
|---|---|---|---|
| (percent) | (percent) | (percent) | |
| Energy scale | -4.2,+4.3 | -6.2,+6.1 | -10.4,+10.3 |
| Energy resolution | -0.9,+0.0 | -0.0,+4.4 | -0.0,+6.8 |
| Energy non-linearity | |||
| Vertex resolution | |||
| Vertex accuracy | -2.8,+2.9 | ||
| Angular resolution | -0.2,+0.2 | -0.3,+0.3 | -0.3,+0.3 |
| Internal source pd | -1.5,+1.6 | -2.0,+2.2 | |
| External source pd | -1.0,+1.0 | ||
| D2O Cherenkov | -0.1,+0.2 | -2.6,+1.2 | -3.7,+1.7 |
| H2O Cherenkov | -0.2,+0.4 | -0.2,+0.6 | |
| AV Cherenkov | -0.2,+0.2 | -0.3,+0.3 | |
| PMT Cherenkov | -2.1,+1.6 | -3.0,+2.2 | |
| Neutron capture | -4.0,+3.6 | -5.8,+5.2 | |
| Cut acceptance | -0.2,+0.4 | -0.2,+0.4 | -0.2,+0.4 |
| Experimental uncertainty | -5.2,+5.2 | -8.5,+9.1 | -13.2,+14.1 |
| Cross section [21] |
3.6 Day-Night Analysis
The solar neutrino flux results presented above provide strong evidence for neutrino flavor transformation independent of solar model predictions. One of the possible mechanism for this flavor transformation is mass-induced neutrino oscillations. For some values of the mixing parameters, spectral distortions and a measurable dependence on solar zenith angle are expected [34, 35, 36]. This solar zenith angle dependence might be caused by interaction with the matter of the Earth (the MSW effect) and would depend not only on oscillation parameters and neutrino energy, but also on the neutrino path length and density through the Earth.
To look for this distinctive signature of neutrino oscillation, a solar neutrino flux analysis similar to that described above was performed for two solar zenith angle bins: (“day”) and (“night”). During the development of this analysis, the data were partitioned into two sets of approximately equal livetime (split at July 1, 2000), each having substantial day and night components. Analysis procedures were refined during the analysis of Set 1 and fixed before Set 2 was analyzed with the same procedures. The latter thus served as an unbiased test. Unless otherwise stated, the analysis presented in the following is for the combined data set.
For each neutrino interaction channel, the asymmetry ratio () of the measured day flux () and night flux ():
was determined. Figure 16 shows the day and night energy spectrum for all the accepted events above the kinetic energy threshold of 5 MeV and inside the fiducial volume of the inner 550 cm. In the extraction of the neutrino fluxes, backgrounds were subtracted separately for the two zenith angle bins. The results were then corrected for the orbital eccentricity by normalizing to an Earth-Sun distance of 1 AU. Table 8 is a summary of these extractions, where the day and night fluxes are given for the combined data. A consistency test of the six measured fluxes between Sets 1 and 2 yielded a chance probability of 8%. A similar test done directly on the three asymmetry parameters gave a chance probability of 2%. No systematic has been identified, in either signal or background regions, that would suggest that the differences between Set 1 and Set 2 are other than a statistical fluctuation. For the combined analysis, is from zero, while and are and from zero, respectively. Note that and are strongly statistically anti-correlated (), while and () and and () are moderately anti-correlated. Table 9 gives the systematic uncertainties on the asymmetry parameters.

| Combined | |||
|---|---|---|---|
| signal | |||
| CC | |||
| ES | |||
| NC | |||
| Systematic | |||
|---|---|---|---|
| Long-term energy scale drift | 0.4 | 0.5 | 0.2 |
| Diurnal energy scale variation | 1.2 | 0.7 | 1.6 |
| Directional energy scale var. | 0.2 | 1.4 | 0.3 |
| Diurnal energy resolution var. | 0.1 | 0.1 | 0.3 |
| Directional energy resolution var. | 0.0 | 0.1 | 0.0 |
| Diurnal vertex shift var. | 0.5 | 0.6 | 0.7 |
| Directional vertex shift var. | 0.0 | 1.1 | 0.1 |
| Diurnal vertex resolution var. | 0.2 | 0.7 | 0.5 |
| Directional angular recon. var. | 0.0 | 0.1 | 0.1 |
| PMT - background | 0.0 | 0.2 | 0.5 |
| AV+H2O - background. | 0.0 | 0.6 | 0.2 |
| D2O -, neutrons background. | 0.1 | 0.4 | 1.2 |
| External neutrons background. | 0.0 | 0.2 | 0.4 |
| Cut acceptance | 0.5 | 0.5 | 0.5 |
| Total | 1.5 | 2.4 | 2.4 |
Systematic checks were made on a set of signals that are continuously present in the detector in order to look for any diurnal variation in the detector response. These studies include livetime verification using the detector diagnostic triggers (pulsed at 5 Hz), variation in the observed muon rate, variation in the detector response to the muon-induced secondary neutrons, variation in the detector response to the radioactive hotspot on the acrylic vessel, and a neutrino signal extraction based on an east-west division instead of a zenith angle division. These studies do not show any significant diurnal variation in the detector response. In the study of the diurnal variation of the radioactive hotspot, a limit of 3.5% on the rate asymmetry was determined. Because of its steeply falling energy spectrum, a 0.3% limit was set for the diurnal variation of the detector’s energy scale.
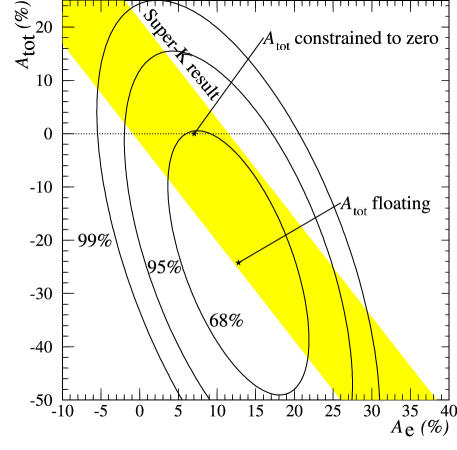
The asymmetry ratio in the flux and the total active neutrino flux can be readily determined by a change of variables in the signal extraction (see Sec. 3.5). Figure 17 shows the vs. joint probability contours. Forcing , as predicted by active-only models, yielded the result of .
4 Analysis of Neutrino Mixing Parameters
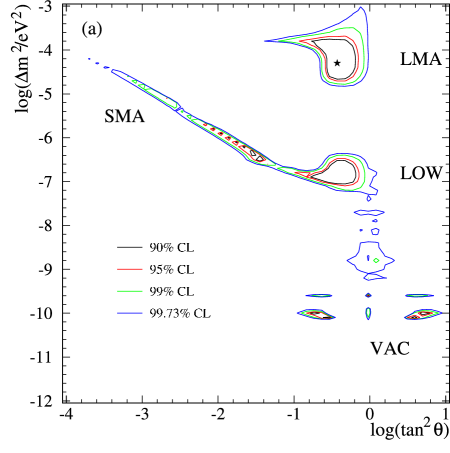
Using the day and night energy spectrum in Figure 16, an analysis to constrain the allowed MSW mixing parameters under the 2- flavor mixing framework was performed. The radial distribution and the solar angular correlation () information were omitted. The expected number of counts were calculated for each of the energy bins by convoluting the 8B neutrino spectrum [28], the MSW survival probability, the neutrino interaction cross sections and the energy response of the SNO detector. With the high energy neutrino flux fixed at cm-2 s-1 [7], the total 8B flux , the difference between the squared masses of the two neutrino mass eigenstates, and the mixing angle are the only free parameters in a fit of the MSW model to the observed data. Figure 18 shows the allowed regions in the - space at the 90%, 95%, 99% and 99.73% confidence levels.
Additional information from other solar neutrino experiments can be used in constructing the allowed - regions. In Figure 19, the solar neutrino fluxes measured by the Cl experiment [1] and the Ga experiments [3, 4, 5], along with the day and night neutrino energy spectra from the Super-Kamiokande experiment [6] are combined with the day and night energy spectra from SNO in a fit of the three free parameters (, and ). The , , 7Be and neutrino fluxes were fixed at their predicted values in the Standard Solar Model [7]. Table 10 summarizes the best fit points in the - plane. It is clear from this table and Figure 19 that this global analysis strongly favors the Large Mixing Angle (LMA) region, and excludes the region of 1.
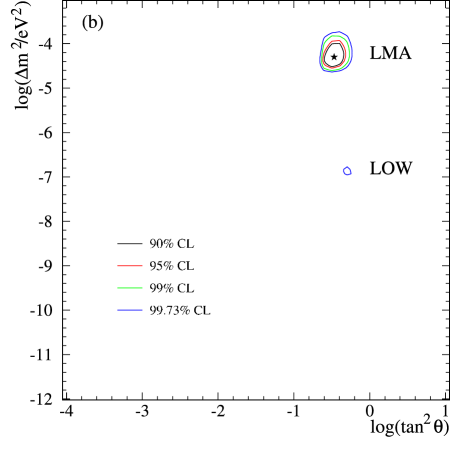
| Region | /dof | c.l.(%) | ||||
|---|---|---|---|---|---|---|
| LMA | 57.0/72 | 5.86 | 6.4 | 0.34 | — | |
| LOW | 67.7/72 | 4.95 | 5.9 | 0.55 | 99.5 |
5 Conclusions
The results that are presented in this paper are truly groundbreaking. The neutral-current measurement is the first direct measurement of the total active 8B neutrino flux. The neutrino fluxes measured by this channel provide strong evidence for neutrino flavor transformation, thereby solving the long-standing Solar Neutrino Problem. The significance of transforming into or is at 5.3 level. This neutral-current measurement also verified the Standard Solar Model prediction of the 8B neutrino flux.
The analysis presented in this paper is also the first direct measurement of the day-night asymmetries in the flux and the total neutrino flux. When combining the day and night energy spectra from SNO with results from other solar neutrino experiments in a global 2- flavor analysis of the MSW oscillation parameters, the LMA solution is strongly favored and the “dark side” (1) is excluded.
In the coming years, SNO will continue to make significant contributions to solar neutrino physics by refining the neutral-current measurement and the day-night asymmetry with different experimental techniques. It will also attempt to look for other possible signatures of neutrino oscillation (e.g. spectral distortion) and other rare processes (e.g. nucleon decays, anti-) in its future physics program.
6 Acknowledgements
This research was supported by the Natural Sciences and Engineering Research Council of Canada, Industry Canada, National Research Council of Canada, Northern Ontario Heritage Fund Corporation and the Province of Ontario, the United States Department of Energy and in the United Kingdom by the Science and Engineering Research Council and the Particle Physics and Astronomy Research Council. Further support was provided by INCO, Ltd., Atomic Energy of Canada Limited (AECL), Agra-Monenco, Canatom, Canadian Microelectronics Corporation, AT&T Microelectronics, Northern Telecom and British Nuclear Fuels, Ltd. The heavy water was loaned by AECL with the cooperation of Ontario Power Generation. We thank the SNO technical staff for their strong contributions.
References
- [1] B. T. Cleveland et al., Astrophys. J. 496, 505 (1998).
- [2] K.S. Hirata et al., Phys. Rev. Lett. 65, 1297 (1990); K.S. Hirata et al., Phys. Rev. D44, 2241 (1991); K.S. Hirata et al., Phys. Rev. D45, 2170E (1992); Y. Fukuda et al., Phys. Rev. Lett. 77, 1683 (1996). This is the combined results from Kamiokande II and III.
- [3] J.N. Abdurashitov et al., J.Exp.Theor.Phys. 95, 181 (2002); J.N. Abdurashitov et al., Zh.Eksp.Teor.Fiz. 122 211 (2002).
- [4] W. Hampel et al., Phys. Lett. B447, 127 (1999). This is the combined results from GALLEX I, II, III, and IV.
- [5] M. Altmann et al., Phys. Lett. B490, 16 (2000). This is the most recent published result. The GNO Collaboration provided update at the Neutrino 2002 conference: 65.46.5(stat.)3.0(sys.) SNU.
- [6] S. Fukuda et al., Phys. Rev. Lett. 86, 5651 (2001). Since the publication of our results, the Super-Kamiokande collaboration has published their latest results in S. Fukuda et al., Phys. Lett. B539, 179 (2002). The global neutrino analysis analysis presented in this paper used the results in the Super-Kamiokande results from 2001.
- [7] J.N. Bahcall, M.H. Pinsonneault, and S. Basu, astro-ph/0010346 v2 (2001).
- [8] A.S. Brun, S. Turck-Chièze, and J.P. Zahn, Astrophys. J. 525, 1032 (1999); S. Turck-Chièze et al., Ap. J. Lett., 555 (2001).
- [9] The SNO Collaboration, Nucl. Instr. and Meth. A449, 172 (2000).
- [10] H.H. Chen, Phys. Rev. Lett. 55, 1534 (1985).
- [11] Q.R. Ahmad et al. (the SNO Collaboration), Phys. Rev. Lett. 87, 071301 (2001).
- [12] Q.R. Ahmad et al. (the SNO Collaboration), Phys. Rev. Lett. 89, 011301 (2002).
- [13] Q.R. Ahmad et al. (the SNO Collaboration), Phys. Rev. Lett. 89, 011302 (2002).
- [14] M.C. Browne et al., IEEE Trans. on Nucl. Sci. 46, 873 (1999).
- [15] M.R. Dragowsky et al., Nucl. Instr. Meth. A481, 284 (2002).
- [16] N.J. Tagg et al., Nucl. Instr. Meth. A489, 178 (2002).
- [17] R.T. Ford, Nitrogen/Dye Laser System for the Optical Calibration of SNO, M.Sc. thesis, Queen’s University (1993).
- [18] R.T. Ford, Calibration of SNO for Detection of 8B Neutrinos, Ph.D. thesis, Queen’s University (1998).
- [19] B.A. Moffat, The Optical Calibration of the Sudbury Neutrino Observatory, Ph.D. thesis, Queen’s University (2001).
- [20] A.W.P. Poon et al., Nucl. Instr. and Meth. A449, 172 (2000).
- [21] Cross section uncertainty includes uncertainty (0.6%), difference between NSGK (S. Nakamura, T. Sato, V. Gudkov and K. Kubodera, Phys. Rev. C63 034617 (2001)) and BCK (M. Butler, J.-W. Chen and X. Kong, Phys. Rev. C63 035501 (2001)) in cross section calculations (0.6%), radiative correction uncertainties (0.3% for CC, 0.1% for NC, A. Kurylov, M. J. Ramsey-Musolf and P. Vogel, Phys. Rev. C65 055501(2002)), uncertainty associated with neglect of real photons in SNO (0.7% for CC), and theoretical cross section uncertainty (1%, S. Nakamura et al., arXiv:nucl-th/0201062, (to be published)).
- [22] T.C. Andersen et al., Measurement of Radium Concentration in Water with Mn-Coated Beads at the Sudbury Neutrino Observatory, nucl-ex/0208010, submitted to NIM for publication.
- [23] T.C. Andersen et al., A Radium Assay Technique Using Hydrous Titanium Oxide Adsorbent for the Sudbury Neutrino Observatory, nucl-ex/0208015, submitted to NIM for publication.
- [24] I. Levine et al., Measurement of 222Rn Dissolved in Water at the Sudbury Neutrino Observatory, to be submitted to NIM.
- [25] X. Chen, D.Phil. thesis, Oxford University (1997).
- [26] G. McGregor, D.Phil. thesis, Oxford University (2002).
- [27] R.K. Taplin, D.Phil. thesis, Oxford University (1998).
- [28] C.E. Ortiz et al., Phys. Rev. Lett. 85, 2909 (2000).
- [29] J.F. Beacom and P. Vogel, Phys. Rev. Lett. 83, 5222 (1999).
- [30] V.I. Tretyak and Yu.G. Zdesenko, Phys. Lett. B505, 59 (2001).
- [31] J. Evans and R. Steinberg, Science, 197, 989 (1977).
- [32] Z. Maki, N. Nakagawa, and S. Sakata, Prog. Theor. Phys., 28, 870 (1962).
- [33] V. Gribov and B. Pontecorvo, Phys. Lett. B28, 493 (1969).
- [34] S. P. Mikheyev and A. Y. Smirnov in ’86 Massive Neutrinos in Astrophysics and in Particle Physics, Proceedings of the Moriond Workshop, edited by O. Fackler and J. Tran Thanh Van, Editions Frontières, Gif-sur-Yvette, 1986, p. 335.
- [35] A. J. Baltz and J. Weneser, Phys. Rev. D37, 3364 (1988).
- [36] M. C. Gonzalez-Garcia, C. Peña-Garay and A. Y. Smirnov, Phys. Rev. D63, 113004 (2001).