Search for the Decay in the KTeV Experiment
The discovery in the KTeV experiment of the decay mode [1] later confirmed by KEK-E162 and CERN-NA48 [2] together with the observation of a large CP violating asymmetry [3] in the angular distribution between the and planes, has generated interest in searching for . This letter details the first attempt to detect this mode.
The decay can proceed at tree level via several amplitudes [4]. The main processes are a) the CP violating bremsstrahlung process in which the decays into where one of the pions radiates a photon which internally converts into an pair, and b) the CP conserving direct decay of the into a pair plus an M1 photon. Other smaller amplitudes include c) the CP violating direct decay of the into a plus an E1 photon and d) the “charge radius” amplitude describing the transition by emission of a virtual photon followed by the CP conserving decay . This process is similar to the regeneration of by scattering from atomic electrons, both of which are proportional to the mean squared charge radius of the neutral kaon. In contrast, the decay, because the pions are neutral, has no bremsstrahlung amplitude. In addition, the direct emission of a M1 photon or an E1 photon is suppressed since gauge invariance and Bose statistics require a angular momentum of [5].
A consequence of the suppression of the direct M1 and E1 emission processes and the absence of a bremsstrahlung process is that the branching ratio is expected to be considerably smaller [6] than the branching ratio measured to be [1]. The is predicted to be dominated by the CP conserving “charge radius” amplitude with additional contributions from the CP conserving E2 and CP violating M2 direct emission amplitudes. Theoretical estimates of the branching ratio vary considerably from a vector meson dominance model estimate of [7] and chiral perturbation theory calculations of [8] and [6].
An observation of would provide an indirect measurement of the branching ratio, a mode which is difficult to detect directly because of the serious backgrounds [9, 10]. Observation of this mode would also allow investigation of chiral perturbation theory contributions to O() and O(). The extra contributions of the full chiral perturbation calculations beyond that of the charge radius amplitude of Ref. [6] can complicate the extraction of this amplitude [6, 8, 11].
A search for the decay mode has been conducted by the KTeV collaboration using the 1997 E799 data set. In the E799 spectrometer configuration, two almost parallel neutral beams passed through the fiducial decay region of the KTeV spectrometer 95 m 158 m downstream of a BeO production target. The beams were produced by 800 GeV/c protons per minute delivered in 20 second spills incident at an angle of 4.8 mrad on a BeO target. The composition of the beams was mainly ’s and neutrons with a small admixture of ’s, and ’s. An integrated total of decays took place in the fiducial region while the trigger was live. The energies varied between 20 and 200 GeV with a mean of 70 GeV.
The KTeV spectrometer components which were used for the analysis of these decays consisted of four stations of drift chambers, two upstream and two downstream of an analysis magnet which provided a kick of 0.205 GeV/c for momentum determination of charged tracks. Downstream of the last drift chamber, in succession, were a charged particle trigger hodoscope which provided the first level trigger requirement of two charged tracks and a 3100 element pure CsI calorimeter for photon and electron id and energy determination. Surrounding the decay region and the elements of the detector were veto counters that detected charged and neutral particles that were not in the acceptance. The complete KTeV E799 spectrometer configuration is described in Ref. [1]
The data were collected with a trigger which required two charged tracks in the drift chambers, four or more showers with energies 1 GeV and total energy in the CsI calorimeter be greater than 30 GeV and no significant energy be present in any segment of the veto counters surrounding the decay volume and spectrometer elements.
Events were selected off line that had six energy clusters in the CsI, two of which were associated with the pair. The decay vertices were determined by minimizing the of a fit which included the differences between the invariant mass of the secondary particles from the decays ( or in the case of modes with ’s undergoing Dalitz decay as discussed below) and mass together with the distance between the vertex and the tracks. The incorporated the measured uncertainties of the energies and positions of the photon clusters in the CsI and the uncertainties of the track position due to the drift chamber resolutions and multiple scattering. The event reconstruction checked all possible pairings of the photons to determine the best combinations.
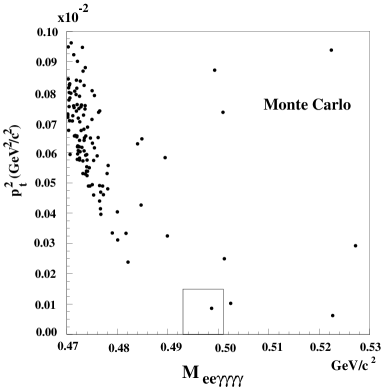
In addition, a large sample (where indicates a Dalitz decay, ) was selected from events which had an pair and five CsI clusters unassociated with tracks. The signal was compared to a Monte Carlo of this mode incorporating detector acceptances, efficiencies and resolutions. Good agreement was observed in numerous kinematic distributions. Using the detector simulation of the decays, a region of 0.493 GeV/c 0.501 GeV/c2 and GeV2/c2 was determined for the search. The signal region contained 86% of the decays (using the Sehgal model for our generated signal events). Here, was calculated relative to the vector from the center of the target to the decay vertex.
The most serious background to the mode resulted from decays in several ways: a) one photon from a decay converted internally or externally into an pair while one of the other photons in the decay fails to produce a detectable energy deposit in the CsI or missed the CsI and the remaining four photons formed a good pair; b) two of the six final state photons converted internally or externally into an pair and an and were lost; c) one of the decayed into an . In addition to the backgrounds from decays, decays with an extra accidental CsI energy cluster contributed a background. Finally, other backgrounds due to , , and decays were found to be negligible due to physics cuts discussed below and to small branching ratios.
Special cuts were required to eliminate each type of background. The background due to decays in which two photons converted into pairs or one of the ’s decayed into two pairs was suppressed by rejecting events in which there were extra track segments upstream or downstream of the magnet. If a photon converted externally in the upstream spectrometer material, the resulting did not typically produce two reconstructed upstream track segments due to the small opening angle. If one member of the pair had low momentum and was swept out of spectrometer acceptance by the analysis magnet, no extra track segments were produced downstream of the magnet either. In these cases, the invariant mass of the observed charged track and the other photon from the decay was close to the mass of the parent and the event was rejected by cutting on the mass. Specifically, the background from decays with two photons from different converting to pairs and no extra track segments in the spectrometer was suppressed by rejecting events with two mass combinations with 0.115 GeV/c GeV/c2 and the two remaining photons’ mass within 3 MeV/c2 of the mass.
The background due to decays where one photon converted into an pair and the other photon missed the calorimeter were rejected by calculating the missing photon energy and momentum assuming either 1) the missing photon went into the beam hole and had, in combination with the , the mass or 2) the missing photon came from a which had zero . If either, in the first case, 0.51 GeV/c2 and 0.0005 GeV2/c2 or, in the second case, the plus missing gamma mass was greater than 0.065 GeV/c2, the event was rejected.
To eliminate decays where one photon converted into an and the other photon was lost due to coalescing with another photon in the CsI, all observed clusters were tested to see if any cluster could be due to an overlap of two photons. The energy of each observed cluster in turn was divided in various proportions and the two resulting clusters were used in a fit of the event to the hypothesis. All possible combinations of all different clusters with different split fractions were combined with the other photons and the pair were considered to see if any combination was consistent with a event. If the invariant mass or the vertex of a combination was consistent with a decay, the event was rejected.
The background due to decays in which one decayed into an pair (BR()= [12]) was eliminated by requiring that GeV/c2. This cut also eliminated the background from a decay in which one of the ’s decayed into and one of the pairs had low energy and went undetected. The background due to decays with an accidental cluster in the calorimeter was eliminated by requiring that 0.45 GeV/c2. All combinations were checked and the mass cut was applied to the one with the smallest for a decay.
After these cuts, the major remaining background, as determined from Monte Carlo simulations, was due to decays. All other backgrounds were negligible. The contributions from all types of backgrounds are shown in Fig. 1 as a function of and for the equivalent of three E799 data sets after all cuts. One event is observed in the signal region and the backgrounds outside the signal region are similar in distribution and magnitude to the background observed in data when normalized to the E799 integrated flux. One event from the background Monte Carlo of three E799 data sets leads to an estimated background to the signal mode of events.
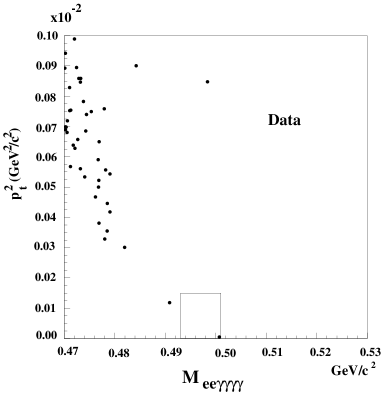
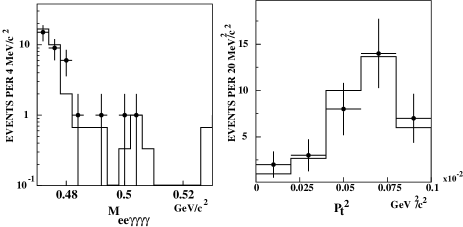
Using the vertex fit, the mass of Meeγγγγ and of the events from the triggers requiring two charged track and six cluster were calculated and the cuts mentioned above determined from Monte Carlo simulations of the signal and various backgrounds or from the data events were applied. Figure 2 shows the data remaining after applying the cuts. One event was observed in the signal box. Shown in Fig. 3 are the comparisons of the data and Monte Carlo simulations of the events vs. and .
An overall product of the acceptance and efficiency of 0.25% for the signal mode was obtained from a Monte Carlo simulation of mode using the model of Ref. [6] with a chiral perturbation parameter = 0.46 [8]. Since estimations of from exisiting experimental data are indirect and model dependent, we have studied the variation of our acceptance as a function of . We found that a simulation using a = 0.9 gives a minimum acceptance of 0.205% in the model of Ref. [6] (and a maximum upper limit for branching ratio). By comparison, a simulation using phase space for the decay gave an acceptance of 0.29%. We have used the lower acceptance 0.205% for calculating the single event sensitivity using in determining a branching ratio upper limit.
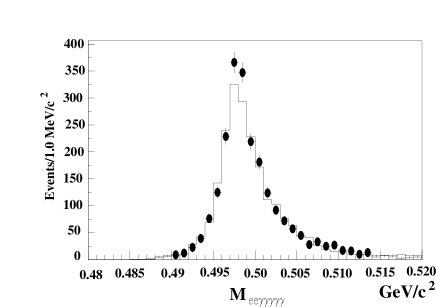
events with a missing down the beam hole (which could be reconstructed as using the technique for treating beam hole photons discussed above) were used as a normalization mode since they had the same trigger and analysis cuts as the signal mode. Figure 4 shows the mass distribution of these events compared to the Monte Carlo simulation. A distinct peak is reconstructed for the data with a resolution matching the simulation of this type of events. The disagreement between the level of data and Monte Carlo of the normalization events has been folded into the systematic error in the single event sensitivity.
A single event sensitivity of was calculated using the ratio of the signal efficiency to the normalization sample efficiency, the branching ratio of [13] and the observed 2234 normalization events of the type described in the previous paragraph. The observation of one event in the signal box resulted in an upper limit for BR() of at the 90% confidence level. Using the ratio of the BR to BR of 50 [6], our result is a factor of 10 more sensitive than the present upper limit of from a direct search [10] for .
In conclusion, we have made the first attempt to detect the decay mode. We have established an upper limit of at the 90% confidence level (using a = 0.9 in the model of Ref. [6]) which excludes the vector dominance model of Ref. [7] but does not quite reach the level of expected branching ratios predicted by the more recent models of Refs. [6, 8].
We gratefully acknowledge the support and effort of the Fermilab staff and the technical staffs of the participating institutions for their vital contributions. This work was supported in part by the U.S. Department of Energy, The National Science Foundation and The Ministry of Education and Science of Japan.
† To whom correspondence should be addressed.
∗ Permanent address C.P.P. Marseille/C.N.R.S., France
∗∗Permanent address Univ. of São Paulo, São Paulo, Brazil
REFERENCES
- [1] J.Adams et al., Phys. Rev. Lett. 80, 4123(1998).
- [2] E.Mazzucato, Nucl. Phys. B (Proc. Suppl.) 99B, 81(2001); Y. Takeuchi et al., Phys. Lett.B443, 409(1998).
- [3] A. Alavi-Harati et al., Phys. Rev. Lett. 84, 408(2000);
- [4] L.M. Sehgal and M. Wanninger, Phys. Rev. D 46, 1035(1992); 46, 5209(E) (1992); P. Heiliger and and L.M. Sehgal, Phys. Rev. D 48, 4146(1993); 60, 079902(E) (1999).
- [5] T.D. Lee and C.S. Wu, Annu. Rev. Nucl. Sci. 16, 511(1966).
- [6] P. Heiliger and L.M. Sehgal, Phys. Lett. B307, 182(1993).
- [7] D.P. Majumdar and J. Smith, Phys. Rev. 187, 2039(1969).
- [8] R. Funck and J. Kambor, Nucl. Phys. B396, 53(1993).
- [9] D. Roberts et al., Phys. Rev. D 50, 1874(1994).
- [10] G.D. Barr et al., Phys. Lett. B328, 528(1994).
- [11] J.K. Elwood, M. B. Wise,and M.J. Savage, Phys. Rev. D 52, 5095(1995).
- [12] A. Alavi-Harati et al., Phys. Rev. Lett. 83, 922(1999).
- [13] Particle Data Group, D. Groom et al., Eur. Phys. J C 15, 1(2000).