W Boson Cross Section and Decay Properties at the Tevatron
Abstract
We present the first measurements of and at = 1.96 TeV, along with new measurements of angular-decay distributions in collisions at = 1.8 TeV.
1 production cross sections
and boson production cross-section measurements in collisions are a test of the consistency of Standard-Model couplings, constrain proton parton distribution functions, and provide information on higher-order QCD corrections. They also test the mettle of an experiment, as the measurements require good understanding of detection efficiencies, backgrounds, and luminosity. If experimental uncertainties are small, and the cross sections can be well-estimated from theory, the boson production rates can be interpreted as a measure of luminosity, and can also be used to normalize measurements of other production cross sections. Finally, and bosons provide a path to the physics of Run II at the Tevatron, where many signatures of top-quark and Higgs-boson production can include these bosons.
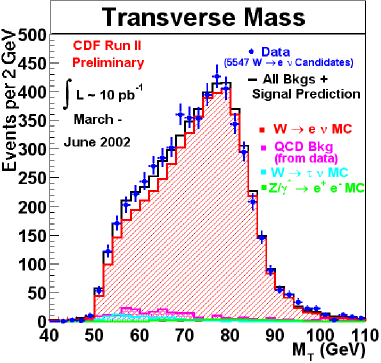
At the Tevatron, protons and antiprotons collide at a center-of-mass energy of 1.96 TeV. A boson appears in the detector as a high-momentum lepton and large missing energy due to the undetected neutrino. As the component of is unmeasured, all quantites are measured in the transverse plane. A boson appears as two high-momentum opposite-signed leptons with an invariant mass around 90 GeV. The cross section can be expressed as
| (1) |
where is the number of observed boson events, is the estimated number of background events, is the kinematic and geometric acceptance, is the total efficiency, and is the integrated luminosity.
The lepton plus missing transverse-energy sample can be accounted for by , , , QCD jets (fake leptons), and (for muons) cosmic rays, as illustrated in Figure 1. CDF measures the cross section in the electron and muon decay channels, and D0 does so in the electron channel. (CDF also looks at monojet events with large missing energy, and sees an enhancement in the number of jets with one and three charged tracks, evidence for decays.) The inputs and results for the cross-section measurements are given in Table 1. The measurements are systematics-limited, with the overall uncertainty typically dominated by the uncertainty in the integrated-luminosity measurement. The quoted uncertainty on the luminosity should be considered an upper limit.
| CDF | CDF | D0 | |
| 5547 | 4561 | 9205 | |
| 409 85 | 569 63 | 5782 357 | |
| (%) | 23.4 0.9 | 14.2 0.4 | 19.6 0.9 |
| (%) | 81.1 1.8 | 63.2 3.8 | 86.5 3.6 |
| (pb-1) | 10.4 1.0 | 16.5 1.6 | 7.5 0.8 |
| (nb) | 2.60 0.03stat | 2.70 0.04stat | 2.67 0.06stat |
| 0.13sys 0.26lum | 0.19sys 0.27lum | 0.33sys 0.27lum |
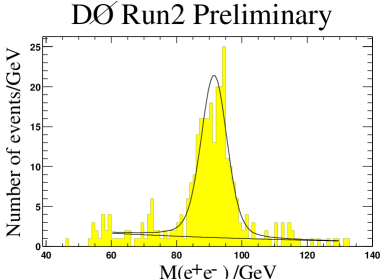
The dilepton samples are quite clean and allow for easy identification of the resonance, as seen in Figure 2. D0 measures , with the result shown in Table 2. From this and the cross-section measurement, D0 calculates the ratio of cross sections , also given in Table 2; CDF measures the same ratio in the muon channel. This ratio can be expressed as
| (2) |
Taking the total cross-section values and from theory, and the branching fraction from measurements at the pole, can be extracted. The D0 measurement gives GeV, and the CDF measurement of implies GeV. The current world average is GeV [1].
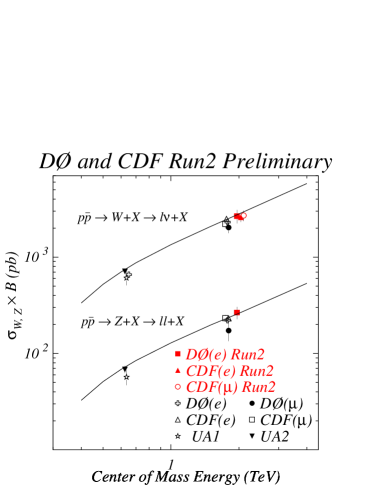
All of the CDF and D0 cross-section measurements are summarized in Table 2. For comparison, the best measurements of these quantities in Run I data are = 2.49 0.12 nb [2], = 249 11 pb [3], and = 10.90 0.43 [4]. The Run II measurements have not reached that level of precision, but they should with additional data. In addition, the and production cross sections at the Run II energy of 1.96 TeV are expected to be about 10% larger than those at the Run I energy of 1.8 TeV; theory predicts values of = 2.73 (2.50) nb and = 250 (230) pb at = 1.96 (1.8) TeV [5]. The measured values are consistent with this predicted rise, as illustrated in Figure 3.
| Quantity | Source | Value |
|---|---|---|
| (nb) | CDF | 2.60 0.03 0.13 0.26 |
| (nb) | CDF | 2.70 0.04 0.19 0.27 |
| (nb) | D0 | 2.67 0.06 0.33 0.27 |
| (pb) | D0 | 266 20 20 27 |
| D0 | 10.0 0.8 1.3 | |
| CDF | 13.7 |
2 -decay angular distributions
Understanding QCD effects in production helps reduce uncertainties in and other electroweak measurements. Without QCD, when the has no transverse momentum (), the differential cross section for the charged lepton in the decay is , as predicted by the interaction. But in NLO QCD, the differential cross section in the Collins-Soper rest frame is given as
| (3) | |||||
where the depend on and the boson rapidity; the latter is typically integrated out. (The , , and terms can be safely neglected.) Thus, angular distributions when probe the values of the , which can then be compared to predictions from NLO QCD. The D0 experiment has made a measurement of in Run I data[6], and CDF now has measurements of , and from Run I data.
The distribution of the decay leptons is obtained by integrating Equation 3 over :
| (4) |
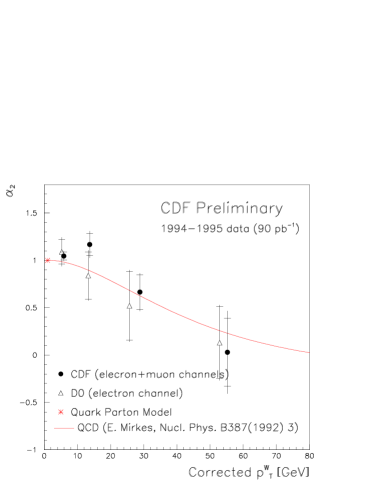
with , . There is no sensitivity to due to the unknown , but there is sensitivity to through the shape of the transverse-mass spectrum, which changes with . The Run I CDF sample is separated into four bins of , and in each one a maximum-likelihood fit to the spectrum is performed to extract , accounting for background contamination and detector acceptance. The results are shown in Figure 4, along with the earlier D0 results and the prediction from QCD. There is good agreement among all three; the decrease in with indicates increasing longitudinal polarization, as is expected. The CDF measurement is statistics-limited, with systematic uncertainties dominated by uncertainty in , , and the model of the recoil.
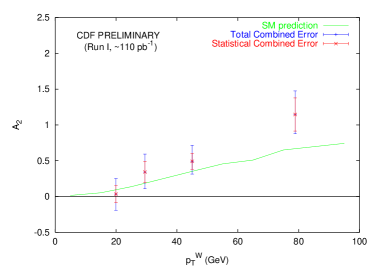
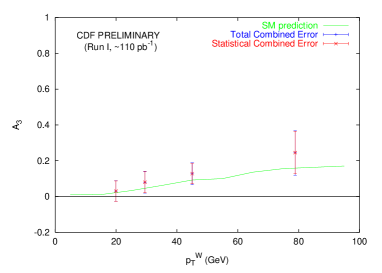
Similarly, one can integrate over in Equation 3 to obtain an expression that depends on . Measuring the distribution of the lepton from decay gives information on the and coefficients. Again, events from the Run I CDF sample are separated into four bins of ; the events are required to have at least one hadronic jet to ensure that . A maximum-likelihood fit to the distribution is performed to extract and . The results are shown in Figure 5, along with the prediction from QCD. As before, the experimental results are in agreement with the theory prediction. The measurement is systematics-limited, with the dominant uncertainties coming from the knowledge of and , and the renormalization and factorization scale. By contrast, the measurement is statistics-limited.
3 Summary
Run I at the Tevatron has produced a trove of knowledge about the and bosons, as evidenced by the new CDF measurement of the angular-decay distributions. These sophisticated analyses will be completed soon. The CDF and D0 collaborations are now turning their attention to the Run II data, and their and -based analyses are underway. Both experiments have established techniques to identify the bosons with high efficiency. They have a good understanding of the acceptances and efficiencies of their detector, and this understanding will improve as more data are collected. The cross-section measurements are consistent with the theory predictions and expectations from earlier measurements, and are already systematics-limited. Measurements of the cross section and tend to be statistics-limited, but that too will change as the datasets grow. This work provides a solid foundation for the studies of high- physics that are among the goals of Run II.
References
- [1] K. Hagiwara et al. (PDG), Phys. Rev. D66, 010001 (2002).
- [2] F. Abe et al. (CDF), Phys. Rev. Lett 76, 3070 (1996).
- [3] T. Affolder et al. (CDF), Phys. Rev. Lett 84, 245 (2000).
- [4] F. Abe et al. (CDF), Phys. Rev. D52, 2624 (1995).
- [5] W.J. Stirling, private communication.
- [6] B. Abbott et al. (D0), Phys. Lett. B513, 292 (2001).