Precise measurement of the positive muon anomalous magnetic moment
Abstract
A precise measurement of the anomalous value, , for the positive muon has been made at the Brookhaven Alternating Gradient Synchrotron. The result is in good agreement with previous measurements and has an error one third that of the combined previous data. The current theoretical value from the standard model is (SM) ppm) and in which is the world average experimental value.
PACS number: 14.60.Ef 13.40.Em
Precise measurement of the anomalous value, , of the muon provides a sensitive test of the standard model of particle physics and new information on speculative theories beyond it. Compared to the electron, the muon value is more sensitive to standard model extensions, typically by a factor of . In this Letter we report a measurement of for the positive muon from Brookhaven AGS experiment 821, based on data collected in 1999.
The principle of the experiment, previous results, and many experimental details have been given in earlier publications [1, 2]. Briefly, highly polarized of from a secondary beamline are injected through a superconducting inflector[3] into a storage ring in diameter with an effective circular aperture in diameter. The superferric storage ring[4] has a homogeneous magnetic field of , which is measured by an NMR system relative to the free proton NMR frequency[5, 6]. Electrostatic quadrupoles provide vertical focusing. A pulsed magnetic kicker gives a deflection which places the muons onto stored orbits. The muons start in ns bunches and debunch with a decay time of about s due to their momentum spread. Positrons are detected using 24 lead/scintillating fiber electromagnetic calorimeters[7] read out by waveform digitizers. The waveform digitizer and NMR clocks were phase-locked to the Loran C frequency signal.
The muon spin precesses faster than its momentum rotates by an angular frequency in the magnetic field weighted over the muon distribution in space and time. The quantity is
| (1) |
where is unaffected by the electrostatic field for muons with . Parity violation in the decay causes positrons to be emitted with an angular and energy asymmetry. Because of the Lorentz boost, the positron emission angle with respect to the muon spin direction in the muon rest frame is strongly coupled to its energy in the laboratory frame. The number of decay positrons with energy greater than is described by
| (2) |
in which the time dilated lifetime . Some periods of were observed.
Most experimental aspects of the data taking in 1999 were the same as in 1998[1]. However, some improvements were made. Care was taken in tuning the AGS ejection system to minimize background from any extraneous proton beam extracted during the muon storage time. Scintillating fiber detectors which could be moved in and out of the storage region were used to study beam properties. Scintillation counters in front of five calorimeters were used to measure muon losses from the storage ring.
The principal new feature of the 1999 run is the 20- fold increase in data collected. During a data acquisition time of 500 hours, we obtained about billion decay positrons with energies greater than . The AGS delivered protons of GeV in six bunches, separated by ms, over its s cycle. This resulted in stored muons per cycle.
The magnetic field is obtained from NMR measurements of the free proton resonance frequency . Seventeen NMR probes are mounted in an array on a trolley which moves on a fixed track inside the muon storage ring vacuum. The trolley probes are calibrated with respect to a standard spherical H2O probe to an accuracy of before and after data-taking periods. Interpolation of the field in the periods between trolley measurements, which are made on average every three days, is based on the readings of about 150 fixed NMR probes distributed around the ring in the top and bottom walls of the vacuum chamber. Figure 1 shows a magnetic field profile averaged over azimuth. The variations in the amplitudes of the multipoles affect by less than . The average readings of uniformly distributed fixed probes are maintained to by feedback to the main magnet power supply.

The T magnetic field of the superconducting inflector is well shielded from the storage region by flux trapping. However, over an azimuthal angle of , a residual fringe field reduces the storage ring central field by about , increasing to ppm at the edge of the aperture. This fringe field reduces the field homogeneity at large positive radial and negative vertical distances (Fig. 1).
The magnetic field is weighted with the muon distribution. Four thousand simulated muons were tracked for 100 turns through a field mapped by trolley measurements to evaluate the field muons encounter. The result agrees with measured with the trolley probes, averaged over the azimuth, and taken at the beam center.
Two largely independent analyses of ,
which is proportional to , were made
using different selections of NMR probes.
Their results agree to within .
The final value is
.
Table I lists the systematic errors.
TABLE I.: Systematic errors for the analysis
The frequency is obtained from the time distribution of decay counts. The are detected by calorimeters whose photomultiplier signals have a typical FWHM of ns. The signals are sampled every 2.5 ns by 8-bit waveform digitizers (WFD) with at least samples per event. The samples are used to determine times and energies, and for pulse overlap studies. The pulse-reconstruction algorithm fits signals above baseline to an average pulse shape, determined for each calorimeter individually. Multiple pulses can be resolved if their separation exceeds 3 to 5 ns. Systematic effects associated with the algorithm were extensively studied.
Whereas for the 1998 data, muon decay and spin precession (Eq. 2) was adequate to describe the time spectrum, the higher count rate and much larger data sample for 1999 required careful consideration of (1) pulses overlapping in time (pileup), (2) coherent betatron oscillations, (3) beam debunching, (4) muon losses, and (5) detector gain stability during the muon storage time.
(1) The number of pileup pulses in the reconstructed data is proportional to the instantaneous counting rate squared and to the minimum pulse separation time of the reconstruction algorithm. It amounts to 1% when the fits of to the data are started, and distorts the time spectrum because of misidentification of the number, energies, and times of the positrons. Since the phase (cf. Eq. 2) depends on the energies of the positrons, pileup has a phase which differs from leading to an error in . Therefore, the data are corrected prior to fitting by subtracting a constructed pileup spectrum. Positrons found within a window at a fixed time after the pulse that triggers the WFD are treated as if they overlap with the trigger pulse. The width of the window is taken equal to the minimum pulse separation time. Only data with energies at least twice the hardware threshold are fully corrected with this method. Our 1 GeV hardware threshold leads to a choice of GeV in the analysis.
The contribution to pileup from signals too small to be reconstructed is not accounted for by the procedure described above. These small signals distort the pulse reconstruction but do not, on average, affect the energy. However, such unseen pulses introduce small time-dependent shifts in and . The time dependence of the asymmetry, being more sensitive than the phase, is used to set a limit on the shift of .
Fig. 2 shows the agreement between the positron energy spectrum after pileup subtraction and the spectrum when pileup is negligible, together with the uncorrected spectrum. The inset illustrates that the average energy after pileup subtraction is constant with time, as expected. Without accounting for pileup, a shift in of ppm would result.

(2) The storage ring is a weak focusing spectrometer (field index ) with an aperture which is large compared to the inflector aperture. Therefore, the phase space for the betatron oscillations defined by the acceptance of the storage ring is not filled. In combination with imperfect injection angles and an imperfect horizontal injection kick, this results in betatron oscillations of the beam as a whole – coherent betatron oscillations (CBO). These oscillations are observed directly using the fiber monitors. They also modulate the positron time spectra, since the acceptance of a calorimeter depends on the muon decay positions. The dominant effect is due to the horizontal oscillations, which decay with a time constant of s.
(3) The cyclotron period of the bunched beam leads to a strong modulation of the decay positron time spectra which remains at s when we begin our fits. The modulation structure is eliminated from the time spectra by uniformly randomizing the start time for each detector and each storage fill over the range of one cyclotron period.
(4) Losses of muons during the data collection are minimized by controlled scraping[1] before the data collection is started. The magnitude and time-dependence of remaining losses are studied using coincident signals in the front scintillation counters of three adjacent calorimeters.
(5) Detector gain changes and time shifts are monitored with a pulsed laser system and also using the energy spectra. From s on, the gains of the detectors except two are stable to within 0.1% over 10 dilated muon lifetimes. The reconstructed times are stable to within ps over 200 s (0.1 ppm).
The raw WFD data were converted into energies and times using two independent implementations of the pulse reconstruction algorithm. Four independent analyses of were made. For simplicity of presentation one will be described and the principal differences of the others will be discussed.
The pileup corrected time spectrum for the sum of the detectors is fitted by the function,
| (3) |
Here, is the muon decay and precession function of Eq. 2 and is the coherent betatron oscillation function,
| (4) |
and is the muon loss term,
| (5) |
The quantities , , , and denote the CBO amplitude, time dependence, angular frequency, and phase, respectively, and and denote the fraction of lost muons and its time dependence. The CBO frequency is determined from a Fourier analysis of residuals in a fit of Eq. 2 to the data. The remaining 10 parameters in Eq. 3 are adjusted, in the sense of minimizing . The frequency correlates strongly only to . Consequently, is insensitive, unlike , to the values of the other 8 parameters and to the functional forms of and . Fig. 3 demonstrates the good agreement of data and fit, as indicated by for 3799 degrees of freedom (dof).
The internal consistency of the results was verified in several ways. As an example, Fig. 4a shows the results when the fit range starts at increasing times after injection and is seen to be constant within statistical errors. Fig. 4b shows the results for fits to the spectra from individual detectors (dof). The result for obtained from the average of individual detector fits (Fig. 4b) is consistent with the fit to the sum (Fig. 4a) to within ppm. The fitted lifetime, after correcting for muon losses, agrees with that expected from special relativity to better than .


Two of the three other analyses used fitting functions similar to Eq. 3. The principal differences between the analysis described and the others consist of a somewhat different choice of data selection and fitting parameters, a refined treatment of detector gain changes, and alternative ways to determine pileup. In one analysis, a pileup correction was made by varying the minimum pulse separation time in the reconstruction algorithm, whereas in the other analysis pileup is incorporated in the fitted function. The pileup phase was fixed to the value obtained from the constructed pileup spectrum. In the fourth analysis, the data are randomly split in four samples – which are rejoined in , , and the ratio
| (6) |
where is an estimate of the period and the constant . This ratio is largely independent of changes of observed counts on time scales larger than , e.g. the muon lifetime. The ratio can thus be fitted with fewer free parameters and its results have somewhat different systematic uncertainties.
The results from the analyses are found to agree, on to within ppm. This is within the statistical variation of ppm expected from the use of slightly different data in the respective analyses. We combined the results to (1.3 ppm). The only correction applied to our result was for the effects of the electric field and vertical betatron oscillations[1]. The error reflects the total uncertainty, accounts for the strong correlations between the individual results, and is dominated by the statistical contribution. The systematic errors are listed in Table II. The uncorrelated errors were added in quadrature, while the correlated errors were added linearly. Most of the systematics were common to all four analyses. Spin resonances, fit start time, and clock synchronization were considered and each was estimated to be less than . TABLE II.: Systematic errors for the analysis. Source of errors Size [ppm] Pileup AGS background Lost muons Timing shifts E field and vertical betatron oscillation Binning and fitting procedure Coherent betatron oscillation Beam debunching/randomization Gain changes Total systematic error on
After the and analyses were finalized, separately and independently, only then was the anomalous magnetic moment evaluated. The result is
| (7) |
in which , , and [8]. This new result is in good agreement with previous measurements[1, 2, 9] and reduces the combined error by a factor of about three.
The theoretical value of in the standard model (SM) [10] has its dominant contribution from quantum electrodynamics but the weak and strong interactions contribute as well. The value
| (8) |
is the sum of , , and . The term is obtained using the value of from [10], and terms through order are included. The term (weak) includes electroweak contributions of up to two-loop order. The term arises from virtual hadronic contributions to the photon propagator in order and order, where the latter includes light-by-light scattering. The order term, which provides the largest contribution and uncertainty to is obtained from measured hadron production cross sections in collisions and hadronic decay[11]. Additional data on collisions from Novosibirsk[12] and from Beijing[13] and on decay from Cornell[14] have not yet been included in the evaluation of .
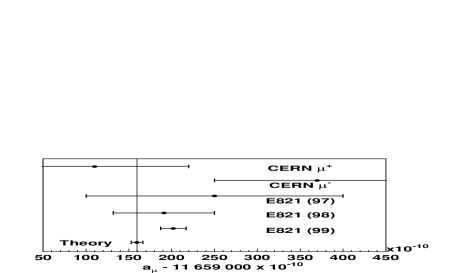
In Fig. 5, the five most recent measurements of are shown along with the standard model prediction. The difference between the weighted mean of the experimental results, , and the theoretical value from the standard model is
| (9) |
The error is the addition in quadrature of experimental and theoretical uncertainties. The difference is times the stated error.
Many speculative theories predict deviations from the standard model value for [10]. These include supersymmetry, muon substructure, and anomalous couplings. The muon anomalous value is particularly sensitive to supersymmetry[15] whose contributions to come from smuon-neutralino and sneutrino-chargino loops. In the limit of large tan, which is the ratio of the vacuum expectation values of two Higgs doublets, and for a degenerate spectrum of superparticles with mass ,
| (10) |
If we ascribe the difference to , for in the range 4 – 40, then – GeV.
In 2000, approximately four times the total number of positrons were recorded as compared to our 1999 data. Measurements are now underway with negative muons, which will provide a sensitive test of CPT violation.
We thank T. Kirk, D.I. Lowenstein, P. Pile, and the staff of the BNL AGS for the strong support they have given this experiment. We thank D. Cassel, A. Czarnecki, M. Davier, T. Kinoshita, W. Marciano, and J. Urheim for helpful discussions. This work was supported in part by the U.S. Department of Energy, the U.S. National Science Foundation, the German Bundesminister für Bildung und Forschung, the Russian Ministry of Science, and the US-Japan Agreement in High Energy Physics.
REFERENCES
- [1] H.N. Brown et al., Muon Collaboration, Phys. Rev. D62, 091101 (2000).
- [2] R.M. Carey et al., Muon Collaboration, Phys. Rev. Lett. 82, 1632 (1999).
- [3] F. Krienen, D. Loomba and W. Meng, Nucl. Instrum. Methods A283, 5 (1989). A. Yamamoto et al., Proc. of 15th Int. Conf. on Magnet Technology, Science Press Beijing, 246 (1998).
- [4] G.T. Danby, et al., Nucl. Instrum. Methods A457, 151 (2001).
- [5] R. Prigl et al., Nucl. Instrum. Methods A374, 118 (1996)
- [6] X. Fei et al. Nucl. Instrum. Methods A394, 349 (1997).
- [7] S. Sedykh et al., Nucl. Instrum. Methods A455, 346 (2000).
- [8] D.E. Groom et al., Review of Particle Physics, Eur. Phys. J. C15, 1 (2000).
- [9] J. Bailey et al., Nucl. Phys. B150, 1 (1979).
- [10] A. Czarnecki and W.J. Marciano, Nucl. Phys. (Proc. Suppl.) B76, 245 (1999).
- [11] M. Davier and A. Höcker, Phys. Lett. B435, 427 (1998).
- [12] R.R. Akhmetshin et al., CMD2 Collaboration, Phys. Lett. B475, 190 (2000).
- [13] Z.G. Zhao, Int. J. Mod. Phys. A15, 3739 (2000) and J.Z. Bai, et al., BES Collaboration, Phys. Rev. Lett. 84, 594 (2000).
- [14] S. Anderson et al., CLEO Collaboration Phys. Rev. D61, 112002 (2000).
- [15] T. Moroi, Phys. Rev. D53, 6565 (1996). U. Chattopadhyay and P. Nath, Phys. Rev. D53, 1648 (1996). J.L. Lopez, D.V. Nanopoulos and X. Wang, Phys. Rev D49, 366 (1994).