H. Tajima
(Belle Collaboration)
Department of Physics, University of Tokyo, 7-3-1 Hongo, Tokyo 113-0033 Japan
E-mail: tajima@phys.s.u-tokyo.ac.jp
Abstract
Charmed and beauty meson lifetimes have been measured using
fb-1 ( mesons) and fb-1 ( mesons) of
data collected with the Belle detector at KEKB.
The results are ps, ps,
fs, fs and fs, where the first error is
statistical and the second error is systematic.
The lifetime ratios are measured to be , and .
The mixing parameter is also measured to be for and % for , corresponding to
95% confidence intervals, and %, respectively.
All results are preliminary.
Contributed to the Proceedings of the 30th International Conference on High Energy Physics,
July 27 – August 2, 2000, Osaka, Japan.
Measurements of individual heavy meson lifetimes provide
useful information for the theoretical understanding of
heavy meson decay mechanisms.
In particular, experimental results[1] yield
, which is
inconsistent with the theoretically expected range[2]
of 1.00–1.07.
Moreover, measurements of the differences of lifetimes for
neutral mesons decaying into CP-mixed states and CP-eigenstates
can be used to study the
and particle-antiparticle mixing parameters.
The parameter , defined as
is related to and by the expression
where () is a CP-violating
weak phase due to the interference of decays
with and without mixing, and is a state-mixing CP-violating
parameter ().
The FOCUS experiment reports %[3],
while CLEO gives %[4],
% and
using ,
where and ;
is a strong phase between
and decays.
These results may be an indication of a large -breaking
effect in decays[5].
This report mainly describes the analysis.
The lifetime analyses are described in Ref. References.
Candidate decays are selected by applying
kinematic constraints on events with a lepton and a
decay chain, where , and
decays are used. First, the
decay vertex is determined and then
the decay vertex of the candidate is calculated using
the lepton and the inferred track.
The vertex point of the accompanying meson
is determined from the remaining tracks, after the rejection
of daughters and badly measured tracks.
When the reduced of the vertex fit is worse than 20,
the track that gives the largest contribution to the is removed
and the vertex fit is repeated.
This procedure is iterated until the requirement is satisfied.
Since the method does not properly treat
displaced charm vertices and their daughter tracks,
a degradation of the vertex resolution and a bias on the vertex position
is introduced. An
interaction point constraint is applied to the vertex fit
for both mesons in order to improve the vertex resolution.
The typical resolution is 100 m.
The proper-time difference is approximated as where is of the in the laboratory frame.
The likelihood function for lifetime fit is defined as
where: and are the and lifetimes;
and are the main and tail parts
of the resolution calculated event-by-event from the track
error matrix as described below;
denotes the fraction of the tail part of
the signal resolution function and is determined from the fit.
and are the biases due to the charm meson daughter tracks,
determined from the MC simulation;
, , , are background-shape parameters,
determined from the fit (fake ),
data (fake lepton) or MC (random );
, and are fractions
of the and signals and background
contributions that are calculated event-by-event using
the measured value.
The background fractions are estimated from
the known branching fractions and included in
and , since the effect of the
missing is found to be negligible.
The resolution is a convolution of
the resolution and the error
due to the kinematic approximation
() :
The resolution is
calculated from the vertex resolutions of the
reconstructed () and associated () mesons:
where is a global
scaling factor that accounts for any systematic bias in
the resolution calculation from the track-helix errors,
and is a scaling factor to account for
the degradation of the vertex resolution of the
associated meson due to contamination of charm daughters.
If the reduced () of the vertex fit
is worse than 3, the corresponding vertex error
( or ) is scaled by .
This -dependent scaling is essential
to account for events with large errors.
We use the value of determined from
the lifetime fit in the direction. The values for
, and are determined from the MC.
is calculated in a similar manner.
The associated parameter is determined in the fit along with .
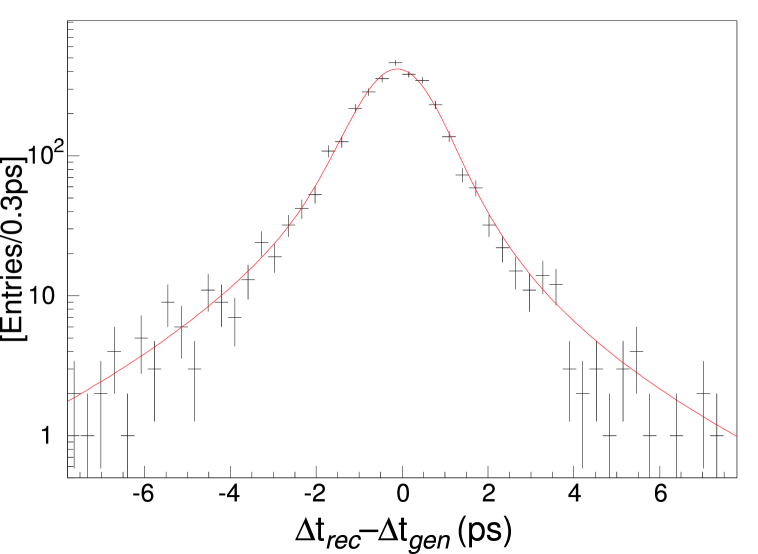
Figure 1 shows the distribution and
resolution function for MC signal events.
Figure 1: The distribution and
resolution function for MC signal events.
The likelihood function for the hadronic modes is defined as
The fraction of background is calculated from
the and values for each event.
The background shape parameters , , , , , and are determined from the fit.
We use in the analysis to account for slightly different kinematic properties from decays.
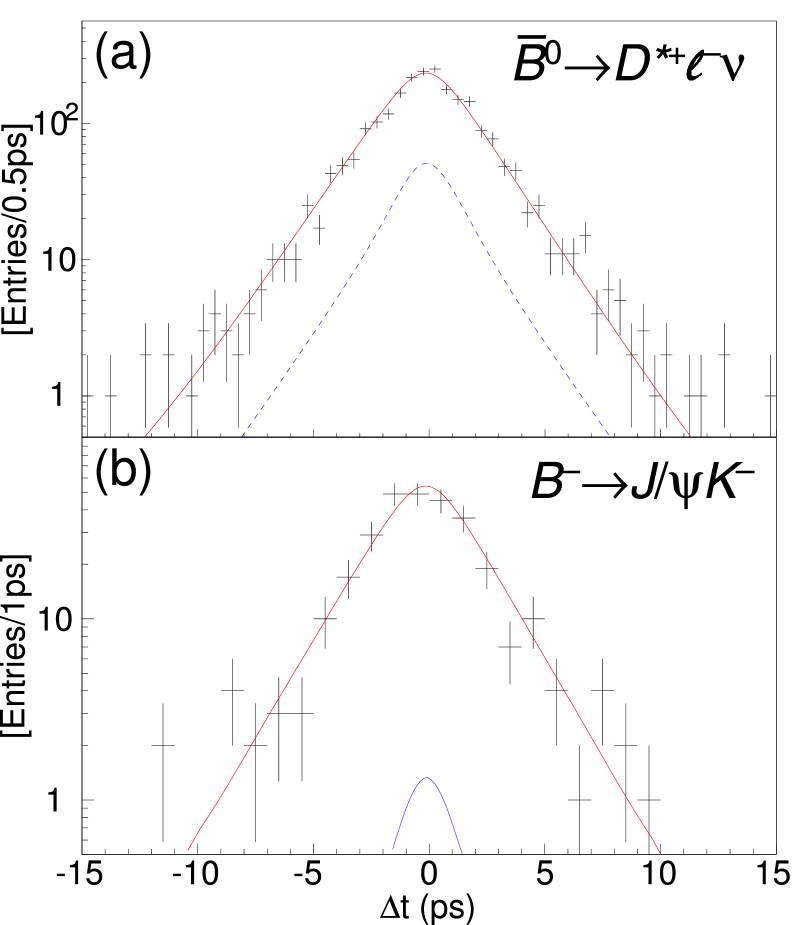
Figure 2 shows the distributions and
fit results for and events.
Table 1 summarizes the measurement results.
The main sources of systematic errors are
uncertainties in the resolution function
and the dependence of the reconstruction efficiency.
All results are preliminary.
Figure 2: The distributions and fit results
for (a) and (b) events. The
dotted curve represents the background.
Table 1: Summary of lifetime measurements.
(a) lifetime measurements.
() ps
() ps
() ps
() ps
combined
() ps
() ps
() ps
() ps
() ps
combined
() ps
(b) lifetime measurements.
() fs
() fs
() fs
() fs
combined
() fs
() fs
() fs
combined
() fs
() %
References
[1] H.W.K. Cheung, hep-ex/9912021.
[2] I.I. Bigi and N.G. Uraltsev, Z. Phys. C 62 (1994) 623.