We report on measurements of the inclusive production rate of and baryons in hadronic Z decays collected with the L3 detector at LEP. The baryons are detected through the decay , while the baryons are detected via the decay mode . The average numbers of and per hadronic Z decay are measured to be:
These rates are found to be higher than the predictions from Monte Carlo hadronization models and analytical parameterizations of strange baryon production.
Dedicated to the Memory of Howard D. Stone
Submitted to Phys. Lett. B
Introduction
Measurements of hadron production in e+e- annihilation are important to understand the fragmentation process of quarks and gluons into hadrons. Perturbation theory cannot be applied to describe this process and the theoretical description is based on phenomenological models as implemented, for example, in the JETSET [1], HERWIG [2] or ARIADNE [3] Monte Carlo generators.
Recently, two analytical models have been proposed to describe the hadron production rates in e+e- annihilation [4, 5]. The model of Reference [4], referred to from here on as the “string-based model,” is derived partially from string fragmentation and describes the production of light mesons and baryons using the simple formula:
| (1) |
where is the number of primary hadrons of spin , containing strange quarks, produced directly by string fragmentation. The quantity is the hadron binding energy: , where are constituent quark masses, and is the effective temperature of hadronization in this model. The overall normalization of the rate is controlled by . The evolution of with center-of-mass energy is predicted by perturbative QCD [6]. The parameter is a universal suppression factor for strange quark production, while is a suppression factor of baryon production relative to meson production. This model has five free parameters: at some fixed energy scale, , , and , the mass difference between strange and up quarks. The model of Reference [5], referred to from here on as the “hadron gas model,” is based on thermodynamical considerations and has three adjustable parameters: the total volume of the hadron gas, a strangeness suppression factor similar to in Reference [4], and the hadronization temperature . In the hadron gas model, no additional parameters are needed to reproduce the relative production rate of baryons versus mesons. Both of these models give a good description of the full spectrum of light hadron production in addition to predicting the rates for strange baryons. The string-based model also describes well the relative production rate of hadrons containing b and c quarks. In order to compare the experimental data to these two analytical models which predict primary hadron production, the observed rate must first be corrected for two effects: (i) hadrons containing quarks produced in the primary electroweak interaction, (ii) ‘feed-down’ due to the decays of unstable hadrons produced in string fragmentation [4] or, correspondingly, the phase change that produces the hadron gas [5]. The feed-down correction is made using known hadron branching ratios [7].
This paper presents measurements of and strange baryons produced in hadronic Z decays at center-of-mass energies in the range \GeV, from 71.1 pb-1 of data collected by the L3 detector during the LEP running periods of 1994 and 1995. The and baryons provide a good test of the hadron rate models because of their relatively low feed-down correction as compared to the lighter p and baryons. The use of the decay modes which have photons, and , enable the measurements to be made down to low baryon momenta due to the low-energy photon detection capability of the L3 detector.
The L3 Detector
A detailed description of the L3 detector and its performance is given in Reference [8]. This analysis makes use of the electromagnetic calorimeter made of Bismuth Germanate (BGO) crystals, which accurately identifies and measures photons from an energy of 50 \MeV to 200 \GeV. In order to benefit from the low-energy photon detection of the calorimeter, its performance was studied and parameterized [9]. The resulting resolution functions are shown in Figure 1. In addition, corrections due to electronic noise and calibration accuracy are taken into account. The electronic noise terms are with \MeV and with \MeV where is the mean intrinsic noise per channel and is the mean correlated noise per channel, and is the number of crystals used to compute the shower energy. The calibration accuracy term for 1994 and 1995 is with as estimated from Bhabha events. These terms are added in quadrature to the resolution functions of Figure 1.
Hadronic Event Selection
The inclusive production rate measurements are based on a selection of hadronic Z decays which have a measured primary vertex. A precise measurement of the primary vertex in all three dimensions is achieved in more than 99% of all hadronic events. The hadronic selection requires a well-balanced, high particle-multiplicity event with the full collision energy measured by the detector and relies on the following criteria:
-
1.
The total energy observed in the detector, including the momenta of muons measured in the muon spectrometer, , is restricted to the range .
-
2.
The energy imbalance along the beam direction, , must satisfy .
-
3.
The transverse energy imbalance, , with respect to the beam direction, must satisfy .
-
4.
The number of energy clusters reconstructed in the calorimeters is required to be larger than 12.
A data set of 1.6 million hadronic Z decays was selected for this analysis.
Analysis Procedure
The events passing the hadronic event selection are analyzed for the inclusive production of and in the decay modes and , respectively. The p and mass distributions are computed, and a fitting procedure is applied to count the number of selected candidates in the mass peak. The anti-particles of the and are included in the corresponding distributions to increase the statistical significance of the data samples.
Central to the selections of the and candidates are the kinematical constraints describing their decay. A probability is assigned to each candidate based on the minimum which satisfies the decay constraints. The has the form:
| (2) | |||||
where the number of charged-particle tracks and electromagnetic clusters used to reconstruct the decay are respectively and ; is the vector of measured parameters for the track and the corresponding covariance matrix; are the fit parameters assuming the track originated from the secondary vertex with momentum ; is the event-vertex with covariance matrix ; is the fit to the production vertex; is the vector of measured parameters for the electromagnetic cluster with covariance matrix ; and are the fit parameters assuming that a photon originated from the secondary vertex with momentum . The details of the constrained fitting technique are found in Reference [9]. In addition to the constraint probability cuts, other selection criteria are also applied to reduce combinatorial background.
The fitting procedure of the invariant mass distributions consists of several steps. The JETSET Monte Carlo simulation is used to predict the shape of the p and mass distributions separately for the background and the and signals. The Monte Carlo signal and background distributions are binned into histograms which are then smoothed with a spline fit. The spline fit reduces background fluctuations in the signal region by interpolating between the sidebands of the signal. The use of binned histograms with bin widths comparable to the expected mass resolution of the and signals is found to be optimal for exploiting the histogram shape differences between signal and background. A maximum likelihood fit is performed for both the signal and the background normalizations, simultaneously. The likelihood is constructed by computing the Poisson probability for each bin and then making the product over all bins in the histogram, as follows,
| (3) |
where and are respectively the total number of signal and background events, is the number of observed data events in a given bin and and are the number of expected events in a given bin for signal and background, respectively.
The production rates of the and are determined by a kinematic extrapolation which assumes the JETSET Monte Carlo production distributions.
Selection
The signature of a decay is a single charged track and two photons measured in the calorimeter as shown in Figure 2a. The kinematical information of the decay configuration, in addition to the assumption that the is produced at the primary vertex, can be expressed as follows:
| (4) |
| (5) |
where the vector is the direction of flight of the at the time of decay; the vectors , and are respectively the proton momenta and the momenta of the two photons; and and are the calculated mass of the diphoton system and the mass, respectively. A probability, , is assigned to each candidate based on the minimum which satisfies constraints (4) and (5). The is obtained from equation (2). The computation of the constraint probability requires the accurate description of the photon resolution in energy and angle in the calorimeter.
The selection of candidates consists of the following cuts:
-
1.
The constraint probability, , must be larger than 0.2.
-
2.
The energies of the two photons must be greater than \MeV and their polar angle must be in the BGO barrel acceptance ().
-
3.
The boost, , is required to be larger than 2.0.
-
4.
The transverse momentum of the proton must exceed 800 \MeV.
-
5.
The transverse decay radius, , of the is required to be in the range mm ensuring the decay to be inside the inner radius of the Silicon Microvertex Detector (SMD).
-
6.
Charged tracks which are identified as coming from or K decay are rejected as proton candidates from decay.
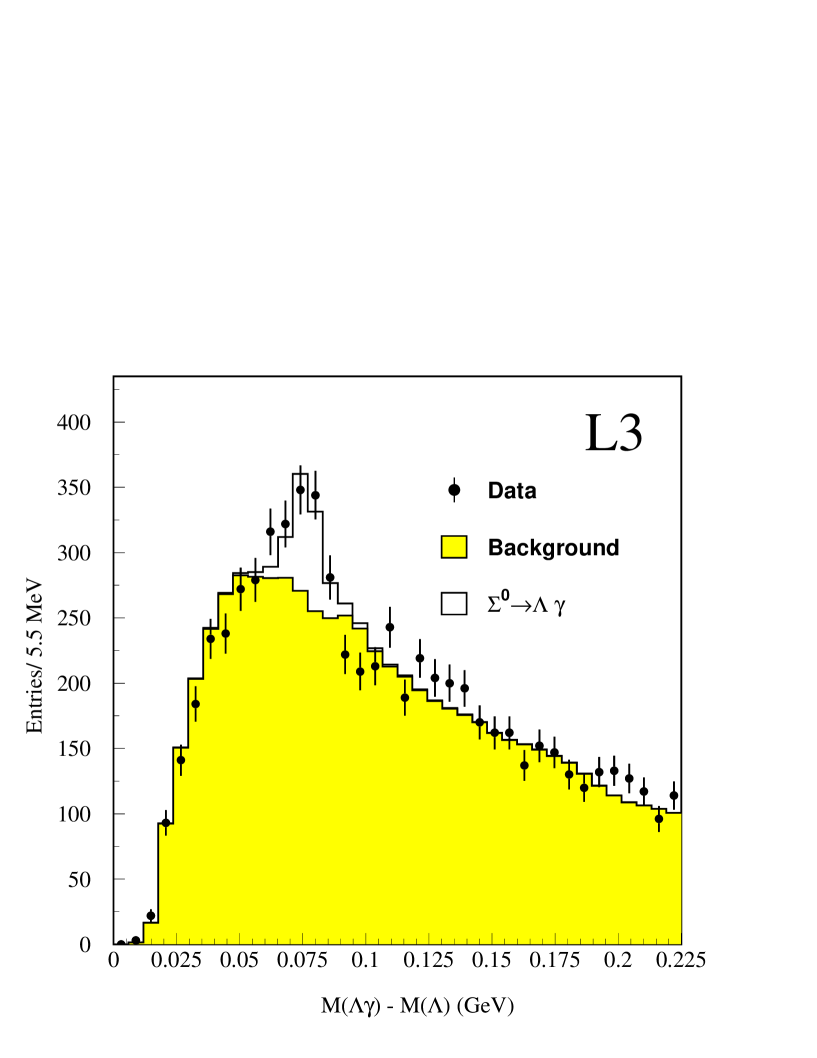
Figure 3 shows the mass distribution of the selected candidates. The number of selected decays determined by the fit is found to be 342 33.
Selection
The is measured in the decay mode . This mode accounts for nearly 100% of the branching fractions. Identification of the is done using the decay mode. The proton is assumed to be the track with the highest momentum of the two tracks forming the candidate. The kinematic constraints of the decay, shown in Figure 2b, are summarized by the following equations:
| (6) |
| (7) |
where the vector points from the primary vertex to the decay point; the vectors and are respectively the proton and pion momenta; and and are the calculated mass of the proton-pion system and the mass, respectively. A probability, , is assigned to each candidate based on the minimum (equation 2) which satisfies constraints (6) and (7). A large combinatorial background to the signal is present in the limit that
| (8) |
where is the decay vertex and is the primary event vertex. A constraint probability, , is also computed for candidates to satisfy equation (8). The signal has less background when is small.
The selection consists of the following cuts:
-
1.
The transverse momenta of the proton and pion coming from the decay must both exceed 200 \MeV.
-
2.
The constraint probability, , must be larger than 0.01, and the constraint probability, , must be smaller than .
-
3.
The transverse decay radius, , of the is limited to the range mm ensuring the decay to be inside the inner radius of the SMD.
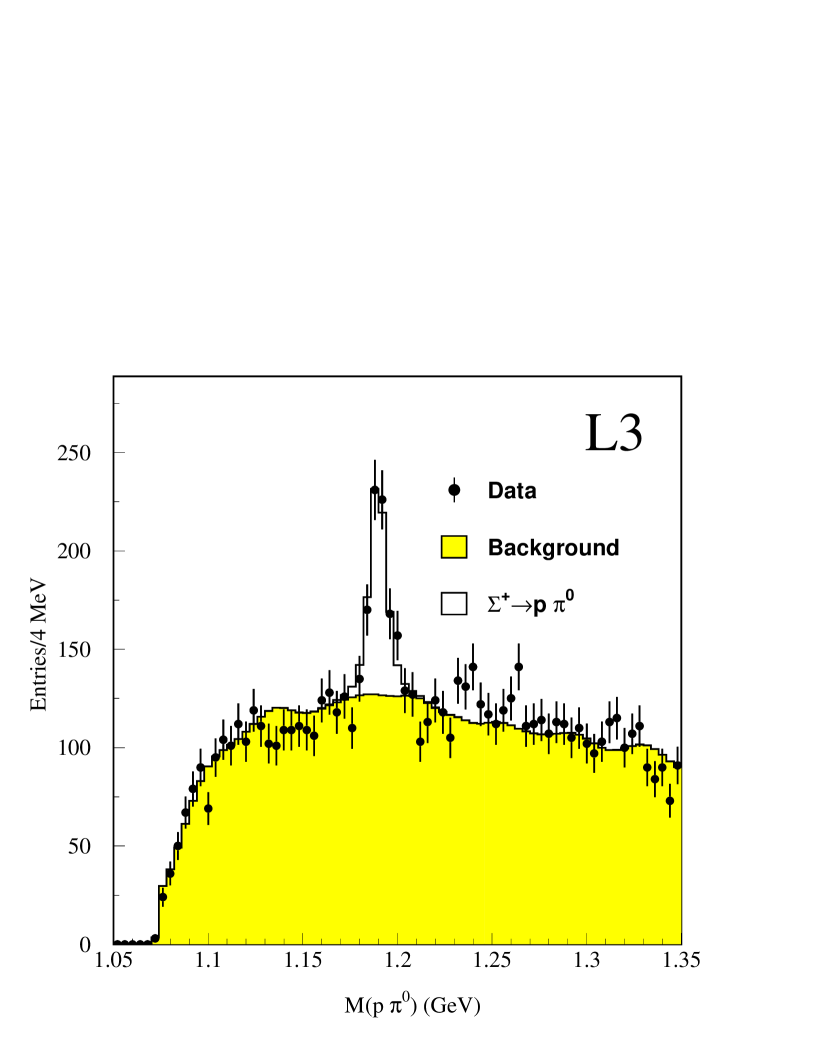
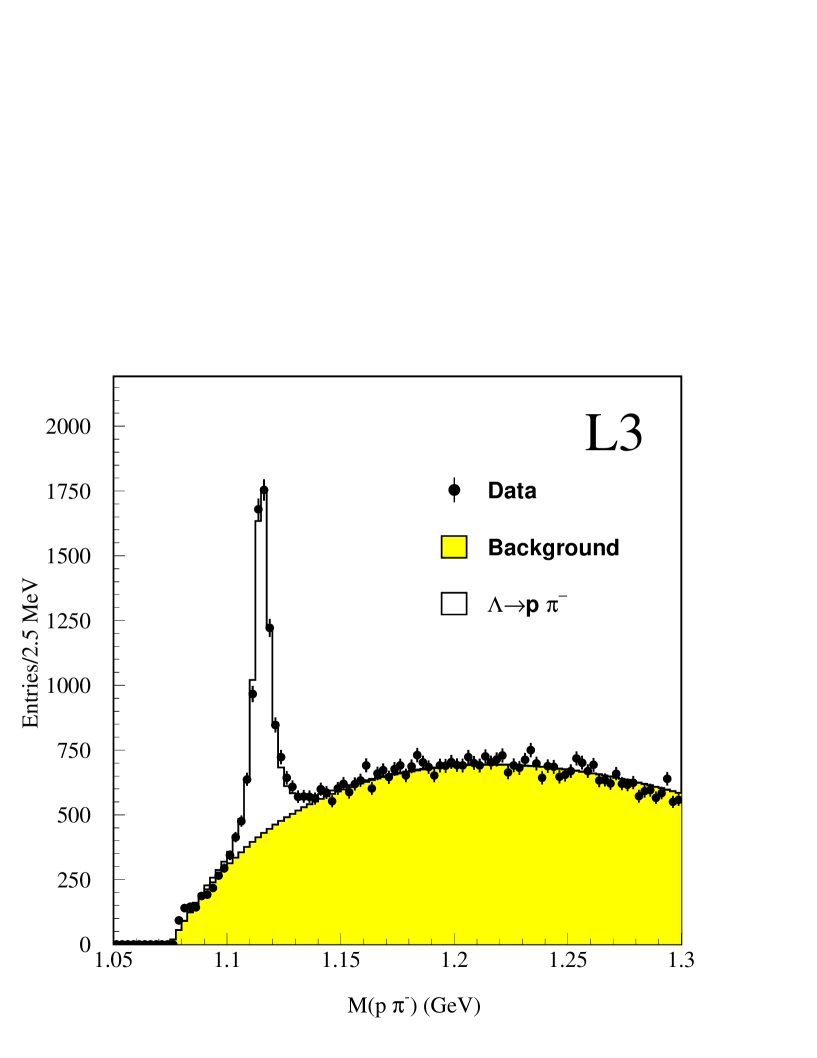
After applying the selection cuts with the exception of constraint (7), the reconstructed mass spectrum is plotted in Figure 4 where the is clearly visible. To reconstruct the decay, an electromagnetic cluster in the BGO detector is combined with a selected .
The following additional criteria is applied to select candidates:
-
1.
The energy of the photon, , is restricted to the range \GeV and the photon polar angle must be within the BGO barrel acceptance ().
-
2.
The angle, , of the with respect to the momentum in the rest frame is required to satisfy .
Figure 5 shows the mass difference distribution of the selected candidates. The number of selected decays is found to be 263 42.
Rate Measurements
A total of 6.2 million hadronic Z decays were simulated with the JETSET Monte Carlo to estimate detector effects. The simulation accounts for the run conditions in luminosity-weighted periods throughout the data-taking.
For signal and background fitting, further tuning of Monte Carlo distributions is performed. The signal shape predicted by the simulation is adjusted to fit the observed peak position and resolution measured in the data. The change in the rate for a corresponding change of 0.5 in the negative log likelihood in the fit of the background and signal normalizations is taken as a systematic error.
To estimate the statistical error on the Monte Carlo determination of the background shape, the signal is fit with a fixed normalization of the background corresponding to two cases: a) increasing the background-level by one standard deviation (given by the two parameter fit), and b) decreasing the background-level by the same amount. In the case of the , where the photon energy spectrum goes down to threshold, the observed difference in the low-energy photon energy spectrum between Monte Carlo and data is used to reweight the mass difference distribution. The correlation on the rate measurement between reweighting based on background versus background plus signal is quoted as a systematic error.
In order to estimate the error on the kinematic extrapolation of the observed rate to the full phase space of the and baryons produced in the fragmentation process, several Monte Carlo generators are used to predict the extrapolation [3, 1, 2]. The variations in the fractions of decays inside the kinematic ranges of the and selections are given in Table 1. These are taken as systematic errors. Varying the and selection cuts over a wide range of cut values has no observed systematic effect on the measured rates.
Using the JETSET Monte Carlo as a reference for the extrapolation, the efficiencies for and are found to be 0.19% and 0.18%, respectively. The error on the efficiencies from Monte Carlo statistics is taken as a systematic error. The sources of systematic errors in the production rate measurements are listed in Table 2. The average numbers of and per hadronic Z decay are measured to be:
Our measurements of the and production rates in hadronic Z decays are compared to baryon production rates predicted by JETSET, HERWIG and ARIADNE models in Table 3 [10]. In this table, the numbers obtained from the string-based and the hadron gas models are also listed. The predictions of all of these models underestimate our measured rates. Our measurements are consistent with other measurements performed at LEP [11, 12, 13]. However, we observe rates which are somewhat higher. This difference could arise from the low momentum part of the baryon production spectra. The use of low energy photons in the measurements of the and production rates allows the kinematical ranges covered by the L3 measurements to extend down to lower baryon momenta than those measured by the other LEP detectors.
Acknowledgements
We wish to express our gratitude to the CERN accelerator divisions for the excellent performance of the LEP machine. We acknowledge the contributions of the engineers and technicians who have participated in the construction and maintenance of this experiment.
References
- [1] JETSET, T. Sjöstrand, Comp. Phys. Comm. 39 (1986) 347. Version 7.4 is used for this analysis.
- [2] HERWIG, G. Marchesini et al., Comp. Phys. Comm. 67 (1992) 465–508.
- [3] ARIADNE, L. Lönnblad, Comp. Phys. Comm. 71 (1992) 15–31.
- [4] Y. J. Pei, Zeitschrift für Physik C 72 (1996) 39–46.
- [5] F. Becattini, Zeitschrift für Physik C 69 (1996) 485–492.
- [6] B. R. Webber, Phys. Lett. B 143 (1984) 501–504.
- [7] C. Caso et al., Eur. Phys. J. C 3 (1998) 1.
- [8] L3 Collab., B. Adeva \etal, Nucl. Inst. Meth. A 289 (1990) 35; M. Acciarri \etal, Nucl. Inst. Meth. A 351 (1994) 300; L3 Collab., O. Adriani \etal, Physics Reports 236 (1993) 1.
- [9] C. G. Tully, Baryon Production in Z Decay, Ph.D. thesis, Princeton University, 1997.
- [10] L3 Collab., B. Adeva \etal, Z. Phys. C 55 (1992) 39.
- [11] OPAL Collab., G. Alexander et al., Zeitschrift für Physik C 73 (1997) 587–600.
- [12] DELPHI Collab., W. Adam et al., Zeitschrift für Physik C 70 (1996) 371–382.
- [13] ALEPH Collab., R. Barate et al., Physics Reports 294 (1998) 1–165.
The L3 Collaboration:
M.Acciarri,26 P.Achard,19 O.Adriani,16 M.Aguilar-Benitez,25 J.Alcaraz,25 G.Alemanni,22 J.Allaby,17 A.Aloisio,28 M.G.Alviggi,28 G.Ambrosi,19 H.Anderhub,48 V.P.Andreev,6,36 T.Angelescu,12 F.Anselmo,9 A.Arefiev,27 T.Azemoon,3 T.Aziz,10 P.Bagnaia,35 A.Bajo,25 L.Baksay,43 A.Balandras,4 S.Banerjee,10 Sw.Banerjee,10 A.Barczyk,48,46 R.Barillère,17 L.Barone,35 P.Bartalini,22 M.Basile,9 R.Battiston,32 A.Bay,22 F.Becattini,16 U.Becker,14 F.Behner,48 L.Bellucci,16 R.Berbeco,3 J.Berdugo,25 P.Berges,14 B.Bertucci,32 B.L.Betev,48 S.Bhattacharya,10 M.Biasini,32 A.Biland,48 J.J.Blaising,4 S.C.Blyth,33 G.J.Bobbink,2 A.Böhm,1 L.Boldizsar,13 B.Borgia,35 D.Bourilkov,48 M.Bourquin,19 S.Braccini,19 J.G.Branson,39 V.Brigljevic,48 F.Brochu,4 A.Buffini,16 A.Buijs,44 J.D.Burger,14 W.J.Burger,32 X.D.Cai,14 M.Campanelli,48 M.Capell,14 G.Cara Romeo,9 G.Carlino,28 A.M.Cartacci,16 J.Casaus,25 G.Castellini,16 F.Cavallari,35 N.Cavallo,37 C.Cecchi,32 M.Cerrada,25 F.Cesaroni,23 M.Chamizo,19 Y.H.Chang,50 U.K.Chaturvedi,18 M.Chemarin,24 A.Chen,50 G.Chen,7 G.M.Chen,7 H.F.Chen,20 H.S.Chen,7 G.Chiefari,28 L.Cifarelli,38 F.Cindolo,9 C.Civinini,16 I.Clare,14 R.Clare,14 G.Coignet,4 A.P.Colijn,2 N.Colino,25 S.Costantini,5 F.Cotorobai,12 B.Cozzoni,9 B.de la Cruz,25 A.Csilling,13 S.Cucciarelli,32 T.S.Dai,14 J.A.van Dalen,30 R.D’Alessandro,16 R.de Asmundis,28 P.Déglon,19 A.Degré,4 K.Deiters,46 D.della Volpe,28 P.Denes,34 F.DeNotaristefani,35 A.De Salvo,48 M.Diemoz,35 D.van Dierendonck,2 F.Di Lodovico,48 C.Dionisi,35 M.Dittmar,48 A.Dominguez,39 A.Doria,28 M.T.Dova,18,♯ D.Duchesneau,4 D.Dufournaud,4 P.Duinker,2 I.Duran,40 H.El Mamouni,24 A.Engler,33 F.J.Eppling,14 F.C.Erné,2 P.Extermann,19 M.Fabre,46 R.Faccini,35 M.A.Falagan,25 S.Falciano,35,17 A.Favara,17 J.Fay,24 O.Fedin,36 M.Felcini,48 T.Ferguson,33 F.Ferroni,35 H.Fesefeldt,1 E.Fiandrini,32 J.H.Field,19 F.Filthaut,17 P.H.Fisher,14 I.Fisk,39 G.Forconi,14 L.Fredj,19 K.Freudenreich,48 C.Furetta,26 Yu.Galaktionov,27,14 S.N.Ganguli,10 P.Garcia-Abia,5 M.Gataullin,31 S.S.Gau,11 S.Gentile,35,17 N.Gheordanescu,12 S.Giagu,35 Z.F.Gong,20 G.Grenier,24 O.Grimm,48 M.W.Gruenewald,8 M.Guida,38 R.van Gulik,2 V.K.Gupta,34 A.Gurtu,10 L.J.Gutay,45 D.Haas,5 A.Hasan,29 D.Hatzifotiadou,9 T.Hebbeker,8 A.Hervé,17 P.Hidas,13 J.Hirschfelder,33 H.Hofer,48 G. Holzner,48 H.Hoorani,33 S.R.Hou,50 Y.Hu,30 I.Iashvili,47 B.N.Jin,7 L.W.Jones,3 P.de Jong,2 I.Josa-Mutuberría,25 R.A.Khan,18 M.Kaur,18,♢ M.N.Kienzle-Focacci,19 D.Kim,35 J.K.Kim,42 J.Kirkby,17 D.Kiss,13 W.Kittel,30 A.Klimentov,14,27 A.C.König,30 A.Kopp,47 V.Koutsenko,14,27 M.Kräber,48 R.W.Kraemer,33 W.Krenz,1 A.Krüger,47 A.Kunin,14,27 P.Ladron de Guevara,25 I.Laktineh,24 G.Landi,16 K.Lassila-Perini,48 M.Lebeau,17 A.Lebedev,14 P.Lebrun,24 P.Lecomte,48 P.Lecoq,17 P.Le Coultre,48 H.J.Lee,8 J.M.Le Goff,17 R.Leiste,47 E.Leonardi,35 P.Levtchenko,36 C.Li,20 S.Likhoded,47 C.H.Lin,50 W.T.Lin,50 F.L.Linde,2 L.Lista,28 Z.A.Liu,7 W.Lohmann,47 E.Longo,35 Y.S.Lu,7 K.Lübelsmeyer,1 C.Luci,17,35 D.Luckey,14 L.Lugnier,24 L.Luminari,35 W.Lustermann,48 W.G.Ma,20 M.Maity,10 L.Malgeri,17 A.Malinin,17 C.Maña,25 D.Mangeol,30 J.Mans,34 P.Marchesini,48 G.Marian,15 J.P.Martin,24 F.Marzano,35 G.G.G.Massaro,2 K.Mazumdar,10 R.R.McNeil,6 S.Mele,17 L.Merola,28 M.Meschini,16 W.J.Metzger,30 M.von der Mey,1 A.Mihul,12 H.Milcent,17 G.Mirabelli,35 J.Mnich,17 G.B.Mohanty,10 P.Molnar,8 B.Monteleoni,16,† T.Moulik,10 G.S.Muanza,24 F.Muheim,19 A.J.M.Muijs,2 M.Musy,35 M.Napolitano,28 F.Nessi-Tedaldi,48 H.Newman,31 T.Niessen,1 A.Nisati,35 H.Nowak,47 G.Organtini,35 A.Oulianov,27 C.Palomares,25 D.Pandoulas,1 S.Paoletti,35,17 P.Paolucci,28 R.Paramatti,35 H.K.Park,33 I.H.Park,42 G.Pascale,35 G.Passaleva,17 S.Patricelli,28 T.Paul,11 M.Pauluzzi,32 C.Paus,17 F.Pauss,48 M.Pedace,35 S.Pensotti,26 D.Perret-Gallix,4 B.Petersen,30 D.Piccolo,28 F.Pierella,9 M.Pieri,16 P.A.Piroué,34 E.Pistolesi,26 V.Plyaskin,27 M.Pohl,19 V.Pojidaev,27,16 H.Postema,14 J.Pothier,17 N.Produit,19 D.O.Prokofiev,45 D.Prokofiev,36 J.Quartieri,38 G.Rahal-Callot,48,17 M.A.Rahaman,10 P.Raics,15 N.Raja,10 R.Ramelli,48 P.G.Rancoita,26 A.Raspereza,47 G.Raven,39 P.Razis,29D.Ren,48 M.Rescigno,35 S.Reucroft,11 T.van Rhee,44 S.Riemann,47 K.Riles,3 A.Robohm,48 J.Rodin,43 B.P.Roe,3 L.Romero,25 A.Rosca,8 S.Rosier-Lees,4 J.A.Rubio,17 D.Ruschmeier,8 H.Rykaczewski,48 S.Saremi,6 S.Sarkar,35 J.Salicio,17 E.Sanchez,17 M.P.Sanders,30 M.E.Sarakinos,21 C.Schäfer,17 V.Schegelsky,36 S.Schmidt-Kaerst,1 D.Schmitz,1 H.Schopper,49 D.J.Schotanus,30 G.Schwering,1 C.Sciacca,28 D.Sciarrino,19 A.Seganti,9 L.Servoli,32 S.Shevchenko,31 N.Shivarov,41 V.Shoutko,27 E.Shumilov,27 A.Shvorob,31 T.Siedenburg,1 D.Son,42 B.Smith,33 P.Spillantini,16 M.Steuer,14 D.P.Stickland,34 A.Stone,6 H.Stone,34,† B.Stoyanov,41 A.Straessner,1 K.Sudhakar,10 G.Sultanov,18 L.Z.Sun,20 H.Suter,48 J.D.Swain,18 Z.Szillasi,43,¶ T.Sztaricskai,43,¶ X.W.Tang,7 L.Tauscher,5 L.Taylor,11 B.Tellili,24 C.Timmermans,30 Samuel C.C.Ting,14 S.M.Ting,14 S.C.Tonwar,10 J.Tóth,13 C.Tully,17 K.L.Tung,7Y.Uchida,14 J.Ulbricht,48 E.Valente,35 G.Vesztergombi,13 I.Vetlitsky,27 D.Vicinanza,38 G.Viertel,48 S.Villa,11 M.Vivargent,4 S.Vlachos,5 I.Vodopianov,36 H.Vogel,33 H.Vogt,47 I.Vorobiev,27 A.A.Vorobyov,36 A.Vorvolakos,29 M.Wadhwa,5 W.Wallraff,1 M.Wang,14 X.L.Wang,20 Z.M.Wang,20 A.Weber,1 M.Weber,1 P.Wienemann,1 H.Wilkens,30 S.X.Wu,14 S.Wynhoff,17 L.Xia,31 Z.Z.Xu,20 J.Yamamoto,3 B.Z.Yang,20 C.G.Yang,7 H.J.Yang,7 M.Yang,7 J.B.Ye,20 S.C.Yeh,51 An.Zalite,36 Yu.Zalite,36 Z.P.Zhang,20 G.Y.Zhu,7 R.Y.Zhu,31 A.Zichichi,9,17,18 G.Zilizi,43,¶ M.Zöller.1
-
1
I. Physikalisches Institut, RWTH, D-52056 Aachen, FRG§
III. Physikalisches Institut, RWTH, D-52056 Aachen, FRG§ -
2
National Institute for High Energy Physics, NIKHEF, and University of Amsterdam, NL-1009 DB Amsterdam, The Netherlands
-
3
University of Michigan, Ann Arbor, MI 48109, USA
-
4
Laboratoire d’Annecy-le-Vieux de Physique des Particules, LAPP,IN2P3-CNRS, BP 110, F-74941 Annecy-le-Vieux CEDEX, France
-
5
Institute of Physics, University of Basel, CH-4056 Basel, Switzerland
-
6
Louisiana State University, Baton Rouge, LA 70803, USA
-
7
Institute of High Energy Physics, IHEP, 100039 Beijing, China△
-
8
Humboldt University, D-10099 Berlin, FRG§
-
9
University of Bologna and INFN-Sezione di Bologna, I-40126 Bologna, Italy
-
10
Tata Institute of Fundamental Research, Bombay 400 005, India
-
11
Northeastern University, Boston, MA 02115, USA
-
12
Institute of Atomic Physics and University of Bucharest, R-76900 Bucharest, Romania
-
13
Central Research Institute for Physics of the Hungarian Academy of Sciences, H-1525 Budapest 114, Hungary‡
-
14
Massachusetts Institute of Technology, Cambridge, MA 02139, USA
-
15
KLTE-ATOMKI, H-4010 Debrecen, Hungary¶
-
16
INFN Sezione di Firenze and University of Florence, I-50125 Florence, Italy
-
17
European Laboratory for Particle Physics, CERN, CH-1211 Geneva 23, Switzerland
-
18
World Laboratory, FBLJA Project, CH-1211 Geneva 23, Switzerland
-
19
University of Geneva, CH-1211 Geneva 4, Switzerland
-
20
Chinese University of Science and Technology, USTC, Hefei, Anhui 230 029, China△
-
21
SEFT, Research Institute for High Energy Physics, P.O. Box 9, SF-00014 Helsinki, Finland
-
22
University of Lausanne, CH-1015 Lausanne, Switzerland
-
23
INFN-Sezione di Lecce and Universitá Degli Studi di Lecce, I-73100 Lecce, Italy
-
24
Institut de Physique Nucléaire de Lyon, IN2P3-CNRS,Université Claude Bernard, F-69622 Villeurbanne, France
-
25
Centro de Investigaciones Energéticas, Medioambientales y Tecnologícas, CIEMAT, E-28040 Madrid, Spain
-
26
INFN-Sezione di Milano, I-20133 Milan, Italy
-
27
Institute of Theoretical and Experimental Physics, ITEP, Moscow, Russia
-
28
INFN-Sezione di Napoli and University of Naples, I-80125 Naples, Italy
-
29
Department of Natural Sciences, University of Cyprus, Nicosia, Cyprus
-
30
University of Nijmegen and NIKHEF, NL-6525 ED Nijmegen, The Netherlands
-
31
California Institute of Technology, Pasadena, CA 91125, USA
-
32
INFN-Sezione di Perugia and Universitá Degli Studi di Perugia, I-06100 Perugia, Italy
-
33
Carnegie Mellon University, Pittsburgh, PA 15213, USA
-
34
Princeton University, Princeton, NJ 08544, USA
-
35
INFN-Sezione di Roma and University of Rome, “La Sapienza”, I-00185 Rome, Italy
-
36
Nuclear Physics Institute, St. Petersburg, Russia
-
37
INFN-Sezione di Napoli and University of Potenza, I-85100 Potenza, Italy
-
38
University and INFN, Salerno, I-84100 Salerno, Italy
-
39
University of California, San Diego, CA 92093, USA
-
40
Dept. de Fisica de Particulas Elementales, Univ. de Santiago, E-15706 Santiago de Compostela, Spain
-
41
Bulgarian Academy of Sciences, Central Lab. of Mechatronics and Instrumentation, BU-1113 Sofia, Bulgaria
-
42
Laboratory of High Energy Physics, Kyungpook National University, 702-701 Taegu, Republic of Korea
-
43
University of Alabama, Tuscaloosa, AL 35486, USA
-
44
Utrecht University and NIKHEF, NL-3584 CB Utrecht, The Netherlands
-
45
Purdue University, West Lafayette, IN 47907, USA
-
46
Paul Scherrer Institut, PSI, CH-5232 Villigen, Switzerland
-
47
DESY, D-15738 Zeuthen, FRG
-
48
Eidgenössische Technische Hochschule, ETH Zürich, CH-8093 Zürich, Switzerland
-
49
University of Hamburg, D-22761 Hamburg, FRG
-
50
National Central University, Chung-Li, Taiwan, China
-
51
Department of Physics, National Tsing Hua University, Taiwan, China
-
§
Supported by the German Bundesministerium für Bildung, Wissenschaft, Forschung und Technologie
-
‡
Supported by the Hungarian OTKA fund under contract numbers T019181, F023259 and T024011.
-
¶
Also supported by the Hungarian OTKA fund under contract numbers T22238 and T026178.
-
Supported also by the Comisión Interministerial de Ciencia y Tecnología.
-
Also supported by CONICET and Universidad Nacional de La Plata, CC 67, 1900 La Plata, Argentina.
-
Also supported by Panjab University, Chandigarh-160014, India.
-
Supported by the National Natural Science Foundation of China.
-
†
Deceased.
| Monte Carlo | ||
| ARIADNE 4.08 | 0.317 | 0.100 |
| JETSET 7.4 | 0.321 | 0.097 |
| HERWIG 5.9 | 0.311 | 0.091 |
| Maximum Spread | 3.1% | 9.0% |
| (%) | (%) | |
| 6.1 | 7.0 | |
| 0.6 | 1.9 | |
| 2.4 | 6.4 | |
| – | 2.9 | |
| 3.1 | 9.0 | |
| 3.5 | 3.8 | |
| 8.1 | 14.1 |
| Monte Carlo | ||
|---|---|---|
| JETSET | 0.0711 | 0.0691 |
| HERWIG | 0.0978 | 0.0692 |
| ARIADNE | 0.0716 | 0.0685 |
| string-based model | 0.0740 | 0.0774 |
| hadron gas model | 0.0732 | 0.0766 |