Vortex phase transformations probed by the local ac response of Bi2Sr2CaCu2O8+δ single crystals with various doping
Abstract
The linear ac response of the vortex system is measured locally in Bi2Sr2CaCu2O8+δ crystals at various doping, using a miniature two-coil mutual-inductance technique. It was found that a step-like change in the local ac response takes place exactly at the first-order transition (FOT) temperature determined by a global dc magnetization measurement. The line in the - phase diagram becomes steeper with increasing doping. In the higher-field region where the FOT is not observed, the local ac response still shows a broadened but distinct feature, which can be interpreted to mark the growth of a short-range order in the vortex system.
The vortex phase diagram of the highly-anisotropic high- superconductor Bi2Sr2CaCu2O8+δ (BSCCO) has been intensively studied in the past few years. In superconductors, strong supercurrents flow near the surface, which produce nonuniform magnetic-field distribution in the sample. Such nonuniformity broadens the thermodynamic phase transitions and thereby hinders the study of the phase diagram. Also, the surface (or edge) currents produce a geometrical barrier [2] in flat samples at low fields, which gives rise to a hysteretic behavior [3]. In higher fields, the Bean-Livingston surface barrier is known to be strong in BSCCO and this makes the global properties of the vortex system complicated [4]. A useful way to get rid of the effects of the surface and the magnetic-field nonuniformity is to measure the electromagnetic properties locally. There have been a number of efforts along this line [3, 4, 5, 6, 7, 8], and the true nature of the vortex phases of BSCCO is beginning to be fully understood. For example, local magnetization measurements using microscopic Hall probes have found, quite conclusively, the presence of a first-order transition (FOT) of the vortex system [5]. With the improvement of instrumentation and crystal quality, it has become clear that the first-order transition can also be determined as a step in the global dc magnetization measured with SQUID magnetometer [9, 10, 11].
The miniature two-coil mutual-inductance technique [12] has been used for the study of the vortex phase diagram of BSCCO [7, 8]. With this technique, a small ac perturbation field is applied near the center of the crystal and therefore the the surface barrier, which hinders vortex entry and exit at the edge, has minimal effect on the measured response. Because of this advantage, a sharp distinct change in the local ac response has been observed [7, 8] and such a feature has been associated with a decoupling transition [13, 14, 15] of the vortex lines. It is naturally expected that the “decoupling line” thus determined is identical to the FOT measured by dc magnetization measurements, although there has been no direct comparison between the two phenomenon measured on an identical sample. Since it is known that the first-order transition in the dc magnetization has a critical point and thus disappears above a certain field [5], it is intriguing how the “decoupling” signal of the miniature two-coil technique transforms at higher fields, above the critical point. In fact, the nature of the vortex matter in the field range above the critical point is still controversial [16, 17, 18]; since the ac technique can probe the growth of the correlation lengths of the vortex system [19], it is expected that the local ac measurement using the two-coil technique gives a new insight into the vortex phase transformations.
In this paper, we present the results of our miniature two-coil measurements and the global dc magnetization measurements on the same crystals. It is found that these two techniques detect the anomaly at the same temperature , directly demonstrating that the two phenomena are of the same origin. We measured crystals with three different dopings and confirmed that the result is reproducible among systems with different anisotropy. In higher fields where the FOT is not observed by the global dc magnetization measurement, a distinct feature is still observable in the local ac response and the position of such feature is weakly frequency dependent. We discuss that the frequency-dependent feature above the critical point is likely to originate from the growth of a short-range order in the vortex system.
The single crystals of BSCCO are grown with a floating-zone method and are carefully annealed and quenched to obtain uniform oxygen content inside the sample. We obtained three different dopings by annealing the crystals at different temperatures in air; annealing at 800∘C for 72 hours gives an optimally-doped sample with =91 K (sample A), 650∘C for 100 hours gives a lightly-overdoped sample with =88 K (sample B), and 400∘C for 10 days gives an overdoped sample with =80 K (sample C). All the samples have the transition width of less than 1.5 K. A tactful quenching at the end of the anneal is essential for obtaining such a narrow transition width. is defined by the onset temperature of the Meissner signal in the dc magnetization measurement. The crystals are cut into platelets with lateral sizes larger than 3 3 mm2 and the thickness of the samples are typically 0.02 mm. We used a very small (0.6 mm diameter) coaxial set of pickup and drive coils for our two-coil mutual-inductance measurements (see the inset to Fig. 1). The details of our technique have been described elsewhere [7, 19]. The amplitude of the drive current was 7.5, 7.5, and 1.0 mA for the measurements of samples A, B, and C, respectively. The linearity of the measured voltage with respect to was always confirmed. These produce the ac magnetic field of about 0.01 - 0.1 G at the sample. We emphasize that our two-coil geometry mainly induces and detects shielding currents flowing near the center of the sample, while usual ac-susceptibility measurements are most sensitive to shielding currents flowing near the edge of the sample. All the two-coil measurements are done in the field-cooled procedure. The global dc magnetization measurements are done with a Quantum Design SQUID magnetometer equipped with a slow temperature-sweep operation mode.
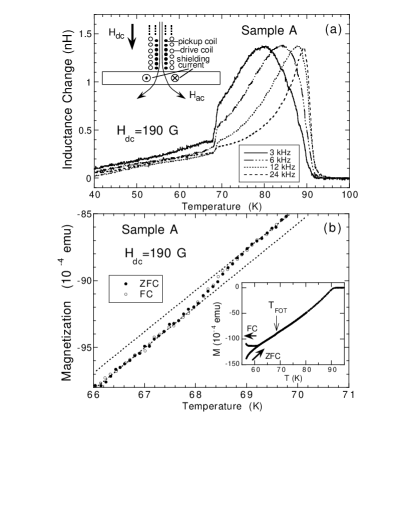
Figure 1(a) shows the temperature dependence of the in-phase signals of our two-coil measurement on sample A in 190 G, taken at various frequencies from 3 kHz to 24 kHz. To compare the signals from different frequencies, the data are plotted in the unit of inductance change. It is apparent that there is a frequency-independent step-like change at a temperature , which is 68.5 K here. The temperature dependence of the global dc magnetization in the same field is shown in Fig. 1(b), which shows that the FOT is taking place at exactly the same temperature as the step-like change in the two-coil signal.
According to the linear ac-response theory of the vortex system, the ac response is governed by the ac penetration depth [20, 21]. in our configuration is related to the in-plane resistivity in the manner =Re [19]. It has been reported that the apparent resistivity measured in the mixed state of BSCCO is largely dominated by the surface current [4]. Recent measurement of the bulk and surface contributions to the resistivity found [22] that the bulk contribution shows a sharp change at the FOT, while the surface contribution is governed by the surface barrier and shows a broader change. Since our measurement is not sensitive to the edge current, it is expected that of our measurement reflects mainly the bulk resistivity. Therefore, the step-like change in the local ac response is most likely to originate from the reported sharp change in the bulk resistivity [22]. We note that there has been a confusion about the origin of the step-like change in the local ac response measured by the miniature two-coil technique and it was discussed that the source of the sudden change may be related to a change in the -axis resistivity [7, 8].

Figure 2(a) shows the dependence of the in-phase signals of our two-coil measurement on sample A in three different magnetic fields. We observed that the sharp step-like change in the two-coil signal becomes broadened when the magnetic field exceeds a certain limit ; in the case of sample A, the step-like change is observed in up to 400 G, but becomes broadened at 500 G. It was found that this corresponds to the magnetic-field value at the critical point of the FOT; namely, the FOT in the dc magnetization measurement also disappears in fields above . Figures 2(b) and 2(c) show that the FOT is observed in the dc magnetization at 400 G but is not detectable at 500 G. This is also a clear evidence that the origin of the step-like change in the two-coil signal is the FOT.
In Fig. 2(a), the 500-G data do not show a step-like change, but clear changes in the slope at two separate temperatures, and , are discernible. The signal changes much rapidly between and compared to the temperatures outside of this region, so the data look like that the step-like change at is broadened to the temperature region of . Figure 3 shows the in-phase signals of sample A in 600 G, which is above , taken at various frequencies. Apparently, and inferred from the 600-G data change with frequency, although the change is small. This indicates that and do not mark a true phase transition but mark a crossover.

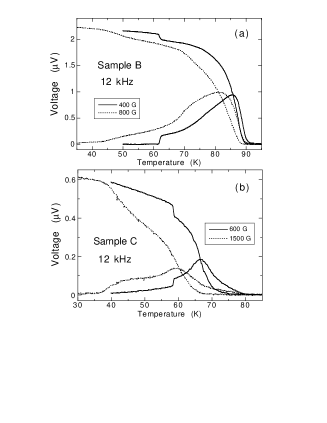
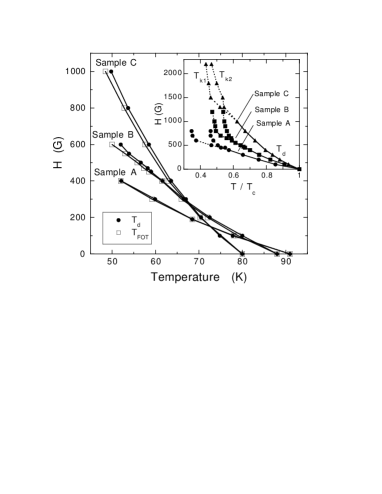
Figures 4(a) and 4(b) show the in- and out-of-phase signals of samples B and C, respectively, in two selected magnetic fields below and above . Also in these two samples, the dependence of the two-coil signals show a step-like change in magnetic fields below , while the change is broadened in . Figure 5 shows the lines for the three samples determined by our two-coil measurements. Clearly, the line tends to be steeper for more overdoped samples. The data obtained from the dc magnetization are also plotted in Fig 5; apparently, and agree very well in all the three samples. The inset to Fig. 5 shows the lines together with the and lines at higher fields (determined with 12 kHz), plotted versus normalized temperature . The and lines are much steeper compared to the line.
After the existence of the first-order transition of the vortex system in BSCCO has been established [5], much efforts have been devoted to the clarification of the details of the phase diagram. There have been accumulating evidences that the FOT line is a sublimation line, at which a solid of vortex lines transforms into a gas of pancake vortices [23, 24]. In the - phase diagram, there are two lines other than the FOT line, called “depinning line” and the “second-peak line” [25]. The three lines merge at the critical point; the depinning line separates the low- and high-temperature regions at fields above and the second-peak line separates the high- and low-field regions at low temperatures. Apparently, our and lines are very similar to the depinning line; thus, an examination of the and lines is expected to give an insight into the nature of the depinning line.
Since the step-like change at marks an abrupt onset of the long-range correlation in the vortex system, the broadened change between and is expected to indicate an increase of a (short-range) correlation in the vortex system. In general, a probe with higher frequency looks at physics at shorter length scale [26]; in the case of our local ac response, is smaller for larger . With decreasing temperature, it is expected that the local ac response shows a qualitative change when the -axis correlation length of the vortex system starts to grow, and another qualitative change at a lower temperature is also expected when becomes comparable to . This is one possible scenario for what is happening at and . The facts that and are dependent on frequency and that a higher frequency gives a higher apparent are consistent with the above scenario.
Recently, Fuchs et al. used the change in the surface-barrier height for the determination of the vortex phase transformations [16] (note here that the surface barrier is different from the geometrical barrier which is only effective at low fields near ) and the presence of a new transition line, line, at temperatures higher than the depinning line (and above the FOT line) was suggested. Since it is almost clear that the vortex phase above the FOT line is a gas of pancake vortices at temperatures higher than this new line [16], the existence of the line implies that the depinning line separates a highly disordered entangled vortex solid (low-temperature side) from either (a) disentangled liquid of lines with hexatic order or (b) some kind of solid which consists of an aligned stack of ordered two-dimensional pancake layers [16]. Our data suggests that the latter possibility (b) is more likely, because the growth of the short-range correlation between and has a natural meaning of a growth of the alignment of the pancake layers in the latter picture. Note that we did not observe any feature which can be associated with the line; this is reasonable because the line only manifests itself in a change in the surface barrier, which has little effect on our measurement.
Finally, let us briefly discuss the magnetic-field dependence of . As has been reported [7, 8], the line measured with the two-coil technique can be well fitted with the formula for the decoupling line [13, 14, 15]. This is actually a matter of course, because our line is identical to the line and the FOT is most likely to be a sublimation transition, which is essentially a decoupling transition. Fittings of our data to the decoupling formula [13, 14] give the anisotropy ratio of 100, 85, and 77 for samples A, B, and C, respectively (the prefactor is given by , where 0.1 is a constant, =15 is the spacing between the bilayers, and 2000 is the penetration depth).
In summary, we measured the local ac response of three BSCCO crystals (optimally doped, lightly overdoped, and overdoped samples) using a miniature two-coil technique and compared the result with a global dc magnetization measurement. The origin of the step-like change in the two-coil measurement is identified to be the first-order transition (FOT), where the bulk resistivity (which is free from the edge contribution) is reported to show a sharp change [22]. The sudden step-like change in the two-coil signal starts to be broadened at fields above , where the FOT is no longer observed. This broadened change takes place between and and these two temperatures are still well defined, although they are frequency dependent. We discuss that the observation of the feature at and is likely to indicate the growth of a short-range correlation of the vortex matter, which gives a clue to identify the nature of the depinning line.
REFERENCES
- [1]
- [2] E. Zeldov et al., Phys. Rev. Lett. 73, 1428 (1994); Th. Schuster et al., Phys. Rev. Lett. 73, 1424 (1994).
- [3] D. Majer, E. Zeldov, and M. Konczykowski, Phys. Rev. Lett. 75, 1166 (1995).
- [4] D.T. Fuchs et al., Nature 391, 373 (1998).
- [5] E. Zeldov et al., Nature 375, 373 (1995).
- [6] T. Tamegai et al., Phys. Rev. B 45, 8201 (1992).
- [7] Y. Ando et al., Phys. Rev. B 52, 3765 (1995); 59, 6563(E) (1999).
- [8] R.A. Doyle et al., Phys. Rev. Lett. 75, 4520 (1995).
- [9] H. Pastoriza et al., Phys. Rev. Lett. 72, 2951 (1994).
- [10] T. Hanaguri et al., Physica C 256, 111 (1996).
- [11] S. Watauchi et al., Physica C 259, 373 (1996).
- [12] B. Jeanneret et al., Appl. Phys. Lett. 55, 2336 (1989).
- [13] L.I. Glazman and A.E. Koshelev, Phys. Rev. B 43, 2835 (1991).
- [14] L.L. Daemen et al., Phys. Rev. B 47, 11291 (1993).
- [15] R. Ikeda, J. Phys. Soc. Jpn. 64, 1683 (1995).
- [16] D.T. Fuchs et al., Phys. Rev. Lett. 80, 4971 (1998).
- [17] E. M. Forgan et al., Czech. J. Phys. 46, 1571 (1996).
- [18] B. Horovitz and T.R. Goldin, Phys. Rev. Lett. 80, 1734 (1998).
- [19] Y. Ando et al., Phys. Rev. B 50, 9680 (1994).
- [20] E.H. Brandt, Phys. Rev. Lett. 67, 2219 (1991).
- [21] M.W. Coffey and J.R. Clem, Phys. Rev. B 46, 14662 (1992).
- [22] D.T. Fuchs et al., Phys. Rev. Lett. 81, 3944 (1998).
- [23] Y. Matsuda, Phys. Rev. Lett. 78, 1972 (1997).
- [24] D.T. Fuchs et al., Phys. Rev. B 55, R6156 (1997).
- [25] B. Khaykovich et al.. Phys. Rev. Lett. 76, 2555 (1996).
- [26] D.S. Fisher, M.P.A. Fisher, and D. Huse, Phys. Rev. B. 43, 130 (1991).