[
Extended Self-similarity in Kinetic Surface Roughening
Abstract
We show from simulations that a limited mobility solid-on-solid model of kinetically rough surface growth exhibits extended self-similarity analogous to that found in fluid turbulence. The range over which scale-independent power-law behavior is observed is significantly enhanced if two correlation functions of different order, such as those representing two different moments of the difference in height between two points, are plotted against each other. This behavior, found in both one and two dimensions, suggests that the “relative” exponents may be more fundamental than the “absolute” ones.
pacs:
PACS:47.27.-i; 05.40.j; 47.27.Gs; 83.20.Jp]
Scale-invariant spatio-temporal behavior is observed in a wide variety of far-from-equilibrium systems. In analogy with the “universality” found in the equilibrium scaling behavior of systems near a second-order phase transition, it is interesting to enquire about the similarities between different non-equilibrium systems exhibiting scale-invariant behavior. In this paper, we point out a remarkable similarity between the scaling behavior of two well-known and extensively studied non-equilibrium systems – turbulent fluids and growing interfaces. Krug [1] discovered a similarity between the intermittent multiscaling behavior of structure functions in strongly developed turbulence [2, 3] and the scaling properties of correlation functions of height fluctuations in simple solid-on-solid models of kinetically rough epitaxial growth [4] with limited surface mobility. The multiscaling properties of these growth models have been subsequently investigated in detail [5] and a mechanism for this behavior has been proposed [6]. In this paper, we demonstrate that the extended self-similarity (ESS) [7] exhibited by the structure functions in fluid turbulence is also present in the behavior of correlation functions of height fluctuations in these growth models, and thereby establish that the analogy between deterministic turbulence in fluids and stochastically driven interface growth is remarkably deep. We emphasize that the ESS phenomenology in our discrete stochastic growth model is formally identical to that found in the intermittent fluid turbulence problem, establishing a precise one to one correspondence between these two seemingly completely different physical processes. While the exact reasons for this precise analogy between these two distinct problems remain unclear at this stage, we speculate that the existence of an infinite number of relevant (marginal) operators in both cases may be the underlying mathematical cause for this analogy [6].
We begin by pointing out the analogy [1] between fluid turbulence and surface growth. In fully developed turbulence, scaling behavior is observed in the inertial range , where is the length scale of interest, is the outer integral scale at which energy is injected into the system and is the inner dissipation scale. A measure of the separation between the inner and outer scales is provided by the Reynolds number . The -th order longitudinal structure functions are defined as
| (1) |
where is the component of the velocity at the position at time in the direction of the relative displacement , and the brackets represent a spatio-temporal average. These structure functions are believed to exhibit power-law scaling in the inertial range:
| (2) |
The value of is known [3] to be exactly unity. The measured values of differ appreciably from the Kolmogorov result [3], , the deviation being positive for and negative for . This is the phenomenon of multiscaling which is believed [2, 3] to arise from the strongly intermittent (violently fluctuating) character of the local energy dissipation rate whose spatio-temporal fluctuations may be characterized by the quantities . These quantities are expected to exhibit a power-law dependence on the Reynolds number:
| (3) |
where for .
In models [1, 4, 5, 6] of growing interfaces, the role of the velocity field is played by the variable that represents the height of a -dimensional interface at point at time . In these models, the inner length scale is the lattice spacing which is usually set to unity. The outer scale is set by a correlation length that initially grows in time ( where is the dynamic exponent) and eventually saturates (for where is the system size) to a value of the order of . Scale-independent behavior of correlation functions is observed for length scales . The correlation length , therefore, plays the role of the Reynolds number. The height-difference correlation functions
| (4) |
where now represents a spatial average, are analogous [8] to the structure functions defined in Eq.(1). These correlation functions exhibit the following scaling behavior:
| (5) |
The observation [1, 5, 6] that is a decreasing function of indicates that these correlation functions exhibit multiscaling similar to that found in turbulence. The quantity that is analogous to the energy dissipation rate is the nearest-neighbor height difference where is a nearest neighbor of the lattice point . In analogy with Eq.(3), different moments of scale with different powers of the correlation length :
| (6) |
In experimental and numerical studies of turbulence at relatively low Reynolds numbers, the range of values of for which the power-law scaling of Eq.(2) is observed is often very small and sometimes non-existent. ESS in turbulence refers to the fact [7] that the size of the scaling region is significantly enhanced if is plotted against . Since the result in the inertial range is exact for the Navier-Stokes equation underlying fluid turbulence and log-log plots of against show linear behavior over a substantially larger range than log-log plots of against , ESS plots provide a convenient way of determining the values of the multiscaling exponents . ESS has been used extensively [9] during the last few years [10, 11, 12] to analyze the data obtained from a variety of experiments and simulations. Substantial enhancement of the scaling region has also been observed in log-log plots of vs where and are any two unequal positive integers. The observation of ESS implies that the self-similarity of the velocity field extends beyond the conventionally defined inertial range.
We have found that the correlation functions of height fluctuations in the Das Sarma-Tamborenea (DT) model [4] of epitaxial growth in one and two dimensions exhibit properties that are very similar to the ESS described above. Krug’s original work [1] on intermittent multiscaling in epitaxial growth was based on the one-dimensional (1d) DT model. In this model, atoms are deposited randomly on a flat substrate under solid-on-solid condition. If a deposited atom has at least one lateral neighbor, it stays at that site. Otherwise, the atom moves to a nearest-neighbor lateral site if it can increase the number of lateral neighbors by doing so. If more than one such sites are available, then the atom moves to any one of them with equal probability. If no such nearest-neighbor site is available, the atom stays at the deposition site. These rules are illustrated in the inset of Fig.1.
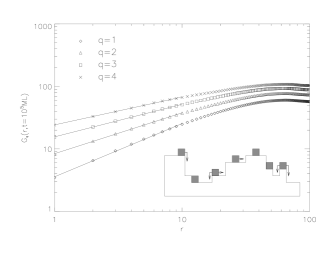
We first consider the scaling properties of the correlation functions defined in Eq.(4). Fig.1 shows the results for at time (in units of number of layers deposited) for the 1d DT model with size = 1000. The log-log plots of against clearly show linear behavior for small , in agreement with the power-law form of Eq.(5). The values of the exponents obtained by fitting straight lines to the initial linear parts of the plots are: , , , and . The size of the scaling region is, however, rather small (less than one decade in ). This is not surprising because the value of the correlation length 4 [1, 4], is the order of 15 at . The new and surprising result we find is that the data exhibit nearly perfect power-law scaling over the entire range if is plotted against (see Fig.2). Since there is

no “special” value of in the growth model (in the sense that is special in turbulence), we have chosen to plot the correlation functions for against – other choices lead to equally good scaling. It is clear from Fig.2 that the range over which scaling behavior is observed is increased by more than an order of magnitude if one of the correlation functions is plotted against the other, rather than plotting them as functions of . This model, therefore, exhibits ESS that is formally identical to that found in turbulence by Benzi et al [7]. The extension of the scaling range is mostly towards large scales, which is similar to the behavior found [13] in turbulence.
The quality of the power-law scaling in the versus plots is illustrated in the upper inset of Fig.2 for , where we have shown the variation of the local derivative with . The observed variation is less than 10%, indicating that the power-law relation, , provides a very good description of the data over the full range of . The values of the “relative” exponents , obtained from straight-line fits to the plots of Fig.2, are: , , and . These values are consistent with the expected result, . The upper inset of Fig.2 also shows the local slope of a log-log plot of versus obtained in the saturation state of samples with = 100. The two sets of results are nearly indistiguishable, showing that the values of the exponents obtained from ESS plots are not sensitive to details such as sample size and the length of the simulation. Similar “universality” (i.e. insensitivity of the values of the relative exponents to details such as the value of the Reynolds number and the flow geometry) has been observed in turbulence [11, 12].
The observation of ESS implies a specific relation among the scaling functions [1] that describe the behavior of the correlation functions . The dependence of on and in the regime is expected to be described by the scaling form [1]
| (7) |
The occurrence of ESS is possible only if the scaling functions are related to one another by . This relation, when combined with Eq.(7), leads to the prediction that plots of the quantity against should coincide for all values of . The lower inset of Fig.2 shows plots of (obtained from the data shown in Fig.1, using the values 0.870, 0.673, 0.540 and 0.452 for , respectively) against for . The data for different collapse nicely to the same curve, confirming the occurrence of ESS in this system. A similar description of ESS in turbulence in terms of a -independent scaling function is provided in Ref.[10].
The behavior described above is also found in the 2d DT model, as shown in Fig.3, where we have plotted against (inset),

and against (main part) on log-log scales. The data shown correspond to [5] for 500500 samples. We again find an extension of the scaling region by more than one decade. The values of the exponents obtained from fits to the data are: , , . As before, the relation is satisfied within the error bars.
We have also found ESS in the dependence of the quantities defined in Eq.(6) on time (in the growth regime) or the sample size (in the saturation regime).

The inset of Fig.4 shows our data for the dependence of at saturation on in the 2d DT model. The log-log plots clearly show a downward curvature (similar curvature is observed [5] in log-log plots of versus in the growth regime) that becomes more pronounced as is increased. In contrast, the ESS plots of against , shown in Fig.4, do not exhibit any such curvature. The values of the “relative” exponents , defined by , obtained from straight-line fits to the the ESS plots are: , , .
The results shown in Fig.4 and qualitatively similar behavior found in the 1d DT model [1, 5] clearly indicate that the DT model does not exhibit true asymptotic multiscaling. This conclusion is corroborated by recent studies [6] which suggest that the approximate multiscaling observed in these models is a non-universal and extremely slow transient or crossover arising from a non-linear instability in the discretized version of the underlying continuum growth equation. The ESS found in this paper shows that the slow crossover responsible for the approximate multiscaling behavior affects correlation functions of different order in exactly the same way. In this picture, the multiscaling exponents and are, at best, effective ones describing the behavior over a limited range of length and time scales. The occurrence of ESS implies that “relative” exponents such as and are, in some sense, more fundamental than the “absolute” ones, and . While it would be premature to suggest that a similar transient description applies also to multiscaling in turbulence, we note that the possibility that the intermittency corrections are finite Reynolds number effects which would vanish in the asymptotic limit has received considerable attention [14] in the recent literature. Also, there is some numerical evidence [15] indicating that the “relative” exponents are more universal than the “absolute” ones in turbulence.
Our finding that ESS may occur in problems (i.e. in the kinetic surface roughening of the DT model) very different from the fully developed homogeneous turbulence problem (where ESS was originally discovered [7]) is potentially significant, and may eventually provide a clue to its understanding. Currently the ESS phenomenon (both in surface growth and turbulence) remains an interesting empirical fact without any rigorous theoretical understanding. It has recently been shown [6] that multiscaling in the DT model shares a substantial common phenomenology with that in fully developed turbulence, and the intermittent multiscaling behavior in these very different problems may arise [6] from the existence of an infinite number of marginal operators and an associated near-singularity in both problems. We speculate that the eventual theoretical understanding of ESS will depend on a more detailed understanding of the roles that the infinite number of relevant operators and the near-singularities play in homogeneous turbulence and kinetic surface roughening. It would obviously be very interesting to explore further the analogy between kinetically rough interfaces and fluid turbulence.
We are grateful to Prof. Rahul Pandit for educating us on ESS in turbulence. This work was supported in part by US-ONR and the Supercomputer Education and Research Center of Indian Institute of Science.
REFERENCES
- [1] J. Krug, Phys. Rev. Lett. 72, 2907 (1994); Adv. Phys. 46, 139 (1997).
- [2] D. Lohse and S. Grossmann, Physica (Amsterdam) 194A, 519 (1993); K. R. Sreenivasan and R. A. Antonia, Ann. Rev. Fluid Mech. 29, 435 (1997).
- [3] U. Frisch, Turbulence (Cambridge University Press, Cambridge, 1995).
- [4] S. Das Sarma and P. Tamborenea, Phys. Rev. Lett. 66, 325 (1991); P. Tamborenea and S. Das Sarma, Phys. Rev. E 48, 2599 (1993).
- [5] S. Das Sarma et al, Phys. Rev. E 53, 359 (1996); S. Das Sarma and P. Punyindu, Phys. Rev. E 55, 5361 (1997).
- [6] C. Dasgupta et al, Phys. Rev E 54, R4552 (1996); Phys. Rev. E 55, 2235 (1997).
- [7] R. Benzi et al, Phys. Rev. E 48, R29 (1993); Europhys. Lett. 24, 276 (1993); G. Stolovitzky and K. R. Sreenivasan, Phys. Rev. E 48, R33 (1993).
- [8] In contrast with Eq.(1), the -th root is included in the definition of in order to maintain conformity with the definitions used in earlier work [1, 5, 6].
- [9] In actual applications of ESS to determine the values of the exponents , a different third-order structure function, defined by the average of the third power of the magnitude of the velocity difference, is used instead of the defined in Eq.(1). All the correlation functions used in our study of ESS in growth models involve different moments of the magnitude of height differences.
- [10] R. Benzi et al, Physica (Amsterdam) 80D, 385 (1995).
- [11] F. Belin, P. Tabeling and H. Willaime, Physica (Amsterdam) 93D, 52 (1996).
- [12] A. Arneodo et al, Europhys. Lett. 34, 411 (1996).
- [13] S. Grossmann, D. Lohse and A. Reeh, 1997 preprint, Chao-dyn 9705014.
- [14] V. S. L’vov and I. Procaccia, Phys. Rev. Lett. 74, 2690 (1995), and references therein.
- [15] E. Leveque and Z.-S. She, Phys. Rev. Lett. 75, 2690 (1995); N. Cao, S. Chen and Z.-S. She, Phys. Rev. Lett. 76, 3711 (1996); S. Dhar et al, Phys. Rev. Lett. 78, 2964 (1997).