Energetic and spatial bonding properties from angular distributions of ultraviolet photoelectrons: application to the GaAs(110) surface
Abstract
Angle-resolved ultraviolet photoemission spectra are interpreted by combining the energetics and spatial properties of the contributing states. One-step calculations are in excellent agreement with new azimuthal experimental data for GaAs(110). Strong variations caused by the dispersion of the surface bands permit an accurate mapping of the electronic structure. The delocalization of the valence states is discussed analogous to photoelectron diffraction. The spatial origin of the electrons is determined, and found to be strongly energy dependent, with uv excitation probing the bonding region.
pacs:
PACS numbers: 79.60.-i, 61.14.Dc, 73.20.AtAngle-resolved ultraviolet photoemission spectroscopy (ARUPS) is probably the most powerful single experimental technique for studying the valence electronic structure of solids. However, until recently, ARUPS has been primarily limited to investigating the positions in energy of valence bands along a few high-symmetry directions in reciprocal space. That is, the intensity of the photoemission peaks was usually not analyzed quantitatively, and most of the information in the full hemisphere above the surface was lost. One reason for this limitation in ARUPS studies is the lack of any simple rules for explaining such valence spectra beyond those that have been found useful for mapping bands in energy. The most often applied model in ARUPS is that of direct (wave-vector-conserving) transitions between bulk bands[1], with the final state often being simplified to a plane wave[2]. Beyond this, free-electron final states with atomic-like optical transitions[3] and final-state scattering of electrons emerging from a localized core orbital[4] have been used to better understand the resulting angular distributions in photoemission. The interest in such angular distributions of intensity has recently been stimulated by the measurement of full-hemisphere intensity maps in ARUPS[5, 6, 7, 8, 9, 10], with the data being analyzed so far using plane-wave final states[6], single scattering[7], bulk bands[8], and atomic-like transitions[9], as well as the one-step model[11, 12]. The most accurate description of valence ARUPS involves calculations within this one-step model and includes the precise optical matrix elements, full multiple scattering, the explicit presence of the surface potential, and the resulting more complex initial and final states. However, there has to date been no systematic treatment of the angular distribution of intensity within such a model.
In this Letter, we quantitatively investigate the influence of the initial state and its charge distribution on the angular distribution of intensity in ARUPS, using the one-step model. We demonstrate that the combined consideration of both energy positions and intensity patterns will be necessary for the most useful interpretation of angle-scanning data, and point out the additional information that can be derived in this way. For our calculations and measurements, azimuthal scans are chosen, which allow a high accuracy in the visualization of the angular distribution. A generalization of the x-ray photoelectron diffraction (XPD) picture is found to lead to a more unified view of the electronic structure in both direct and reciprocal space. The GaAs(110) surface is chosen as a well-understood test case[13, 14, 15, 16] for which it will become evident that the photoemission patterns reveal not only the surface density of states (SDOS) but also provide insight into the charge density of the bonds. This contributes to a common understanding of ARUPS and XPD angular distributions.
Our interpretation of photoelectron emission proceeds via the construction of the photoelectron state with energy , which can be written at the detector located in the direction of the polar () and azimuthal () emission angles as
| (1) |
where is the SDOS, is the propagator, is the vector potential, and is the momentum operator[4]. The initial state, depending on the energy and , is split into the factor of the SDOS and the wave function . This formula is used for the following discussion of the electronic and spatial structure. Other influences like selection rules, the density of the final state, or resonances of direct volume transitions are not explicitly apparent, but they are all included in Eq. (1) and in a one-step calculation for which Eq. (1) is transformed to a golden rule formula. There is principally no difference in the validity of applying the one-step model to both ARUPS or XPD. In Eq. (1), contributes to the band mapping, and, as noted above, is often the only thing considered in most analyses to derive experimental band structures. describes the electron scattering from the point of excitation through the crystal to the detector. In XPD this scattered electron can be simply thought as being emitted from a localized initial state; here the general case arises to treat emission from delocalized valence states. The source of the scattered electron is no longer the vicinity of a core but the entire initial state wave function. The wave amplitude in Eq. (1) gives the local emissivity, depending on the spatial position, initial energy, parallel momentum, and, together with the radiation polarization, the angular momentum composition.
As a test of this interpretation, we investigate azimuthal distributions of the photocurrent above GaAs(110) in terms of the electronic and geometric structure of the participating states. The calculation of the photocurrent within the one-step model proceeds along the lines described elsewhere[13, 11]. The spectra were measured with unpolarized HeIα radiation ( eV) with the energy resolutions set to meV and, for testing purposes, to meV, which gave negligible differences. The scans were taken with an angle resolution of by use of a spherical electron analyzer, which is movable around two independent axes. These degrees of freedom permit taking angle scans without moving the sample and allow studying the influence of the incoming light and separating such effects from other processes.
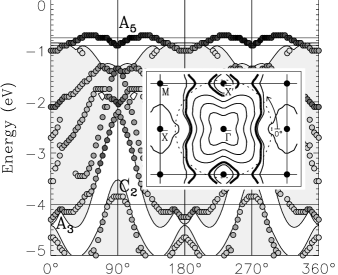
Two cases are studied here: At eV there is a dangling-bond state (A5), that is a surface state lying outside the projected bulk bands, and at eV there are two resonances, the Ga back-bond state (C2) and the A3 state. To get a broad view off the high symmetry points, we consider a circle in the Brillouin zone with a radius of Å-1, corresponding to the measurement angles at both energies. The surface band structure along this circle is shown in Fig. 1 together with the projected bulk band structure. The energy contour plot in the inset of Fig. 1 exhibits the symmetry of the A5 state; this surface has only a mirror plane, but as an additional symmetry, an inversion symmetry occurs in the electronic structure due to Kramer’s degeneracy .
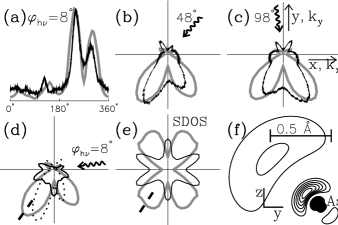
For a detailed discussion of the electronic and geometric influences on the photocurrent, the effect of the incident light on these spectra must be known first. With a fixed polar angle of incidence and the use of unpolarized light, an asymmetry remains only due to the azimuthal direction of the light. Here, enhancements and azimuthal peak shifts are weak, as shown in Figs. 2 (a)–(c). These influences can be discriminated from the strong differences in the current between positive and negative directions.
For this A5 state, a comparison of the photocurrents in Figs. 2 (a)–(d) with the SDOS in Fig. 2 (e) shows that the SDOS controls the overall structure in the current. The number and the azimuthal positions of the lobes are the same for the SDOS and the current, but differences occur in intensities and in smaller structures. There are broad lobes in the SDOS and the current, but instead of maxima as for the SDOS on a fine scale, the current displays only maxima. Figs. 3 (a) and 3 (b) for the C2+A3 state show the same overall correspondence and differences in intensities. The SDOS used here is the partial density of states of the orbitals from the uppermost atomic layer. The power of the SDOS for accurate investigations of the energetic structure is demonstrated with the emission from the A5 state. Here, this excellent agreement between experimental and theoretical currents could only be achieved with a small shift in the corresponding binding energies by eV, but the effect of this energy shift is remarkable, as shown in Fig. 2 (d). The main reason for this difference should be attributed to the calculated surface band structure, though the inaccuracy is still in the usual range of common theoretical uncertainty[16]. The strong variation of the shape in Fig. 2 (d) reflects the changes in the SDOS in Fig. 2 (e). This is obviously caused by the flat dispersion of the band which is shown in Fig. 1. Thus the number, position and intensity of the lobes in the current and SDOS depend very sensitively on details of the band structure. Small shifts in the energy cause not only shifts in the accompanying peaks, but can give rise to strong changes of the entire pattern. This allows an accurate determination of the band structure by comparing experimental with theoretical scans. The usual simpler approach of identifying the maxima in the current as band positions, would fail here to give even the correct number: For the A5 state the band is hit times (cf. inset in Fig. 1), which corresponds to the maxima in the SDOS, but the current in Fig. 2 has only maxima, and one would overlook half of the band positions.
In contrast to the electronic structure, inversion symmetry is lacking in the photocurrent. To understand this, we have to consider in addition to the SDOS also the wave function of the initial state, which are calculated in a LCAO basis. For the dangling-bond A5 band, the asymmetry between the intensities in positive and negative directions corresponds to the direction of the bond. The dangling bond points along the negative direction and into the vacuum in the direction, as shown in Fig. 2 (f) by the contour plot of a As-charge density. Since the density is located above the uppermost As atoms, there is only weak potential scattering for a major part of the excited electrons. Therefore, the SDOS and the initial state wave function dominate the angular distribution, and a free final plane wave may be a sufficient description. The dotted current in Fig. 2 (d) shows how well this approximation does in reproducing the general asymmetry. Because a Fourier transformation of a spherical harmonic reproduces the same spherical harmonic and because of the simple spatial and angular momentum structure of the dangling-bond state, the asymmetry of the current can be identified here with that of the charge distribution. Such a connection has already been assumed in a former ARUPS analysis[17], and it is quantitatively proven here. As a result, the photoemission intensities reflect directly the energetic and spatial density of the initial A5 state. However, this simplicity is not a general rule, as we will illustrate for our C2+A3 case at eV.
To achieve further insight into the influence of the initial state, the importance of different parts of the emitting volume is investigated in a novel way. Apart from the charge density maxima in the bonding region the initial wave functions also have charge peaks closer to the cores, as shown in Fig. 2 (f) and Fig. 3 (f). In the present case, three areas are separated by almost spherical nodal surfaces. The separate contributions to the current from each of these regions are calculated by setting the initial wave function to zero in the other two areas. Contributions for the emissions from eV are shown in Figs. 3 (d)+(e). From the localized middle region arises less than of the total current for both studied binding energies. Contributions from the innermost area are even smaller and completely negligible. With a free final state for simplicity we have repeated these calculations for kinetic energies up to eV. Below eV only contributions from the outer volume are notable, but at eV the current from the middle area becomes appreciable. This middle area dominates above eV, and constitutes the current above eV. The spatial scale detected by photoelectrons may be discussed in close analogy to the energy dependence of common scattering processes where high wave vector Fourier components probe the more rapidly varying wave functions near the core. Usually with increasing energies shrinking vicinities of the cores are studied.
At eV, neither the number nor the position of the lobes nor the asymmetry in the intensities is reproduced with a final plane wave, as shown in Fig. 3 (c). Only the inclusion of scattering provides the asymmetry in the intensities, as the excellent agreement in Fig. 3 (a) between experiment and theory shows. Therefore, the simple argument with the Fourier transformation as in the A5 case does not work. We trace the origin of the intensities into the details of the calculation. Although the A3 state extends over 4 atomic layers, of the electrons are excited from the density around the uppermost As atom and from the bonds towards the next Ga atoms. The inversion asymmetry of the main peak at is caused by these bonds, whose unsymmetrical charge distribution is shown in Fig. 3 (f). This lack of the band-structure symmetry in the intensities generally seems to give a strong hint as to the asymmetry of the charge density.
The dependence of the spatial distribution on kinetic energy gives an additional feature of ARUPS from valence states and its relation to XPD. The importance of smaller spatial scales with increasing energy might be understood as a localization of an effective emitting source. At high energies this coincides with the observation that the XPD pattern from valence bands are nearly identical to those from the localized core states[18]. The common spatial origin of the excited electrons leads to similar currents since in the one-step model the final states are exactly the same. It should be noted that at these high energies the final state scattering is known to dominate over further details of the source wave[18, 19], and especially initial state interferences vanish on the average by the finite resolution[20]. Contrarily, at low kinetic energies valence states may contribute from regions where the localized core states vanish. These delocalized regions are the most important for both studied cases. Whereas with the effective localization at the core the XPD patterns reflect the geometry, ARUPS probes the bonding region with an intensity distribution showing information about the bonds. This is a new aspect for the interpretation of ARUPS data.
We have presented a joint treatment of the spectral and spatial features of ARUPS from the model surface GaAs(110). The azimuthal scans reflect in number and angular positions of the lobes the electronic structure given by the SDOS. By comparing measured and calculated currents, huge changes induced by dispersion allow an accurate determination of the SDOS. Even for unpolarized light there are strong additional intensity modulations, which are connected to the initial wave function. For an interpretation we adopted the XPD picture genralized to delocalized valence states. The amplitude of the initial state appears as the local emissivity for the spatially distributed source of the electrons to be scattered. Photoelectron spectroscopy is sensitive to different spatial parts of the initial state, depending on the kinetic energy. Ultraviolet photoemission detects the wave function in the bonding region outside the core, and the origin of photoelectrons are traced for the first time into single bonds. This opens new possibilities in the application and interpretation of ARUPS.
This work was supported in part by the Bundesministerium für Bildung, Wissenschaft, Forschung und Technologie and by the Materials Sciences Division of the U.S. Department of Energy, Contract No. DE-AC03-76SF0009.
REFERENCES
- [1] N. V. Smith, Phys. Rev. Lett. 23, 1452 (1969).
- [2] Z. Hussain, S. Kono, L.-G. Petersson, C. S. Fadley, and L. F. Wagner, Phys. Rev. B 23, 724 (1981).
- [3] J. W. Gadzuk, Solid State Commun. 15, 1011 (1974); Phys. Rev. B 12, 5608 (1975).
- [4] A. Liebsch, Phys. Rev. Lett. 32, 1203 (1974); Phys. Rev. B 13, 544 (1976).
- [5] A. Santoni, L. J. Terminello, F. J. Himpsel, and T. Takahashi, Appl. Phys. A 52, 299 (1991).
- [6] E. L. Shirley, L. J. Terminello, A. Santoni, and F. J. Himpsel, Phys. Rev. B 51, 13614 (1995).
- [7] J. Osterwalder, T. Greber, P. Aebi, R. Fasel, and L. Schlapbach, Phys. Rev. B 53, 10209 (1996).
- [8] E. L. Shirley, L. J. Terminello, J. E. Klepeis, and F. J. Himpsel, Phys. Rev. B 53, 10296 (1996); I. Jiménez, L. J. Terminello, D. G. J. Sutherland, J. A. Carlisle, E. L. Shirley, and F. J. Himpsel, Phys. Rev. B 56, (1997) (to be published).
- [9] H. Nishimoto, T. Nakatani, T. Matsushita, S. Imada, H. Daimon, and S. Suga, J. Phys.: Condens. Matter 8, 2715 (1996).
- [10] Th. Straub, R. Claessen, P. Steiner, S. Hüfner, V. Eyert, K. Friemelt, and E. Bucher, Phys. Rev. B 55, 13473 (1997).
- [11] C. Solterbeck, W. Schattke, and C. S. Fadley, Surf. Sci. 357-358, 245 (1996).
- [12] M. Lindroos and A. Bansil, Phys. Rev. Lett. 77, 2985 (1996).
- [13] J. Henk, W. Schattke, H.-P. Barnscheidt, C. Janowitz, R. Manzke, and M. Skibowski, Phys. Rev. B 39, 13286 (1989); J. Henk, W. Schattke, H. Carstensen, R. Manzke, and M. Skibowski, ibid. 47, 2251 (1993).
- [14] J. Braun and G. Borstel, Phys. Rev. B 48, 14373 (1993).
- [15] M. Skibowski and L. Kipp, J. Electron Spectr. Relat. Phenom. 68, 77 (1994).
- [16] M. Sabisch, P. Krüger, and J. Pollmann, Phys. Rev. B 51, 13367 (1995).
- [17] R. Manzke, H. P. Barnscheidt, C. Janowitz, and M. Skibowski, Phys. Rev. Lett. 58, 610 (1987).
- [18] D. Naumović, A. Stuck, T. Greber, J. Osterwalder, L. Schlapbach, Phys. Rev. B 47, 7462 (1993).
- [19] C. S. Fadley, in Synchroton Radiation Research: Advances in Surface and Interface Science, edited by R. Z. Bachrach (Plenum, New York, 1992), Chap. 9.
- [20] J. W. Gadzuk, Surf. Sci. 53, 132 (1975); H. Winter, P. J. Durham, and G. M. Stocks, J. Phys. F 14, 1047 (1984).