[
Self-Organized Criticality in Deterministic Systems with Disorder
Abstract
Using the Bak-Sneppen model of biological evolution as our paradigm, we investigate in which cases noise can be substituted with a deterministic signal without destroying Self-Organized Criticality (SOC). If the deterministic signal is chaotic the universality class is preserved; some non-universal features, such as the threshold, depend on the time correlation of the signal. We also show that, if the signal introduced is periodic, SOC is preserved but in a different universality class, as long as the spectrum of frequencies is broad enough.
]
I Introduction
Due to Nature’s inherent complexity, a lot of effort has gone into developing mathematical models to describe it, if only qualitatively [2, 3, 4, 5, 6, 7, 8, 9, 10, 11, 12, 13, 14, 15, 16, 17]. Among all natural processes, evolution has attracted a lot of attention because of its global consequences for life [18, 19]. Within the realm of evolution, one of the most fervidly argued topics is that of the explanation of mass extinctions [20]. Indeed, from a gradualistic point of view, mass extinctions are rare events, due mainly to external abiotic factors such as earthquakes, meteorites etc. [21]. From the point of view of punctuated equilibrium, on the other hand, mass extinctions are bursts of activity between periods of stasis [22, 23, 24, 25, 26]. The fossil record shows that the distribution of mass extinctions follows a power law [27]. Among the many models proposed to describe evolution, those exhibiting Self-Organized Criticality (SOC) [28, 29] are of particular interest. In layman terms, a system is called self-organized critical when it evolves towards a steady state in which certain physical quantities show fluctuations on any space and time scale (they follow power law distribution).
In particular, we will concentrate on a model for macroevolution proposed by Bak and Sneppen (BS) [26]. In it, extinctions are associated with avalanches of activity without an inherent time or length scale. In the original version of the model, no influence of the environment was taken into account if not implicitly in the fitnesses of the species. Later, Newman and coworkers [21] introduced a modified version of the BS model in which an environmental stress is introduced. All these versions of the model show self-organized criticality and the randomness in the microscopic rule seems to play a relevant role.
In this paper we show that, if one substitutes the random updating of the dynamic variable with a chaotic or a periodic map, SOC is not destroyed [30]. Some non-universal features will, however, depend on the time correlation of the signal. Moreover, if the signal introduced is periodic, SOC is preserved but in a different universality class, as long as the spectrum of frequencies is broad enough (a brief discussion of some of these results can be also found in [32]). Similar conclusions have been drawn in the context of standard fluctuation-dissipation processes by Bianucci et. al. [33, 34, 35]. The paper is organized as follows. In Sec. II we review the main features of the model as they are presented in the literature. After introducing the maps in Sec. III, we show in Sec. IV the results obtained for different deterministic updating rules. Our conclusions together with a brief description of some open problems can be found in Sec. V.
II General description of the model
The Bak-Sneppen model describes an ecosystem as a collection of species on a -dimensional lattice, each one of which can have traits associated to it [36]. To each one of these traits corresponds a fitness described by a number between and [37]. Here, for simplicity, we consider the case with one trait, , and periodic boundary conditions. To fix notation, we consider a one dimensional lattice of length . The initial state of the system is defined by assigning to each site a random fitness chosen from a uniform distribution. The dynamics proceeds in three basic steps:
-
1.
Find the site with the absolute minimum fitness on the lattice (this site will be called the active site) and its two nearest neighbors.
-
2.
Change, at the same time, the values of their fitnesses by assigning to them new random numbers from a uniform distribution.
-
3.
Go to step 1.
After an initial transient that will be of no interest to us, a non-trivial critical state is reached. This critical state, characterized by its statistical properties, can be understood as the fluctuating balance between two competing “forces”. Indeed, while the random assignation of the values, together with the coupling, acts as an entropic disorder, the choice of the minimum acts as an ordering force. As a result of this competition, at the stationary state the majority of the have values above a certain threshold . Only a few will be below , namely those belonging to the running avalanche (see [26, 40] for a detailed discussion). Since the avalanches are the basic and fundamental mechanism of the model it is therefore worth describing them in more general terms. Let us suppose that the system is already at stationarity and let us find the minimum fitness, say . We update it together with its two nearest neighbors (the actual value of the minimum does not really matter). This updating creates disorder in a small region in space, where most probably there are some lattice sites with . Then, the new minimum will most probably be among the last three sites changed. The active site most probably will be one of the two nearest neighbors, thus affecting another site to the left or to the right. In the following time-steps new sites will be touched by the avalanche of mutations. Here one sees clearly the two aforementioned forces at work: Disorder (every new value is chosen at random) and order (we decide to mutate always the smallest). Since the equilibrium drives the threshold to the value , this means that the –avalanche (an avalanche during which all the selected minima are below ) will eventually come to an end, in a finite time . During this process the –avalanche will also cover a certain number of lattice sites, i.e. it will also have a spatial size . This feature gives the possibility to analyze and find the critical values even without considering the system or lattice as a whole but simply analyzing the statistics of –avalanches [41]. Moreover, the avalanche dynamics shows that, as long as is close to the average size (both in time and space) of the related avalanches has to grow considerably. Both averages will eventually become infinite as , but this does not mean that all the avalanches are infinite (or of the maximal space or time lengths allowed by the simulations). These –avalanches can be described by means of a distribution function [26, 40]
| (1) |
In Eq. (1) is the time-size of the avalanche and is some yet unknown scaling function that behaves like
| (4) |
The average duration of an –avalanche is given by
| (5) |
where the exponent is given in terms of the previously defined exponents and by
| (6) |
Numerical calculations provide good estimates for the value of the threshold as well as the two exponents and [26, 40] (see Table 1). It is also useful to define other exponents that can be easily obtained from numerical simulations. First we consider the first return time distribution , namely the distribution of the times between two consecutive updatings of the same site (when it is the minimum). Another distribution function is the all return time distribution , namely the probability that a given site, active at time , is active again at time . In both cases, one defines the corresponding exponents by
| and | (7) |
In Table 1 we have listed the values of these exponents as they are given in the literature. It is worth noticing that these exponents are not independent quantities. Indeed, the scaling relations derived in [26, 40] show that at most two of them can be independent. However, using the master equation
| (9) | |||||
derived in [42] and the fact that and [26, 40], one proves that the only independent exponent of the model is of Eq. (7) [43]. From Eq. (9) one can also derive an infinite hierarchy of equations for the moments of the distribution. The first equation in this hierarchy
| (10) |
relates the exponents (6) to the average number of covered sites; here is the non-universal average number of sites covered by the -avalanches. Putting Eq. (5) into Eq. (10) gives the so called -equation [26, 40],
| (11) |
For models belonging to the same universality class i.e. with the same this equation relates the non-universal quantities and the threshold . In particular, as we shall see in Sec. IV A, to a bigger must correspond a smaller for fixed .
An interesting consequence of Eq. (11) is that it is possible to change
while remaining in the same universality class.
This can be
obtained by modifying the entropic tendency. Indeed substituting the random
updating with a correlated chaotic system one introduces a correlation that
leads to an increase towards of the threshold.
On the other hand, a greater correlation in the updating map means that the
system spends more time in the same site, thus covering less sites in the
same number of time-steps in comparison with a less correlated map.
From Eq. (11) it is clear that as decreases,
increases.
| quantity | value | error |
|---|---|---|
Table 1 The first four values exponents are quoted from [41] while the last two from [26, 40].
III Maps
As we have seen before, the source of mutations in the Bak-Sneppen model is the presence of random noise in the system. Since a chaotic map may exhibit statistical properties similar to those of random noise, a similar competition between order and disorder could be established when one substitutes random updating with chaotic updating. To understand the similarities as well as the differences between the two kinds of updating, in this section we discuss some general properties of maps.
A deterministic map is a rule in which the new value of the variable is given by
| (12) |
with a deterministic function and the lattice site. In what follows, we will only consider maps of the unit interval onto itself (usually called unimodular maps). Disregarding periodic trajectories, one can define several statistical quantities that are generally used to describe the properties of a generic sequence .
The first quantity of interest to us is the invariant measure, . Formally, the invariant measure for a unimodular map is defined by
| (13) |
If does not depend on the initial value , the map is called ergodic (and one refers to the measure as ). If a system is ergodic, time averages are equivalent to phase space averages, and then the time average of any function can be computed as a phase space average via
| (14) |
To describe the behavior of individual trajectories one needs more detailed information provided by the Lyapunov exponent . The Lyapunov exponent measures the average rate of separation in -space of two given trajectories per unit of time. It can be computed as
| (15) |
If a map has a Lyapunov exponent , this means that two trajectories will diverge from each other exponentially. In this case the map is called chaotic. This property has a very important consequence: A very small perturbation in the initial condition will produce a completely different outcome. Moreover, successive outcomes of a chaotic map will behave like a stochastic variable (statistically speaking). Finally, we will make use of the autocorrelation function , defined as
| (16) |
where
| (17) |
The function is a measure of how the deviations from the average at time are related to the deviations from the average steps apart [45]. In particular, chaotic maps are expected to show exponentially decaying autocorrelation functions, i.e.
| (18) |
where is the correlation time.
We will now proceed to summarise the properties of the different maps we will be using in the Bak-Sneppen model. Before continuing, it is worth mentioning that in principle, the case of random noise can be considered as a particular case of (12) in which with a random variable with a uniform probability density [44].
A Bernoulli maps
Let us start by considering the Bernoulli map [45], namely
| (19) |
where stands for the value of modulus and is a constant. It has been shown (see [45] and References therein) that this map has a uniform invariant measure
| (20) |
where the function has been defined in Eq. (13). Moreover this map is chaotic and is characterized by a Lyapunov exponent given by
| (21) |
For this map one can easily compute the time autocorrelation function, namely
| (22) |
where has been defined in Eq. (16) and the correlation time is given by
| (23) |
One sees that the correlation time decreases as increases. This means that given two maps with different values of , the one with the bigger value of will be closer to true random noise and then will de-correlate faster. As we shall see in the following section, this last property is of crucial importance in order to understand the differences between BS models with different Bernoulli maps.
B Logistic map
Let us now consider the logistic map (sometimes called Feigenbaum map), namely
| (24) |
The reasons for studying this map are manifold. On the one hand, this map has already been considered in the context of biological evolution models and population dynamics [46, 47, 48, 51] and can thus provide a possible deterministic interpretation of the evolution inside every ecological niche. Moreover, it has been shown that it describes the behavior of a wide variety of systems in nature [49]. On the other hand, it has a regime in which it is chaotic as well as one in which it is not, depending on whether is bigger or less than the critical value [45] (for there are windows in which the map is periodic; in this paper we will take outside these windows).
If we consider the particular case , the invariant density for this map is given by
| (25) |
the Lyapunov exponent is
| (26) |
and the correlation function is given by
| (27) |
The fact that this map is chaotic does not mean that the trajectory cannot be written explicitly. Indeed, it is easy to see that
| (28) |
with the initial condition , is a trajectory of the logistic map in the case of .
C Tent Map
To better illustrate the effects of time correlations in the updating, we will also need the so-called “tent” map (a “linear version” of the logistic map), defined as
| (32) |
This map is chaotic with Lyapunov exponent . Contrary to the case of the logistic map, the invariant measure for the Tent map is uniform i.e.
| (33) |
with an autocorrelation function given by
| (34) |
like in the case of purely random noise.

For our applications (see next section), we find useful to define a modified version of the Tent map (32) (“shifted Tent map”) in which we cut the at and then shift the function up modulus one, as shown in the following equation
D Periodic Map
So far we have only considered chaotic systems. However, there are maps that are not chaotic but are ergodic. Let us consider a simple example of such a case in which the “signal” is provided by an integrable system, that is a sequence given by
| (43) |
where the ’s are the angular frequencies and initial phases respectively. This can be rewritten as a map of onto as
| (44) |
where the initial condition is given by
The invariant measure is not constant, it is symmetric around and peaked close to namely
| (45) |
Since this “signal” is not chaotic, the Lyapunov exponent is zero and the correlations will not decay exponentially. In fact, the correlations are given by
| (46) |
At this point it is worth emphasising that these correlations are correlations for a given sequence. If we consider two sequences with different values of the correlation will be different.
IV Models
Through the use of the different maps presented in the previous section, we shall show here that the random updating is no longer a necessary requirement to have SOC. Moreover we will also show that as long as the map at hand is chaotic the system does not change the universality class, i.e. all the exponents are the same as in the case of random updating.
While the presence of critical behavior was somehow expected, it is still surprising that the universality class does not change. This means that the system is able to self-organize at a higher level: It takes into account the temporal correlation (or the average time spent in every site) by increasing the threshold, so as to have the same statistical properties. What is even more remarkable then is the fact that close enough to the threshold it is not possible to distinguish the random updating case from the chaotic one from the microscopical point of view, being the statistical properties and all the variables exactly the same. As a consequence, all the equations and relations shown in Sec. II are still valid for all the cases with chaotic updating.
We will show this equivalence through an infinite sequence of models with Bernoulli updating, logistic and Tent map updating. In fact, the same kind of analysis performed on the case with the (modified) Tent map can show that the time correlations are actually the ones responsible for the shifts in the thresholds.
However, the universality class is not always preserved. In fact, if one chooses a non-chaotic updating rule the critical exponents may change. We will show that by considering quasi-periodic updating rules (44).
A Bernoulli updating.
Let us consider a chaotic updating rule, whose statistical properties resemble those of a stochastic function, namely the Bernoulli map, Eq. (19).
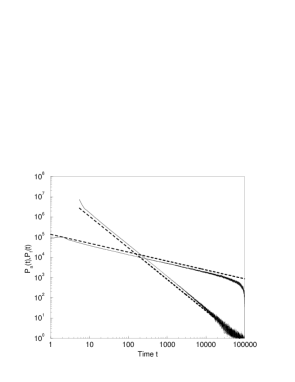
In Fig. 2 we show the power-law behavior of the first and all return probability distributions in the case . The critical exponents obtained coincide with those found in [26, 40] for the random updating. Moreover, for all values of the system falls in the BS universality class, i.e. it always has the same critical exponents.


The stationary distribution of the fitnesses, on the other hand, follows a different pattern. Indeed, Fig. 3 shows that the threshold for is bigger than the one found for the random case. On increasing the value of , the threshold moves towards the BS value (see Fig. 3). For non integer values of (), SOC is still preserved within the BS universality class. However, in this case, the distribution of the generated numbers is not uniform and consequently it influences the distribution of the fitnesses at the stationary state.
Turning now to Fig. 4, we can see that the thresholds for the Bernoulli updating approach the BS value as increases. In Fig. 4 we have also plotted the best fit we could find for the curve . This fit, that corresponds to a power law , still remains an open problem from the theoretical point of view.

There is a qualitative explanation for this behavior of the thresholds. As we briefly mentioned in Sec. II, the change in threshold is an indication of the correlation in time of the map we are using. Indeed, by looking at Eq. (11) we can see that an increase in corresponds to a lower value of for fixed . This fact means that the system spends more time per site and this reflects the fact that it needs more time to de-correlate. At this stage one can also ask if Eq. (9) remains valid even with a correlated map and if it is not necessary to introduce non-universal factors. The answer is given by noticing that for fixed distance from the threshold the value is the same for all models, leading to
| (47) |
where is the universal exponent introduced in Eq. (11) [42]. This means that looking at the system from a distance from the threshold it is not possible to distinguish two systems which have the same critical exponents.
B Logistic and Tent updating.
In previous subsection we showed that models with time-correlated updating self-organize into a stable configuration with a threshold bigger than the one in the random updating. At this stage, it is natural to consider updating that, even if deterministic, are -correlated. In particular, we consider updating rules given by the logistic and Tent maps.

Let us start by taking as updating rule for the fitnesses the logistic map, Eq. (24). As Fig. 5 shows, for those values of for which the map is chaotic, the system not only exhibits SOC but also stays in the same universality class as the original BS model. For we find that the system is not critical any more. This is due to the fact that, for the map goes to a periodic orbit, and consequently the updating is not ergodic. This case is equivalent to a BS model with finite number of states for the fitnesses. In terms of our previous picture, the disorder force is too weak to ensure SOC.

One characteristic of the logistic updating is that, since the invariant measure is not uniform, the distribution of the fitnesses above threshold is not uniform (see Fig. 6). This is not the case for the Tent map, Eq. (32) or the shifted version of it, Eq. (42). For both these cases the fitness distribution in the critical state is shown in Fig. 7. One observes that there is a peak in the fitness distribution in the neighborhood of the threshold for Eq. (32). This can be understood as produced by the interplay between the dynamics of the updating rule and the Bak-Sneppen dynamics. Indeed, the Tent map has an unstable fixed point at . Then if a site right below threshold is chosen as the minimum, the updated value will be above threshold, but still close to it. The next update in the same site will put the value of the fitness again below threshold, if a little bit further apart [50]. Then, one needs to update this site several times to remove it from the neighborhood of the threshold. Consequently, the probability of finding a site with fitness in the neighborhood of is higher than in the random update. If, on the other hand, one introduces the shifted Tent map, Eq. (42), where the fixed point is not close to , the distribution of the fitnesses above threshold is uniform, resembling exactly the random updating case (see Fig. 7).
Comparing the different chaotic maps we can draw several conclusions. First, time correlations in the updating immediately reflects in a shift of the threshold in the sense that to higher correlations correspond higher thresholds. Second, as shown by the shifted Tent map, the other higher correlations do not in principle produce any measurable change in the statistical properties of the system.
C Periodic updating.
Since time correlations in the updating rule do not, in principle, destroy SOC, it is worth considering systems in which the time correlation of the updating does not decay exponentially. As shown in [32], the simplest example of this class is given by a model in which the choice of the new fitness is done according to the periodic map, Eq. (44).
As mentioned in Sec. III, choosing the initial phases is equivalent to choosing the initial condition of the system. Consequently, we take our phases at random (). Our simulations indicate that if the frequencies are the same, that is , the strong synchronization of the sites along the lattice destroys criticality (even though the fitnesses are organized above a threshold). Indeed, the system develops a typical scale that is observed in the way of a cutoff in the distribution probabilities. If we now choose the frequencies such that
| (48) |
the situation changes dramatically. If we characterize the frequency distribution by two numbers, namely its centre and its width , the behavior will indeed depend on both.

Even after long numerical investigation, the exact functional form of this dependence cannot be outlined in a satisfactory way. Nevertheless, it is clear that over a whole range of values of the two parameters the system recovers a critical behavior. An example can be seen in Fig. 8, where we chose and . As mentioned above, the universality class changes with respect to the original BS model, with and , but the SOC behavior is preserved. We observed that this universality class depends on the values of and . For the sake of clarity, we show here only one example, out of many, that illustrates the point.
V Conclusions
Self-organized criticality in the BS model comes from the competition between the disorder in the updating and the ordering pressure of the minimum rule. For a given lattice and a given set of dynamical rules, the use of stochastic updating is tantamount to the introduction of maximum disorder. On the other hand, chaotic maps produce series of numbers that resemble (statistically) pure random numbers, with the exception of the functional form of the invariant density and the existence of decaying time correlations. The results presented here show that the system, in its critical state, feels the details of the underlying dynamics, even if preserving the universality class.
The time correlations in the updating produce a change in the non-universal features. In particular we showed that, as these correlations increase, the critical state of the system moves towards a more ordered configuration, that is the threshold is higher. This correspondence is made evident, for example, in the case of the shifted Tent map. There, a completely deterministic system reproduces the original BS results.
We would like to draw the attention of the reader to the complementarity of the results presented here and those obtained by Bianucci et. al. [33, 34, 35]. They showed that if a variable (say a Brownian particle) is weakly coupled to a system, provided this system is chaotic or ergodic, the resulting deterministic motion of the variable conforms to a standard fluctuation-dissipation process. In fact, the irregularities of the deterministic statistics are washed out by the time scale separation between the system of interest (represented by ) and the chaotic subsystem. The chaotic system is referred to as a “booster” [33, 34, 35]. This is completely analogous to what happens in the BS model. Noise (thermal or otherwise) can be replaced by a deterministic system without significant changes in the stationary state. Stochasticity in the updating rule is sufficient but not necessary: SOC persists, even in the absence of chaos, for (ergodic) periodic updating rules, if in a different universality class. Moreover, the conditions required from a deterministic system to be an appropriate booster are very similar to those required (from the updating rule) for SOC to be preserved.
Summarizing, the results presented here indicate that the feature ensuring SOC in systems with extremal dynamics, is not the randomness of the updating but the fact that the choice of the site where the change is performed (namely the minimum rule) is random. Moreover, as long as there is enough diversity among the species on the lattice, the longer the memory (or the internal correlation) of each member, the higher the threshold. Indeed, in the case of chaotic maps, the diversity is ensured by the random assignation of the initial values and as much as the chaoticity is increased we see that the threshold decreases. In the case of the periodic map instead, the random initial conditions do not provide enough diversity. Indeed, in order to have SOC, the internal time-scales, i.e. the periods, have to be distributed in a disordered fashion. Briefly, one needs enough diversity for SOC to appear [52].
At this stage, several questions arise. On the one hand, the behavior of the threshold with the parameter in the case of Bernoulli updating needs to be explained. Second, and perhaps more important from a theoretical point of view, what is the exact relation between correlation time and the position of the threshold?
Finally, we believe that these results add strength to the relevance of SOC in physics and biology,
since they allow different microscopic mechanisms to underlie
its appearance as a collective behavior.
Acknowledgements: We would like to thank R. Cafiero, P. Bak, S. Maslov,
and S.C. Manrubia for their useful comments and suggestions.
REFERENCES
-
[1]
delos@mpipks-dresden.mpg.de,
angelo@mpipks-dresden.mpg.de,
jose@mpipks-dresden.mpg.de. - [2] J.M. Carlson and J.S. Langer, Phys. Rev. Lett. 62, 2632 (1989).
- [3] S.A. Kauffman, The Origins of Order, Self-Organization and Selection in Evolution, Oxford University Press, New York 1993.
- [4] T. S. Ray, Artificial Life, 1 195 (1994)
- [5] S.I. Zaitsev, Physica A 189, 411 (1992).
- [6] A. Petri, G. Paparo, A. Vespignani, A. Alippi and M. Costantini, Phys. Rev. Lett. 73, 3423 (1994).
- [7] P. Diodati, F. Marchesoni and S. Piazza, Phys. Rev. Lett. 67, 2239 (1991).
- [8] G. Caldarelli, F. di Tolla and A. Petri, Phys. Rev. Lett. 77, 2503 (1996).
- [9] D. Wilkinson and J.F. Willemsen, J. Phys. A 16, 3365 (1983).
- [10] M. Cieplak and M.O. Robbins, Phys. Rev. Lett. 60, 2042 (1988).
- [11] K. Sneppen, Phys. Rev. Lett. 69, 3539 (1992).
- [12] K. Sneppen, Phys. Rev. Lett. 71, 101 (1993).
- [13] A. Rinaldo, I. Rodriguez-Iturbe, R. Rigon, E. Ijjasz-Vasquez and R.L. Bras, Phys. Rev. Lett. 70, 822 (1993).
- [14] A. Maritan, F. Colaiori, A. Flammini, M. Cieplak and J.R. Banavar, Science 272, 984 (1996).
- [15] G. Caldarelli, A. Giacometti, A. Maritan, I. Rodriguez-Iturbe and A. Rinaldo, preprint SISSA/ISAS REF. 77/96/CM.
- [16] S. Maslov, M. Paczuski and P. Bak, Phys. Rev. Lett. 73, 2162 (1994).
- [17] M. Vendruscolo, P. De Los Rios and L. Bonesi, Phys. Rev. E 54, 6053 (1996).
- [18] B.W. Roberts and M.E.J. Newman, J. Theor. Biol. 180, 39 (1996)
- [19] S. C. Manrubia and M. Paczuski, cond-mat/9607066.
- [20] M.D. Raup, Extinction. Bad Genes or Bad Luck?, Norton, New York (1991).
- [21] M.E.J. Newman, adap-org/9702003.
- [22] M.D. Raup, Science 251, 1530 (1986).
- [23] S.J. Gould and N. Eldredge, Paleobiology 3, 115 (1977).
- [24] N. Eldredge and S.J. Gould, Nature 332, 211 (1988).
- [25] N. Eldredge and S.J. Gould, in Models in Paleobiology, T. J. M.Schopf ed., Freeman Cooper and Co., San Francisco (1972).
- [26] P. Bak and K. Sneppen, Phys. Rev. Lett. 71, 4083 (1993).
- [27] R. V. Solé, S. C. Manrubia, M. Benton and P. Bak, Nature 388, 764 (1997).
- [28] P. Bak, C. Tang and K. Wiesenfeld, Phys. Rev. Lett. 59, 381 (1987).
- [29] P. Bak, C. Tang and K. Wiesenfeld, Phys. Rev. A 38, 364 (1988).
- [30] In computer simulations one uses a deterministic map, namely a pseudo-random number generator, to realize a random updating. Indeed, in any pseudo-random number generator, a good deal of effort goes into designing the algorithm to ensure that the statistical properties of the outcome pass all the tests for randomness that any “true” random sequence would. So these pseudo-random number generators are considered in practice, even if strictly speaking deterministic, the best mimic for true stochastic processes. For the purpose of this paper, the class of maps that will preserve SOC is much broader than the small set of good pseudo-random number generators [31].
- [31] B. Jannson, Random Number Generators, Victor Pettersons Bokindustri Aktiebolag, Stockholm 1966.
- [32] P. De Los Rios, A. Valleriani and J.L. Vega, Phys. Rev. E 56, 4876 (1997).
- [33] M. Bianucci, L. Bonci, G. Trefan, B. West and P. Grigolini, Phys. Lett. A 174, 377 (1993).
- [34] M. Bianucci, B. West and P. Grigolini, Phys. Lett. A 190, 447 (1994).
- [35] M. Bianucci, R. Mannella, X. Fang, P. Grigolini and B. West, Phys. Rev. E 47, 1510 (1993).
- [36] S. Boettcher and M. Paczuski,Phys. Rev. Lett. 76, 348 (1996).
- [37] Although this choice introduces some arbitrariness, we believe that it is not possible to give an objective, generally valid definition of fitness. This means that sometimes the less fit species might be the one with less offsprings while in some other circumstances the relevant parameter could also be something else [38]. What the BS model basically tells us is that at any given time the less fit species is the one that is forced to change, whatever the meaning of fitness might be at that time [39].
- [38] Pattern and Processes in the History of Life, D.M. Raup and D. Jablonski eds. , Dahlem Konferenzen 1986, Springer Verlag Berlin, Heidelberg (1986).
- [39] R. Lande, Proc. Nat. Acad. Sci. USA 82, 7641 (1985).
- [40] M. Paczuski, S. Maslov and P. Bak, Phys. Rev. E 53, 414 (1996).
- [41] P. Grassberger, Phys. Lett. A 200, 277 (1995).
- [42] S. Maslov , Phys. Rev. Lett. 77 1182 (1996).
- [43] M. Marsili, P. De Los Rios and S. Maslov, cond-mat/9710152
- [44] There are other quantities (such as the Kolmogorov-Sinai entropy) that are also useful in studying general properties of maps but we will not discuss here for lack of space. The reader is kindly invited to look at reference [45] and references therein for a detailed description of several of them.
- [45] H.G. Schuster, Deterministic Chaos (2nd ed.), VCH Verlag, Weinheim (1989).
- [46] R.M. May, Science 186, 645 (1974).
- [47] R.M. May, Nature 261, 459 (1976).
- [48] R.M. May and G.F. Oster, Amer. Natur. 110, 573 (1976).
- [49] P. Collet and J-P. Eckmann, Iterated Maps on the Interval as Dynamical Systems, Birkhauser, Boston (1980).
- [50] Note that points close to the fixed point of the map (32), jump, upon iteration, from below to above and vice versa.
- [51] G. Abramson, Phys. Rev. E 55 785 (1997).
- [52] A. Corral, C.J. Pérez and A. Díaz-Guilera, Phys. Rev. Lett. 78 1492 (1997).