Dynamics of the Magnetic Flux Trapped in Fractal Clusters
of a Normal Phase
in Percolative Superconductors
Abstract
The effect of the fractal clusters of a normal phase, which act as pinning centers, on the dynamics of magnetic flux in percolative type-II superconductor is considered. The main features of these clusters are studied in detail: the cluster statistics is analyzed; the fractal dimension of their boundary is estimated; the distribution of critical currents is obtained, and its peculiarities are explored. It is found that there is the range of fractal dimension where this distribution has anomalous statistical properties, specifically, its dispersion becomes infinite. It is examined how the finite resolution capacity of the cluster geometric size measurement affects the estimated value of fractal dimension. The effect of fractal properties of the normal phase clusters on the electric field arisen from magnetic flux motion is investigated for the cluster area distribution of different kinds. The voltage-current characteristics of fractal superconducting structures in the resistive state are obtained for an arbitrary fractal dimension. It is revealed that the fractality of the boundaries of the normal phase clusters intensifies the magnetic flux trapping and thereby raises the critical current of a superconductor.
pacs:
74.81.-g; 74.25.Qt; 74.25.Sv, 74.25.Fy; 74.81.BdI Introduction
An essential feature of the clusters of columnar defects in superconductors consists in their capability to trap a magnetic flux. Tonomura et al. (2001); Lidmar et al. (2001); Dam et al. (2002) Holding in place the vortices driven by the Lorentz force, such clusters can act as effective pinning centers. Higuchi et al. (1999); Mezzetti et al. (1999) This feature can be used in making new composite superconducting materials of enhanced critical current value. Beasley (1984); Krusin-Elbaum et al. (1998); Kuzmin (2000a) The characteristics of the normal phase clusters exert an appreciable effect on vortex dynamics in superconductors, especially when the clusters have fractal boundaries. Olson et al. (1998); Surdeanu et al. (1998); Prester (1999); Kuzmin (2000b, 2001a) In the present paper the magnetic and transport properties of composite superconductors with fractal clusters of a normal phase will be reviewed as well as the phenomena limiting the current-carrying capability of such superconductors will be considered.
Let us consider a superconductor containing columnar inclusions of a normal phase, which are out of contact one with another. These inclusions may be formed by the fragments of different chemical composition, as well as by the domains of reduced superconducting order parameter. The similar columnar defects can readily be created during the film growth process at the sites of defects on the boundary with the substrate. When such a superconducting structure is cooled below the critical temperature in the magnetic field oriented along the direction of the longest size of these inclusions, the magnetic flux will be frozen in the normal phase clusters. By the cluster we mean a set of the columnar defects, which are united by the common trapped flux and are surrounded by the superconducting phase. Even after the external field has been turned off, the flux trapped in these clusters is kept unchanged due to the currents that are steadily circulating around them through the superconducting loops. The distribution of the trapped magnetic flux resulting from such a magnetization in the field-cooling regime will be two-dimensional. So, instead of dealing with an extended object, which indeed the normal phase cluster is, we will consider its cross-section by the plane carrying a transport current. We will examine the geometric properties of the normal phase clusters in the planar section only, where the boundaries of the clusters are statistically self-similar.
The paper is organized as follows: The setting of the problem is described as well as the relationship between magnetic flux trapping, pinning properties, and geometric characteristics of the normal phase clusters in superconductor is discussed in Sec. 2. A geometric probability analysis of the weak links distribution over the cluster perimeter in terms of path integrals is made in Sec. 3. The concept of fractals and the basic notions in this field are reviewed briefly in Sec. 4. The statistical properties of normal phase clusters in YBCO superconducting films are studied, and the fractal dimension of their boundaries is estimated in Sec. 5. The voltage-current characteristics of superconductors with fractal clusters of a normal phase are obtained, and the peculiarities of the resistive state of the fractal superconducting structures are considered in Sec. 6.
II Magnetic Flux Trapping in Percolative Superconductors
The situation is sketched out in Fig. 1(a). The composite superconductor containing clusters of a normal phase represents a percolation system, where both the electric percolation of the supercurrent and the percolation of a magnetic flux may happen. If the part of the film surface covered by the normal phase exceeds the percolation threshold (which is equal to 50 percents for two-dimensional percolation Stauffer (1979)), the magnetic flux could be free to move in the transversal direction. There is no pinning at all in this situation, so it is out of our interest. Let us suppose that the opposite case is realized when the relative portion of superconducting phase exceeds the percolation threshold (see Fig. 1(b)), so there is a superconducting percolation cluster in the plane of the film where a transport current can flow. Such a structure provides for effective pinning and thereby raises the critical current, because the magnetic flux is locked in finite clusters of a normal phase, and so the vortices cannot leave them without crossing the surrounding superconducting space. Let us denote the total magnetic flux trapped in the superconductor after the field-cooling magnetization by . If the transport current is passed through the sample, the trapped flux remains unchanged as long as the vortices are still held in the normal phase clusters. The larger clusters have to provide for a weaker pinning than smaller ones, because the larger the cluster size, the more weak sites, through which the vortices can pass under the action of the Lorentz force, can be located along its perimeter. When the current is increased, the magnetic flux will break away first from the clusters of smaller pinning force, and therefore, of larger size. Magnetic flux trapped into a single cluster is proportional to its area . Therefore, the decrease in the total trapped flux is proportional to the number of the clusters of area larger than a given magnitude . So it can be expressed with the cumulative probability function , which is equal to the probability to find the cluster of area smaller than a preset value of :
| (1) |
The left hand side of this formula is equal to the relative decrease in the total trapped flux caused by the transport current of the same amplitude as the depinning current of the cluster of area , and the right hand side gives the probability to find the cluster of area greater than in the whole population.
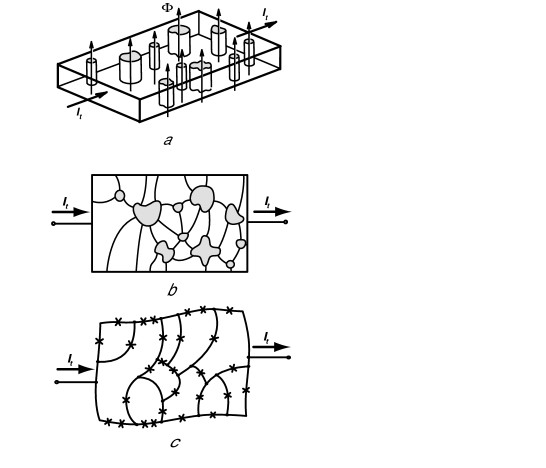
When the magnetic flux starts to break away from the normal phase clusters, the vortices must cross the surrounding superconducting space, and they will first do that through the weak links, which connect the normal phase clusters between themselves (see Fig. 1(b) where weak links are shown by the curves connecting the shaded regions, which designate the normal phase clusters). In Fig. 1(c) the equivalent weak-link-network circuit representation of such a system is shown. The normal phase clusters are presented by the cells of the net interlaced by the superconducting loops. Each of the loops contains weak links (shown by the crosses), which join the adjacent cells and so enable the vortices to pass from one cluster to another.
Weak links form readily in high-temperature superconductors (HTS) characterized by an extremely short coherence length. Blatter et al. (1994); Scalapino (1995); Kerchner et al. (1999) Various structural defects, which would simply cause some additional scattering at long coherence length, give rise to the weak links in HTS. On a mesoscopic scale twin boundaries are mainly responsible for weak link existence. Pastoriza et al. (1999); Kupfer et al. (1999); Maggio-April et al. (1997); Liu et al. (1991) Twins form especially readily in YBCO superconductors inasmuch as their unit cell is only close to the orthorhombic one. The twins can be spaced up to several nanometers apart, so even single crystal may have the fine substructure caused by twins. Magnetic and transport properties of HTS depend strongly on the orientation of twin planes with respect to the applied magnetic field. Oussena et al. (1995, 1996) The flux can easily move along the weak links formed by twins. Durán et al. (1992, 1995); Welp et al. (1995); Wijngaarden et al. (1997) At last, on a macroscopic scale there are manifold structural defects which can form weak links: that may be grain or crystallite boundaries as well as barriers arising from the secondary degrading the non-stoichiometric crystal into the domains with a high and low content of oxygen. Kerchner et al. (1999); Hanisch et al. (2002); Rykov et al. (1999); Schuster et al. (1993); Kilic et al. (1998) Moreover, a magnetic field further reduces a coherence length, thus resulting in more easy weak links formation. Sonier et al. (1999) In conventional low-temperature superconductors the weak links can be formed due to the proximity effect in sites of minimum distance between the next normal phase clusters.
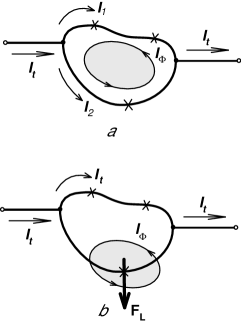
As soon as the transport current is turned on, this one is added to all the persistent currents, which maintain the magnetic flux to be trapped. The situation is sketched in Fig. 2. Each of these currents (like ) is circulating through the superconducting loop around the normal phase cluster wherein the corresponding portion of the magnetic flux is locked (Fig. 2(a)). The loop contains weak links that join the adjacent normal phase clusters transversely to the path of the current. As the transport current is increased, there will come a point when the overall current flowing through the weak link will exceed the critical value, so this link will turn into a resistive state. As this takes place, the space distribution of the currents throughout the superconducting cluster is changed in such a way that the resistive subcircuit will be shunted by the superconducting paths where weak links are not damaged yet. Magnetic field created by this re-distributed transport current acts via the Lorentz force on the current circulating around the normal phase cluster. As a result, the magnetic flux trapped therein will be forced out through the resistive weak link, which has become permeable to the vortices (Fig. 2(b)). So the cluster will not contain the magnetic flux any more.
Thus, whatever the microscopic nature of weak links may be, they form the channels for vortex transport. It appears that according to their configuration each normal phase cluster has its own value of the critical current, which contributes to the overall statistical distribution. By the critical current of the cluster we mean the current of depinning, that is to say, such a current at which the magnetic flux ceases to be held inside the cluster of a normal phase. When a transport current is gradually increased, the vortices will break away first from clusters of small pinning force (weaker than the Lorentz force created by the transport current), and therefore, of small critical current. Thus the decrease in the trapped magnetic flux is proportional to the number of all the normal phase clusters of critical currents less than a preset value. Therefore, the relative change in the trapped flux can be represented by the cumulative probability function for the distribution of the critical currents of clusters:
| (2) |
It is obvious that the critical current distribution is related to the cluster area distribution , because the cluster of a larger size has more weak links over its boundary with the surrounding superconducting space, and thus the smaller current of depinning.
III Geometric Probability Analysis of the Distribution of Weak Links over the Cluster Perimeter
In order to find out the relationship between the distribution of the critical currents of the clusters and the distribution of their areas, the distribution of entry points into weak links over the perimeter of a normal phase cluster should be analyzed. The problem of exit of a vortex from a normal cluster represents the two-dimensional analogue of a problem of a random walk particle reaching a border. Spitzer (1964); Gardiner (1983) At the same time, unlike the classic problem on the distribution of the exit points, here the boundary of the area is not absorbing all over. There are only discrete absorption points, which are located just at the sites where weak links are going out on the cluster boundary. In other words, these points are the points of the entry of vortices into weak links, or simply, entry points. For simplicity, we will assume that after the vortex reaches the entry point, it passes all the way between two adjacent normal phase clusters without being trapped inside the weak link itself. Here the magnetic flux is transferred by Josephson vortices. The Josephson penetration depth is large enough in the considered materials, so the size of the region, where the vortex is localized, much exceeds the characteristic length of all possible structural defects that can occur along the transport channel. Thus the probability that such a vortex, driven by the Lorentz force, will be trapped in passing through a weak link is very small. This assumption agrees well with the results of research on the magnetic flux motion along weak links Wijngaarden et al. (1997); Dorogovtsev and Kuzmin (1992); Fangohr et al. (2001) including twins. Durán et al. (1992, 1995); Welp et al. (1995); Turchinskaya et al. (1993); Welp et al. (1994) At the same time, it allows us to highlight the role played by the cluster boundary in the magnetic flux dynamics.
Let us consider the distribution of entry points over perimeter of a normal phase cluster. Generally, this distribution varies from one cluster to another, so that each normal phase cluster has the entry point distribution function of its own, which belongs to some function class . Here is the co-ordinate measured along the cluster perimeter, so . In this context the functions of class are random elements of the statistical distribution. The probability distribution of functions over all the clusters can be characterized by the functional , which is equal to the probability of finding a given function .
In the most general way the geometric probability analysis of the entry point into weak link distribution can be carried out by means of path integral technique. Feynman and Hibbs (1965) The probability that the function may be found within the class can be expressed by the path integral
Therefore, the most probable function of entry point distribution is the mean over all functions of class
| (3) |
The path integral Fourier transform on the probability functional represents the characteristic functional
| (4) |
where are the functions of a reciprocal function set, and integration in the kernel is carried out over the cluster perimeter.
The characteristic functional is the path integration analog for the usual moment-generating function. The probability functional can be written as an inverse path integral Fourier transform on the characteristic functional
where the path integration is carried out on the reciprocal function space.
In the simplest case, when all the clusters are of equal entry point distribution, which coincides with the most probable one of Eq. (3), the probability functional is zero for all that differ from , whereas . As this takes place the characteristic functional of Eq. (4) becomes
| (5) |
If all entry points had fixed co-ordinates instead of the random ones, their distribution would be , where is the number of entry points along the cluster perimeter, is Dirac delta function. The constant is being chosen to normalize the distribution function to unity, so that .
Now suppose that all the points of entries into weak links are randomly distributed with uniform probability over the cluster perimeter, so the probability to find any -th point within some interval is proportional to its length. In that case the characteristic functional of Eq. (4) takes the form
| (6) | |||||
Expanding the function in a power series at , and taking into account the condition , we may write
that, after substitution into Eq. (6), gives
| (7) |
The found characteristic functional of Eq. (7) has the form of Eq. (5) for the function of the uniform distribution of entry points
| (8) |
This means that all the clusters have the same uniform distribution of the entry points of Eq. (8), for which the probability of finding a weak link at any point of the perimeter is independent of its position.
Let us suppose that concentration of entry points into weak links per unit perimeter length is constant for all clusters, and all the clusters are statistically self-similar. In this case the mean number of entry points along the cluster perimeter is proportional to its length:
| (9) |
Next step will consist in finding the relationship between the size of a cluster and its critical current. The pinning force corresponds to such a current at which the vortices start to break away from the cluster. As the transport current is increasing, the Lorentz force, which expels the magnetic flux, increases as well. The vortices start to leave the normal phase cluster when the Lorentz force becomes greater than the pinning force. At the same time, growing in current will result in re-distribution of the magnetic flux, which will penetrate deeper and deeper into a transition layer on that side of the surrounding superconducting space where the Lorentz force is directed (see Fig. 2(b)). In order to leave the normal phase cluster, vortices have to reach the entry points into weak links. The exit of the magnetic flux can be considered as the result of random walks of vortices driven by the Lorentz force, which is pushing them into weak links. A similar approach has been successfully applied in analyzing the magnetic flux penetration in SQUID arrays. Dorogovtsev and Kuzmin (1992) The mean number of the entry points available on the cluster perimeter provides the probability measure of the number of the random walk outcomes, which are favorable for the vortex to go out. In the case of the uniform entry point distribution, from Eq. (9) it follows that , so the perimeter length also represents the probability measure of the amount of favorable outcomes for vortex to leave the cluster. The more entry points into weak links are accessible for random walk vortices, the smaller is the Lorentz force required to push the flux out. Hence, we may write the following relationship between the critical current of the cluster and its geometric size:
| (10) |
This expression is valid for the simplest case of uniform distribution of entry points, which is assumed to be the same for all clusters. Such a simplification allows us to emphasize that in the case being considered the magnetic flux is held in the normal phase cluster by its boundary.
Thus, to deal with the distribution function of Eq. (1), the relation between perimeter and area of clusters should be studied. It might be natural to suppose that the perimeter-area relation obeys the well known geometric formula: . However, it would be a very rough approximation, because this relationship holds for Euclidean geometric objects only. As was first found in Ref.Kuzmin (2000b), the normal phase clusters can have fractal boundaries, which exhibit non-Euclidean features. The fractal nature of such clusters exerts an appreciable effect on the dynamics of a magnetic flux in superconductors. Kuzmin (2001a, b, c)
IV A Brief Introduction to Fractal Geometry
The notion of a fractal as an object of fractional dimension was first introduced by Mandelbrot Mandelbrot (1967) in 1967 and since then it has received a lot of applications in various domains of sciences. Mandelbrot (1977, 1982, 1986); Feder (1988) This concept is closely connected to ideas of scaling and self-similarity. Self-similarity is invariance with respect to scaling; in other words, an invariance relative to multiplicative changes of scale. Whereas a usual periodicity is invariance with respect to additive translations, self-similarity is a periodicity in a logarithmic scale.
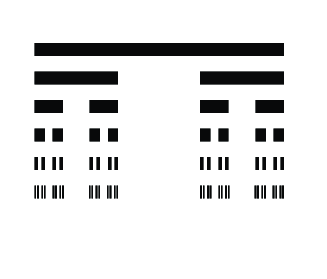
The simplest examples of self-similar objects are presented by so called Cantor sets. Such a set has measure zero and, at the same time, has so many elements that it is uncountable. The Cantor set may be constructed in the following way. Let us draw a line segment, and erase its middle third. Then eliminate middle third of each remaining part, and so on. The first six steps of this procedure are shown in Fig. 3. The resulting set obtained by endless erasing of the middle thirds of remaining intervals is called “Cantor dust“. Mandelbrot (1977) The Cantor dust forms a self-similar set: if one would take any line in Fig. 3, leave out the left or right half and magnify the remainder three times, this will result in the line segment immediately above it. So the Cantor dust is invariant to scaling by a factor . This set is not only a self-similar one, but it is a fractal as well. Let us look at that part of the set that falls within one -th part of the original set, where is a scaling factor, and ask what fraction of the set falls into that portion? In other words, how many subsets, each is similar to the original set, are there if the length is subdivided into parts? The number of such subsets is equal to , so one-half of the original set falls into one third of the initial length. The fractal dimension is defined as the logarithm of the subset number divided by the logarithm of the scaling factor: . This formula represents the relation between the subset number and the scaling factor: . Thus the fractal dimension of the Cantor dust is less than unity. This fact reflects its dust-like consistency compared to a usual line. An Euclidean line is such a set that if we change the length scale, we recover the same set of points. Hence the fractal dimension of a line coincides with the topological dimension, and both of them are equal to unity. Generally, a fractal object has a fractional dimension. A fractal set is such a set for which the fractal dimension strictly exceeds its topological dimension. Mandelbrot (1982)
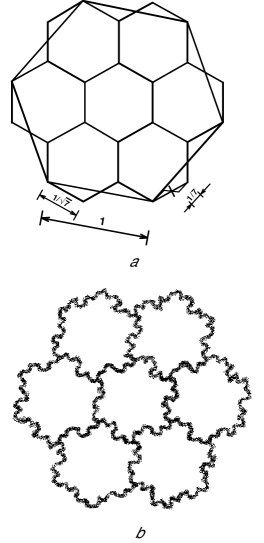
Another example of the fractal set is so called smoother Koch island. Mandelbrot (1977) Figure 4(a) shows the simple hexagon lattice formed by a hexagon surrounded by six identical hexagons. Let us note that each side of the big hexagon is broken up into three straight-line segments, each of length equal to . The total area of seven hexagons is seven times the area of a little hexagon, whereas the perimeter of the entire figure is three times that of a little hexagon. Note that the total figure is not a hexagon so the figure is not similar to its parts. Although hexagons cover the whole plane, they do not form a hexagon again. But this peculiarity can be fixed up by making all the figures to be similar. The first step is to make each straight line in Fig. 4(a) to be similar to one third of the perimeter of the entire figure. For this purpose we break up each side of a little hexagon into three segments again, each of the length of of the side of the big hexagon. By repeating this breaking process endlessly, we will arrive at a figure that is sketched in Fig. 4(b). The entire figure is similar to its seven parts. The obtained figure is a fractal called “smoother Koch island“. Its scaling factor is equal to by our construction, and the corresponding number of subsets is equal to , so its fractal dimension is . The non-integer magnitude of the obtained value is consistent with the generalized Euclid theorem about measures of similar figures, which states that the ratios of corresponding measures are equal when reduced to the same dimension. Mandelbrot (1982) Therefore, it follows that
| (11) |
which is valid both for Euclidean figures and for the fractal ones.
Both the Cantor dust and the smoother Koch island are examples of determinate fractals: they are self-similar by deterministic construction. But the same approach can be applied to the stochastic fractals, which are statistically self-similar. Mandelbrot (1977) The fundamental feature of any fractals, both determinate and the stochastic ones, is that its characteristic measures obey a scaling law that includes an exponent called the fractal dimension. In the following context, this is the scaling relation of Eq. (11) where the perimeter and the enclosed area are involved, and the fractal dimension characterizes the cluster perimeter (so-called coastline dimension. Mandelbrot (1977))
V Fractal Geometry of Normal Phase Clusters
Using the relation of Eq. (11) between the fractal perimeter and the area of the cluster, as well as formula of Eq. (10), we can get the following relation between the critical current of the cluster and its geometric size: , where is the form factor, and is the fractal dimension of the cluster perimeter. In the general way the cluster area distribution can be described by gamma distribution, Kuzmin (2001b, c) which has the following cumulative probability function:
| (12) |
where is Euler gamma function, is the incomplete gamma function, and are the parameters of gamma distribution that control the mean area of the cluster and its variance .
The case of gamma distribution of the cluster areas is of most interest for optimizing the cluster structure of the composite superconductors, because this distribution has two independent parameters that can be varied in the cause of the film growth. One of the aim of such an optimization is to get the highest current-carrying capability of a superconductor. Kuzmin (2002a, b)
In accordance with starting formulas of Eq. (1) and Eq. (2), gamma distribution of cluster areas of Eq. (12) gives rise to the critical current distribution of the form:
| (13) |
where
, is the complementary incomplete gamma function, is the dimensionless electric current, is this the critical current of the transition into a resistive state. The found cumulative probability function of Eq. (13) allows us to derive the probability density for the critical current distribution:
| (14) |
This distribution allows us to fully describe the effect of the transport current on the trapped magnetic flux taking into account the fractal properties of the normal phase clusters.
| Mean , nm2 | |
| Sample standard deviation of , nm2 | |
| Min value of , nm2 | |
| Max value of , nm2 | |
| Mean nm | |
| Sample standard deviation of , nm | |
| Min value of , nm | |
| Max value of , nm | |
| Correlation coefficient | |
| Estimated fractal dimension | |
| Standard deviation of |
In order to clear up how the developed approach can be used in practice, the geometric probability analysis of electron photomicrographs of superconducting films was carried out. For this purpose electron photomicrographs of YBCO film prepared by magnetron sputtering have been scanned. The normal phase has occupied 20% of the total surface only, so the transport current can flow through the sufficiently dense percolation superconducting cluster. The perimeters and areas of clusters have been measured by covering their digitized pictures with a square grid of spacing nm2. The results of the statistical treatment of these data are presented in Table 1 as well as in Fig. 5. The primary sampling has contained 528 normal phase clusters located on the scanned region of a total area of 200 m2. The distribution of the cluster areas is fitted well to exponential cumulative probability function, as is shown on the histogram in the inset of Fig. 5. The number of clusters that fall within the assigned rank is plotted on the ordinate of this graph; the rank number is plotted on the abscissa. A high skewness (1.765) as well as the statistically insignificant (5%) difference between the sample mean area of the cluster and the standard deviation also attests that there an exponential distribution of the cluster areas holds true. This distribution is a special case of gamma distribution for which , so the cumulative probability function of Eq. (12) can be simplified to the following form:
| (15) |
The exponential distribution has only one characteristic parameter - the mean cluster area . The obtained data allow us to find the perimeter-area relation for the normal phase clusters. All the points in Fig. 5 fall on a straight line in double logarithmic scale with correlation coefficient of 0.929. Accordingly to the scaling relation of Eq. (11), the slope of the regression line gives the estimate of fractal dimension of the cluster perimeter, which is equal to . The graph in Fig. 5 shows that the scaling law for perimeter and area, which is inherent to fractals, is valid in the range of almost three orders of magnitude in cluster area. This relation between perimeter and area is consistent with the generalized Euclid theorem, so we can see that the ratios of perimeters and areas are equal when reduced to the same dimension. The scaling perimeter-area behavior means that there is no characteristic length scale in the range of two orders of linear size of the normal phase cluster. Whatever the shape and size of the clusters may be, all the points fall closely on the same straight line in logarithmic scale; so that there are no apparent kinks or bends on the graph.
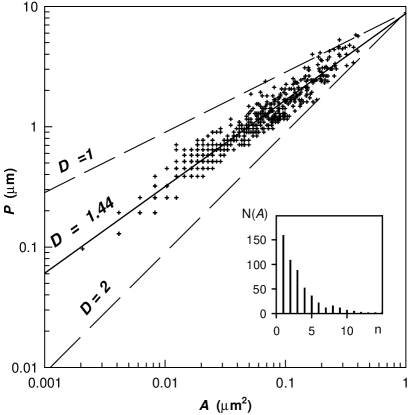
This point that the found value of the fractal dimension differs appreciably from unity engages a great attention. What this means is that the fractal properties of the cluster boundary are of prime importance here. Two dotted lines in Fig. 5 bound the range of the slopes that the dependencies of the perimeter on the cluster area can have for any arbitrary fractal dimension. The least slope (upper line) corresponds to Euclidean clusters, which have the fractal dimension equal to topological one (), the most one (lower line) relates to the clusters of the greatest possible fractal dimension, which is equal to the topological dimension of a smooth surface (). Such a fractal dimension is inherent, for example, in Peano curves, which fill the whole plane. Mandelbrot (1977) Whatever the geometric morphological properties of clusters may be, the slope of their perimeter-area graphs will be always bounded by these two limiting lines. The found dependence () runs just between them.
The geometric probability properties of the normal phase clusters are responsible for main features of the critical current statistical distribution. Now, knowing the fractal dimension of the cluster boundaries, the change in the trapped magnetic flux caused by the transport current can be found with aid of Eq. (2). The exponential distribution of the cluster areas of Eq. (15) gives rise to the exponential-hyperbolic distribution of critical currents
| (16) |
which follows from Eq. (13) at . Now the critical current of the resistive transition , which appears in the expression for the dimensionless electric current , can be found from a simpler formula: . The effect of a transport current on the trapped magnetic flux is illustrated in Fig. 6 for the case of Euclidean clusters (dotted curve) as well as for the clusters of found fractal dimension (solid curve).
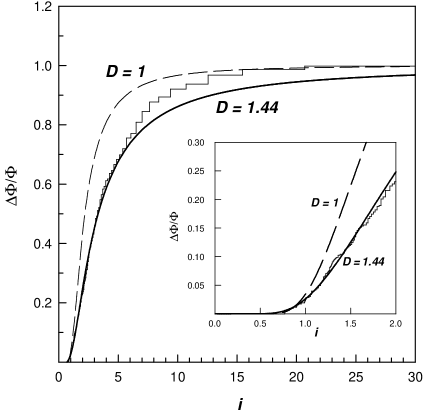
In order to get the relationship between the dynamics of the trapped magnetic flux and the geometric morphological properties of the superconducting structure the empirical function of the distribution of the critical currents has been found. First, the empirical distribution function for the sampling of the areas of the normal phase clusters has been obtained. The value of was calculated for each order statistic as the relative number of clusters of area smaller than a given value . Next, the empirical distribution of the critical currents was computed for the same order statistics using the formulas:
This function, shown in Fig. 6 by the step line, gives a statistical estimate of the cumulative probability function of Eq. (16). As is seen from this figure, both distributions coincide well in the range of currents . Starting with the value of the current the crossover from the fractal regime to the Euclidean one is observed. This transition into the Euclidean regime is over at large transport currents, when the magnetic flux changes mainly for the breaking of the vortices away from the small clusters (as the smaller clusters have the larger pinning force). The observed crossover has its origin in the finite resolution capability of measuring the cluster sizes. When estimating the fractal dimension, we have to take into account that the resolution of the measurement of any geometric sizes is finite. The peculiarity of the topologically one-dimensional fractal curve is that its measured length depends on the measurement accuracy. Mandelbrot (1977) In our case such a fractal curve is represented by the boundary of the normal phase cluster. That is why just the statistical distribution of the cluster areas, rather than their perimeters, is fundamental for finding the critical current distribution. The topological dimension of perimeter is equal to unity and does not coincide with its fractal dimension, which strictly exceeds the unity. Therefore the perimeter length of a fractal cluster is not well defined, because its value diverges as the yardstick size is reduced infinitely. On the other hand, the topological dimension of the cluster area is the same as the fractal one (both are equal to two). Thus, the area restricted by the fractal curve is a well-defined finite quantity.
Taking into account the finite resolution effect, the perimeter-area relationship of Eq. (11) can be re-written in the following form
| (17) |
where is the yardstick size used to measure this length. This relation holds true when the yardstick length is small enough to measure accurately the boundary of all smallest clusters in sampling. When the resolution is deficient, the Euclidean part of the perimeter length will dominate the fractal one, so there is no way to find the fractal dimension using the scaling relation of Eq. (17). It means that if the length of a fractal curve was measured too roughly with the very large yardstick, its fractal properties could not be detected, and therefore such a geometric object would be manifested itself as Euclidean one. It is just the resolution deficiency occurs at the crossover point in Fig. 6. Starting with the cluster area less than some value (which corresponds to the currents of ) it is impossible to measure all “ skerries” and “ fjords” on the cluster coastlines, whereas all the clusters of area less than the size of the measuring cell (3600 nm2 that relates to the currents of ), exhibit themselves as objects of Euclidean boundaries. This resolution deficiency can be also observed in Fig. 5: some points at its lower left corner are arranged discretely with the spacing equal to the limit of resolution (60 nm), because some marks for smallest clusters coincide for the finite resolution of the picture digitization procedure.
The fractal dimension was found above by means of regression analysis of the whole primary sampling, where the very small clusters of sizes lying at the breaking point of the resolution limit were also included. In order to evaluate how the finite resolution affects the accuracy of the estimation of the fractal dimension, all the points, for which the resolution deficiency was observed, were eliminated from the primary sampling. So the truncated sampling has been formed in such a way that only 380 clusters, for which the resolution deficiency is not appeared yet, have been selected from the primary sampling. The least squares treatment of these perimeter-area data gives the adjusted magnitude of the fractal dimension: . The found value virtually does not differ from the previous one within the accuracy of the statistical estimation, whereas the correlation coefficient (which becomes equal to 0.869) falls by six hundredth only. Therefore, we can conclude that the found estimate of the fractal dimension is robust.
It is worthy of note that the above-described resolution deficiency refers only to the procedure of the cluster geometric sizes measurement. As may be seen from the Table 1, the characteristic sizes of the normal phase clusters far exceed both the coherence length and the penetration depth. Therefore, any effects of finite resolution related to the size of the vortices that scan the boundaries of the clusters in searching for weak links may be neglected.
VI Fractal Superconducting Structures in a Resistive State
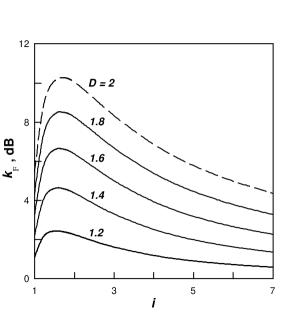
So, it has been revealed that the fractality of the cluster boundaries intensifies the pinning. As can be seen from Fig. 6, the decrease in the trapped magnetic flux at the same value of the transport current is less for larger fractal dimension. The pinning amplification can be characterized by the pinning gain factor
| (18) |
which is equal to relative decrease (in decibels) in the fraction of magnetic flux broken away from fractal clusters of fractal dimension compared to the case of Euclidean ones. The dependencies of the pinning gain on the transport current for different fractal dimension at are shown in Fig. 7. The highest amplification (about 10 dB) is reached when the cluster boundaries have the greatest possible fractality. Figure 7 demonstrates that with increase in fractal dimension the trapped magnetic flux is changed less and less by the action of the transport current. The pinning gain of Eq. (18) characterizes the properties of a superconductor in the range of the transport currents corresponding to a resistive state (). At smaller current the total trapped flux remains unchanged (see Fig. 6) for lack of pinning centers of such small critical currents, so the breaking of the vortices away has not started yet. When the vortices start to leave the normal phase clusters and move through the weak links, their motion induces an electric field, which, in turn, creates the voltage drop across the sample. Therefore, the passage of electric current is accompanied by the energy dissipation. As for any hard superconductor (that is to say, type-II, with pinning centers) this dissipation does not mean the destruction of phase coherence yet. Some dissipation always accompanies any motion of a magnetic flux that can happen in a hard superconductor even at low transport current. Therefore the critical current in such materials cannot be specified as the greatest non-dissipative current. The superconducting state collapses only when a growth of dissipation becomes avalanche-like as a result of thermo-magnetic instability.
By virtue of the fact that any motion of the magnetic flux causes the energy dissipation in superconductors, the question of how such a process could be prevented, or only suppressed, is of prime practical importance. The study of resistive state peculiarities leads to the conclusion that the cluster fractality exerts influence on the electric field induced by the flux motion. The found distribution of the critical currents allows us to find the electric field arising from the magnetic flux motion after the vortices have been broken away from the pinning centers. Inasmuch as each normal phase cluster contributes to the total critical current distribution, the voltage across a superconductor can be represented as the response to the sum of effects made by the contribution from each cluster. Such a response can be expressed as a convolution integral
| (19) |
where is the flux flow resistance. The similar approach is used universally in all the cases where the distribution of the depinning currents takes place. Warnes and Larbalestier (1986); Wordenweber (1992); Kuzmin et al. (1994); Brown (2000) The subsequent consideration will be essentially concentrated on the consequences of the fractal nature of the normal phase clusters specified by the distribution of Eqs. (13), (16), so all the problems related to possible dependence of the flux flow resistance on a transport current will not be taken up here.
After substitution of the critical current distribution of Eq. (14) into the expression of Eq. (19), upon integration, we get the final expression for the voltage-current (V-I) characteristics in the general case of the gamma-distribution of the cluster areas:
| (20) | |||||
In the special case of exponential cluster area distribution () the general formula of Eq. (20) can be simplified:
| (21) | |||||
where .
In extreme cases of Euclidean clusters and clusters of the highest fractality the expression of Eq. (21) can be further transformed:
(i) Clusters of Euclidean boundary ( at ):
where is the complementary error function.
(ii) Clusters of boundary with the maximum fractality ( at ):
where is the exponential integral function.
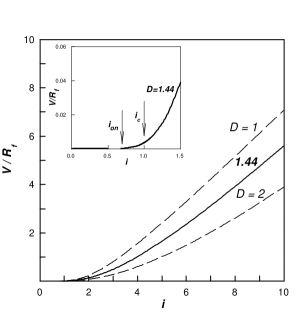
The V-I characteristics calculated using Eq. (21) for several values of are presented in Fig. 8. Two dotted lines bound the region the V-I characteristics can fall within for any possible values of fractal dimension. The solid curve represent the V-I characteristic of a superconductor with fractal clusters of previously obtained fractal dimension . The inset in Fig. 8 shows the region of resistive transition under magnification. As may be seen from this graph, the critical current is preceded by some initial region of the finite voltage drop starting with , so the resistive transition is not absolutely abrupt. The existence of this initial section on the V-I characteristic arises from the peculiarities of the fractal distribution in the range of small currents. It has been just a similar initial region of fractal dissipation has been observed in high-resolution measurements of dynamical resistance of HTS-normal metal composites (BPSCCO-Ag) as well as in polycrystalline YBCO and GdBCO samples. Prester (1999, 1998)
All the curves of V-I characteristics are virtually starting with the transport current value equal to unity. When the current increases the trapped flux remains unchanged until the vortices start to break away from the pinning centers. As long as the magnetic flux does not move, no electric field is arisen. Figure 8 shows that the fractality reduces appreciably an electric field arising from the magnetic flux motion. This effect is especially strong in this range of the currents (), where the pinning enhancement also has a maximum (see also Fig. 7). Both these effects have the same nature, inasmuch as their reason lies in the peculiarities of the critical current distribution. The influence of the fractal dimension of the cluster boundary on the critical current distribution is demonstrated in Fig. 9. As may be seen from this graph, the bell-shaped curve of the distribution broadens out, moving towards greater magnitudes of current as the fractal dimension increases. It means that more and more of the small clusters, which can best trap the magnetic flux, are being involved in the game. Hence the number of vortices broken away from pinning centers by the Lorentz force is reducing, so the smaller part of a magnetic flux can flow. The smaller part of a magnetic flux can flow, the smaller electric field is created. In turn, the smaller the electric field is, the smaller is the energy dissipated when the transport current passes through the sample. Therefore, the decrease in heat-evolution, which could cause transition of a superconductor into a normal state, means that the current-carrying capability of the superconductor containing such fractal clusters is enhanced.
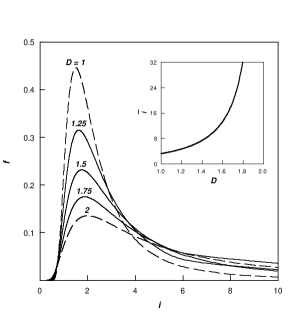
The re-distribution of probability with increasing in the fractal dimension can be characterized by the statistical moments of the critical current distribution, namely, the mean critical current
and the variance of critical currents
As may be seen from the inset in Fig. 9, the mean critical current grows nonlinearly with increase in the fractal dimension that reflects the broadening of the “tail“ of the critical current distribution. This “tail“ is so elongated that the variance of critical currents becomes infinite in the range of fractal dimensions . At the same time, the mode of the critical current distribution is a finite function, which increases monotonically in the range of all possible values of fractal dimension: mode . The distributions with divergent variance are known in probability theory - the classic example of that kind is Cauchy distribution. Hudson (1964) However, such an anomalous feature of the critical current distribution of Eq. (14) is of special interest, inasmuch as the current-carrying capability of a superconductor would be expected to increase just in the region of giant dispersion. Then the statistical distribution of critical currents has a very broad “tail“ containing the contributions from the clusters of the highest depinning currents.
VII Conclusion
So, in the present work the fractal nature of the normal phase clusters is revealed, and relation between the fractal properties of the clusters and dynamics of the trapped magnetic flux is established. The fractal distribution of the critical current is obtained. It is found that the fractality of cluster boundary strengthens the flux pinning and thereby hinders the destruction of superconductivity by the transport current. V-I characteristics of fractal superconducting structures in a resistive state are obtained. It is revealed that the fractality of the boundaries of the normal phase clusters reduces the electric field arising from magnetic flux motion, and thereby raises the critical current of a superconductor.
At the same time, the following problems are open for further development in this field. First, a central point of the presented approach is that the magnetic flux is held on the boundaries of clusters. In experiments with polycrystalline magnesium diboride Larbalestier et al. (2001) it has been found that in this new superconductor the similar situation takes place, but instead of the cluster boundaries, the grain boundaries act in the same way. Second, the fractal distribution of the critical currents have anomalous statistical properties caused by a divergence of some its statistical moments so this point is worthy for further investigations. Then, the special cases of the distribution of entry points into weak links, which can be realized in anisotropic composites, are of interest. First of all, we mean the entry point distributions that take place in superconducting tapes and wires. Last, obtained results open the possibilities for increasing the critical current value of percolative superconductors by optimizing their geometric morphological properties, and enable to improve the technology of preparation of superconducting films of high critical current value. The study of these questions will allow us to get a better insight into the vortex dynamics in the superconductors containing fractal clusters.
Acknowledgements.
This work is supported by the Saint Petersburg Scientific Center of the Russian Academy of Sciences.References
- Tonomura et al. (2001) A. Tonomura, H. Kasai, O. Kamimura, T. Matsuda, K. Harada, Y. Nakayama, J. Shimoyama, K. Kishio, T. Hanaguri, K. Kitazawa, et al., Nature 412, 620 (2001).
- Lidmar et al. (2001) J. Lidmar, D. R. Nelson, and D. A. Gorokhov, Phys. Rev. B 64, 144512 (2001).
- Dam et al. (2002) B. Dam, J. M. Huijbregtse, and J. H. Rector, Phys. Rev. B 65, 064528 (2002).
- Higuchi et al. (1999) T. Higuchi, S. I. Yoo, and M. Murakami, Phys. Rev. B 59, 1514 (1999).
- Mezzetti et al. (1999) E. Mezzetti, R. Gerbaldo, G. Ghigo, L. Gozzelino, B. Minetti, C. Camerlingo, A. Monaco, G. Cuttone, and A. Rovelli, Phys. Rev. B 60, 7623 (1999).
- Beasley (1984) M. R. Beasley, in: Percolation, Localization and Superconductivity, ed. by A. M. Goldman and S. A. Wolf, vol. 109 of NATO ASI Series, Ser.B, pp.115-143 (Plenum Press, New York, 1984).
- Krusin-Elbaum et al. (1998) L. Krusin-Elbaum, G. Blatter, J. R. Thompson, D. K. Petrov, R. Wheeler, J. Ullmann, and C. W. Chu, Phys. Rev. Lett. 81, 3948 (1998).
- Kuzmin (2000a) Y. I. Kuzmin, Tech. Phys. Lett. 26, 791 (2000a).
- Olson et al. (1998) C. J. Olson, C. Reichhardt, and F. Nori, Phys. Rev. Lett. 80, 2197 (1998).
- Surdeanu et al. (1998) R. Surdeanu, R. J. Wijngaarden, B. Dam, J. Rector, R. Griessen, C. Rossel, Z. F. Ren, and J. H. Wang, Phys. Rev. B 58, 12467 (1998).
- Prester (1999) M. Prester, Phys. Rev. B 60, 3100 (1999).
- Kuzmin (2000b) Y. I. Kuzmin, Phys. Lett. A 267, 66 (2000b).
- Kuzmin (2001a) Y. I. Kuzmin, Phys. Rev. B 64, 094519 (2001a).
- Stauffer (1979) D. Stauffer, Phys. Reports 54, 2 (1979).
- Blatter et al. (1994) G. Blatter, M. V. Feigelman, V. B. Geshkenbein, A. I. Larkin, and V. M. Vinokur, Rev. Mod. Phys. 66, 1125 (1994).
- Scalapino (1995) D. J. Scalapino, Phys. Reports 250, 329 (1995).
- Kerchner et al. (1999) H. R. Kerchner, D. P. Norton, A. Goyal, J. D. Budai, D. K. Christen, D. M. Kroegeer, M. Paranthaman, D. F. Lee, F. A. List, R. Feenstra, et al., Phys. Rev. B 60, 6878 (1999).
- Pastoriza et al. (1999) H. Pastoriza, S. Candia, and G. Nieva, Phys. Rev. Lett. 83, 1026 (1999).
- Kupfer et al. (1999) H. Kupfer, T. Wolf, A. A. Zhukov, and R. Meier-Hirmer, Phys. Rev. B 60, 7631 (1999).
- Maggio-April et al. (1997) I. Maggio-April, C. Renner, A. Erb, E. Walker, and O. Fisher, Nature 390, 487 (1997).
- Liu et al. (1991) J. Z. Liu, Y. X. Jia, R. N. Shelton, and M. J. Fluss, Phys. Rev. Lett. 66, 1354 (1991).
- Oussena et al. (1995) M. Oussena, P. A. J. de Groot, S. J. Porter, R. Gagnon, and L. Taillefer, Phys. Rev. B 51, 1389 (1995).
- Oussena et al. (1996) M. Oussena, P. A. J. de Groot, K. Deligiannis, A. V. Volkozub, R. Gagnon, and L. Taillefer, Phys. Rev. Lett. 76, 2559 (1996).
- Durán et al. (1992) C. A. Durán, P. L. Gammel, R. Wolfe, V. J. Fratello, D. J. Bishop, J. P. Rice, and D. M. Ginsberg, Nature (London) 357, 474 (1992).
- Durán et al. (1995) C. A. Durán, P. L. Gammel, D. J. Bishop, J. P. Rice, and D. M. Ginsberg, Phys. Rev. Lett. 74, 3712 (1995).
- Welp et al. (1995) U. Welp, T. Gardiner, D. O. Gunter, B. W. Veal, G. W. Crabtree, V. K. Vlasko-Vlasov, and V. I. Nikitenko, Phys. Rev. Lett. 74, 3713 (1995).
- Wijngaarden et al. (1997) R. J. Wijngaarden, R. Griessen, J. Fendrich, and W.-K. Kwok, Phys. Rev. B 55, 3268 (1997).
- Hanisch et al. (2002) J. Hanisch, A. Attenberger, B. Holzapfel, and L. Schultz, Phys. Rev. B 65, 052507 (2002).
- Rykov et al. (1999) A. I. Rykov, S. Tajima, F. V. Kusmartsev, E. M. Forgan, and C. Simon, Phys. Rev. B 60, 7601 (1999).
- Schuster et al. (1993) T. Schuster, H. Kuhn, M. R. Koblischka, H. Theuss, H. Kromuller, M. Leghissa, M. Kraus, and G. Saemann-Ischenko, Phys. Rev. B 47, 373 (1993).
- Kilic et al. (1998) A. Kilic, K. Kilic, and S. Senoussi, J. Appl. Phys. 84, 3254 (1998).
- Sonier et al. (1999) J. E. Sonier, R. F. Kiefl, J. H. Brewer, D. A. Bonn, S. R. Dunsiger, W. N. Hardy, R. Liang, R. I. Miller, D. R. Noakes, and C. E. Stronach, Phys. Rev. B 59, R729 (1999).
- Spitzer (1964) F. Spitzer, Principles of Random Walk (Princeton, New Jersey, 1964).
- Gardiner (1983) C. W. Gardiner, Handbook of Stochastic Methods (Springer-Verlag, Berlin, 1983).
- Dorogovtsev and Kuzmin (1992) S. N. Dorogovtsev and Y. I. Kuzmin, Phys. Lett. A 170, 245 (1992).
- Fangohr et al. (2001) H. Fangohr, S. J. Cox, and P. A. J. de Groot, Phys. Rev. B 64, 064505 (2001).
- Turchinskaya et al. (1993) M. Turchinskaya, D. L. Kaiser, F. W. Gayle, A. J. Shapiro, A. Roytburd, V. Vlasko-Vlasov, A. Polyanskii, and V. Nikitenko, Physica C 216, 205 (1993).
- Welp et al. (1994) U. Welp, T. Gardiner, D. Gunter, J. Fendrich, G. W. Crabtree, V. K. Vlasko-Vlasov, and V. I. Nikitenko, Physica C 235-240, 241 (1994).
- Feynman and Hibbs (1965) R. P. Feynman and A. R. Hibbs, Quantum Mechanics and Path Integrals (McGraw-Hill, New York, 1965).
- Kuzmin (2001b) Y. I. Kuzmin, Phys. Lett. A 281, 39 (2001b).
- Kuzmin (2001c) Y. I. Kuzmin, Phys. Solid State 43, 1199 (2001c).
- Mandelbrot (1967) B. B. Mandelbrot, Science 155, 636 (1967).
- Mandelbrot (1977) B. B. Mandelbrot, Fractals: Form, Chance, and Dimension (Freeman, San Francisco, 1977).
- Mandelbrot (1982) B. B. Mandelbrot, The Fractal Geometry of Nature (Freeman, San Francisco, 1982).
- Mandelbrot (1986) B. B. Mandelbrot, in: Fractals in Physics, ed. by L. Pietronero and E. Tosatti, pp.3-28 (North-Holland, Amsterdam, 1986).
- Feder (1988) J. Feder, Fractals (Plenum Press, New York, 1988).
- Kuzmin (2002a) Y. I. Kuzmin, Tech. Phys. Lett. 28, 568 (2002a).
- Kuzmin (2002b) Y. I. Kuzmin, Phys. Lett. A 300, 510 (2002b).
- Warnes and Larbalestier (1986) W. H. Warnes and D. C. Larbalestier, Appl. Phys. Lett. 48, 1403 (1986).
- Wordenweber (1992) R. Wordenweber, Phys. Rev. B 46, 3076 (1992).
- Kuzmin et al. (1994) Y. I. Kuzmin, A. P. Paugurt, I. V. Pleshakov, and S. V. Rasumov, Supercond. Sci. Technol. 7, 41 (1994).
- Brown (2000) B. Brown, Phys. Rev. B 61, 3267 (2000).
- Prester (1998) M. Prester, Supercond. Sci. Technol. 11, 333 (1998).
- Hudson (1964) D. Hudson, Statistics (CERN, Geneva, 1964).
- Larbalestier et al. (2001) D. S. Larbalestier, L. D. Cooley, M. O. Rikel, A. A. Polyanskii, J. Jiang, S. Patnaik, X. Cai, D. M. Feldmann, A. Gurevich, A. A. Squitieri, et al., Nature 410, 186 (2001).