Orientational relaxation in a discotic liquid crystal
Abstract
We investigate orientational relaxation of a model discotic liquid crystal, consists of disc-like molecules, by molecular dynamics simulations along two isobars starting from the high temperature isotropic phase. The two isobars have been so chosen that (A) the phase sequence isotropic (I)-nematic (N)-columnar (C) appears upon cooling along one of them and (B) the sequence isotropic (I)-columnar (C) along the other. While the orientational relaxation in the isotropic phase near the I-N phase transition in system (A) shows a power law decay at short to intermediate times, such power law relaxation is not observed in the isotropic phase near the I-C phase boundary in system (B). In order to understand this difference (the existence or the absence of the power law decay), we calculated the the growth of the orientational pair distribution functions (OPDF) near the I-N phase boundary and also near the I-C phase boundary. We find that OPDF shows a marked growth in long range correlation as the I-N phase boundary is approached in the I-N-C system (A), but such a growth is absent in the I-C system, which appears to be consistent with the result that I-N phase transition in the former is weakly first order while the the I-C phase transition in the later is not weak. As the system settles into the nematic phase, the decay of the single-particle second-rank orientational OTCF follows a pattern that is similar to what is observed with calamitic liquid crystals and supercooled molecular liquids.
I Introduction
The anisotropy in molecular shape plays a crucial role in the rich phase behavior that thermotropic liquid crystals exhibit deGennes-book ; Chandrasekhar-book . Calamitic liquid crystals, that comprise rodlike molecules, are long known and their phase behavior and dynamics have been extensively investigated over decades deGennes-book ; Chandrasekhar-book . The discovery of discotic liquid crystals, that consist of disclike molecules, is, however, more recent and dates back only to the late 1970s Chandrasekhar-Pramana-1970 . Due to its unique structural, elctrical and optical properties, discotic liquid crystals have drawn considerable amount of interests in recent past Ohta-Proc-1999 ; Adam-Nature-1994 ; Yoshino-Proc-1999 . Upon cooling from the high temperature isotropic (I) phase, discotic liquid crystals typically exhibit a nematic (N) phase and/or a columnar (C) phase Chandrasekhar-Ranganath-RPP-1990 . The discotic nematic phase is analogous to the nematic phase formed by rodlike molecules in that there is a long-range orientational order without the involvement of any long-range translational order. In the columnar phase that is typical of discotic liquid crystals, the molecules are stacked on top of each other giving rise to a columnar structure. These columns form a long-range two dimensional order in the orthogonal plane with either a hexagonal or a rectangular symmetry. While the sequence of phases I-N-C has been observed experimentally with a number of discotic liquid crystals upon cooling, there have been only a few cases where I-C transition is observed Hindmarsh-JMC-1993 . Although these are highly interesting systems to study and computer simulation studies of model liquid crystals have undergone an upsurge in recent times Pasini-Zannoni-book ; Wilson-IRPC-2005 , we are aware of only very few studies of orientational relaxation on discotic liquid crystals Zannoni-JMC-2001 compared to that on rod-like molecules.
Discotic molecules typically contain an aromatic core with flexible chains added in the equatorial plane Zannoni-JMC-2001 . While atomistic models could in principle be undertaken, molecular models, where mesogens are approximated as particles with well-defined anisotropic shape, find their utility in obtaining a rather generalized view. A simple approach along this line involves consideration of purely repulsive models involving hard bodies Allen-ACP-1993 . This rather extreme choice is inspired by the idea that the equilibrium structure of a dense liquid is essentially determined by the repulsive forces which fix the molecular shape Andersen-ACP-1976 . Along this line, thin hard platelets Eppenga-Frenkel-MP-1984 , hard oblate ellipsoids of revolution Frenkel-Mulder-MP-1985 ; Allen-PRL-1990 , and cut hard spheres Veerman-Frenkel-PRA-1992 have been investigated. Such an approach is appealing for its simplicity Allen-ACP-1993 . However, temperature plays no direct role in purely repulsive models on the contrary to what is desired for thermotropic liquid crystals Allen-ACP-1993 . In this respect, the Gay-Berne pair potential Gay-Berne-JCP-1981 , which is essentially a generalization of the Lennard-Jones potential to incorporate anisotropic interactions, or one of its variants Gay-Berne-JCP-1981 , where mesogens are approximated with soft ellipsoids of revolution, appears to serve as a more realistic model. In fact, discotic liquid crystals, modeled by the Gay-Berne family of potentials, have been found to capture the key features of the experimentally observed phase behavior Emerson-MP-1994 ; Bates-Luckhurst-JCP-1996 ; Capiron-PRE-2003 . In a density functional theoretical approach with a form of the Gay-Berne potential modified for discotic liquid crystals, the isotropic-nematic-columnar phase behavior has recently been studied for various aspect ratios Coussaert-Baus-JCP-2002 .
Dynamics of discotic liquid crystals have drawn attention as well Allen-PRL-1990 ; Maliniak-JCP-1992 ; Zamir-JACS-1994 ; Groothues-LC-1995 ; Dong-MP-1999 ; Dong-Morcombe-LC-2000 ; Dvinskikh-PRE-2002 ; Mulder-JACS-2003 ; Zhang-Dong-PRE-2006 . The focus has often been on the dynamics of the columnar phase Zamir-JACS-1994 ; Dong-MP-1999 ; Dvinskikh-PRE-2002 ; Mulder-JACS-2003 ; Zhang-Dong-PRE-2006 . In this work, we have undertaken molecular dynamics simulations of a system of oblate ellipsoids of revolution interacting with a modified Gay-Berne pair potential to study temperature dependent orientational relaxation along two isobars. We have chosen two isobars such that the phase sequence I-N-C appears upon cooling along the one at a higher pressure and the sequence I-C along the other. We have investigated temperature dependent orientational relaxation across the isotropic-nematic transition and in the isotropic phase near the I-C phase boundary with a focus on the short-to-intermediate time decay behavior. This work follows up our recent work Chakrabarti-PRL-2005 , which has reported the emergence of power law decay regime(s) in orientational relaxation across the isotropic-nematic transition. In the spirit of the universal power law in orientational relaxation in thermotropic liquid crystals suggested therein Chakrabarti-PRL-2005 , we compare the orientational dynamics we observed here with those of calamitic liquid crystals obtained from recent optical Kerr effect measurements Gottkea-JCP-2002 ; Gottkeb-JCP-2002 ; Cang-CPL-2002 ; Li-JPCB-2005 and molecular dynamics simulations studies Jose-Bagchi-JCP-2004 ; Chakrabarti-PRL-2005 ; Bertolini-JPCB-2005 . We further discuss the analogous dynamics observed in supercooled molecular liquids.
The rest of the paper is organized as follows. Section II describes the model we have studied here along with some simulation details. In section III, we present the results with discussion. Section IV presents a theoretical analysis of the origin of the power law decay. Section V discusses about orientational pair distribution function before we conclude in section VI with a summary of the results and a few comments.
II Model and details of the simulation
The Gay-Berne (GB) pair potential, where each ellipsoid of revolution has a single-site representation, is an elegant generalization of the extensively used isotropic Lennard-Jones potential to incorporate anisotropy in both the attractive and the repulsive parts of the interaction Gay-Berne-JCP-1981 . In the GB pair potential, th ellipsoid of revolution is represented by the position of its center of mass and a unit vector along the short axis in the case of an oblate. In this work, we have employed the form of the GB potential that has been modified by Bates and Luckhurst for discotic liquid crystals Bates-Luckhurst-JCP-1996 . In this modified form, the interaction between two oblate ellipsoids of revolution and is given by
| (1) |
where
| (2) |
Here defines the thickness or equivalently, the separation between the two in a face-to-face configuration, is the distance between the centers of mass of the ellipsoids of revolution and , and is a unit vector along the intermolecular separation vector . The molecular shape parameter and the energy parameter both depend on the unit vectors and as well as on as given by the following set of equations:
| (3) |
with and
| (4) |
where the exponents and are adjustable, and
| (5) |
and
| (6) |
with . Here is the aspect ratio of the ellipsoid of revolution with denoting the separation between two ellipsoids of revolution in a edge-to-edge configuration, and , and , where is the depth of the minimum of the potential for a pair of ellipsoids of revolution aligned parallel in a edge-to-edge configuration, and is the corresponding depth for the face-to-face alignment. Here denotes depth of the minimum of the pair potential for cross allignment. The parameterization, that we have employed here, is Bates-Luckhurst-JCP-1996 .
Molecular dynamics simulations have been performed with the model discotic system containing oblate ellipsoids of revolution in a cubic box with periodic boundary conditions. All the quantities reported here are given in reduced units, defined in terms of the Gay-Berne potential parameters and , each of which has been taken to be unity: length in units of , temperature in units of , being the Boltzmann constant, and time in units of , being the mass of the ellipsoids of revolution. We have set the mass as well as the moment of inertia of each of the ellipsoids of revolution equal to unity. The intermolecular potential has been truncated at a distance as in Ref. Bates-Luckhurst-JCP-1996 and shifted. The equations of motion have been integrated following the velocity-Verlet algorithm with the integration time steps of in the reduced units Ilnytskyi-CPC-2002 . Equilibration has been done in an NPT ensemble for a time period of . Following this, the system has been allowed to propagate with a constant energy and density for a time period of in order to ensure equilibration. Upon observation of no drift in temperature, pressure, and potential energy, the data collection has been executed in a microcanonical ensemble. The model discotic system has been melted from an initial fcc configuration at high temperatures and low densities, and studied along two isobars at pressures and at several temperatures.
III Results and discussion
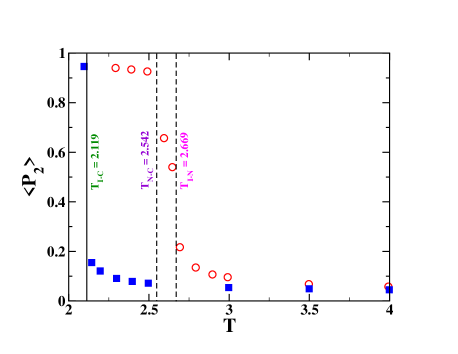
We first need to characterize the phases that appear along the isobars studied here. To this end, we have monitored the average second-rank orientational order parameter and the radial distribution function (data not shown here). In Fig. 1, we show the evolution of with temperature along the two isobars. The second-rank orientational order parameter has been computed as the largest eigenvalue of the order parameter tensor
| (7) |
where are the indices referring to the space fixed frame, is the -component of the unit vector , is the Kronecker symbol, and is the number of ellipsoids of revolution present in the system. tends to zero in the isotropic phase but retains a non-zero value because of the finite size of the system. In the nematic phase, has a value above . For the columnar phase, is above . In the present case, we observe the I-N-C phase sequence along the isobar at the higher pressure and the sequence I-C along the other isobar. Note the sharp jump in the for the I-C phase transition.
We have investigated orientational dynamics at the single-particle level by monitoring the temporal evolution of the corresponding second-rank orientational time correlation functions (OTCF), that is defined by
| (8) |
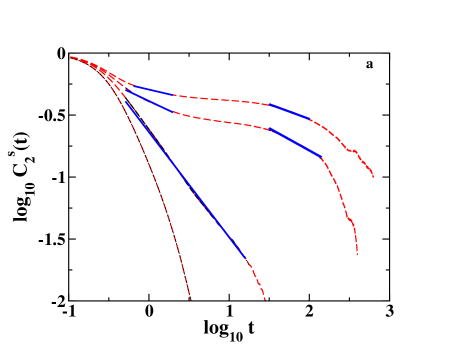
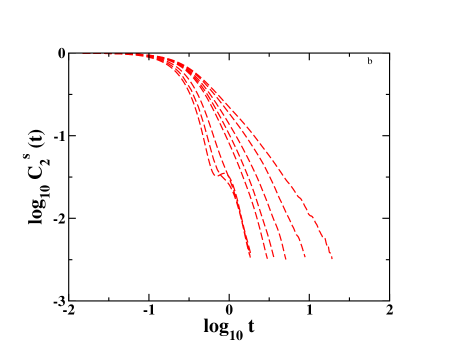
where is the second rank Legendre polynomial, and the angular brackets stand for ensemble averaging. In Fig. 2, we show the time evolution of the single-particle second-rank OTCF at several temperatures in log-log plots. The emergence of a power law decay at short-to-intermediate times near the I-N phase boundary is notable in Fig. 2(a) from the linear fit. It follows from Fig. 2(a) that as the system transits across the I-N phase boundary, two power law relaxation regimes, separated by a plateau, appear giving rise to a step-like feature. However, the decay of the single-particle second-rank OTCF in the isotropic phase near the isotropic-columnar phase boundary does not follow any power law as evident in Fig. 2(b). Note that the step like relaxation feature which is observed for the former is also absent in the later.
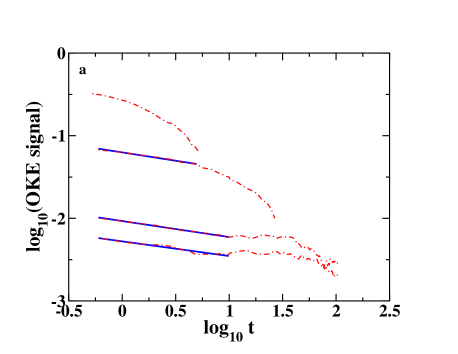
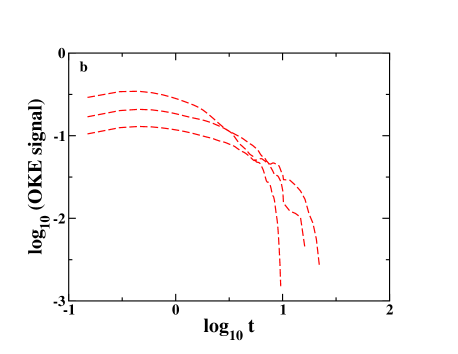
In optical heterodyne detected optical Kerr effect measurements (OHD-OKE), one probes collective orientational relaxation Torre-PRE-1998 . In recent OHD-OKE experiments with calamitic liquid crystals, the decay of the OKE signal has been found to follow a complex pattern Gottkea-JCP-2002 ; Gottkeb-JCP-2002 ; Cang-CPL-2002 ; Li-JPCB-2005 . The most intriguing feature has been the power law decay regimes at short-to-intermediate times Gottkeb-JCP-2002 ; Cang-CPL-2002 . We have therefore monitored the time evolution of the collective second-rank OTCF, defined by
| (9) |
In the present case, the negative of the time derivative of the collective second-rank OTCF provides a measure of the experimentally observable OHD-OKE signal. As monitoring the time evolution of is computationally quite demanding, we have restricted ourselves to the short-to-intermediate time dynamics that would suffice to compare the most intriguing aspect of the experimental observations Gottkeb-JCP-2002 ; Cang-CPL-2002 ; Li-JPCB-2005 . In Fig. 3, we show in log-log plots the temporal behavior of the OKE signal derived from present system at several temperatures. A short-to-intermediate-time power law regime is evident in the decay of the OKE signal on either side of the I-N transition as illustrated by the linear fitting in Fig. 3(a). In consistency with the single-particle dynamics, such a power law decay regime is not observed for the OKE signal in the isotropic phase near the I-C phase boundary as apparent in Fig. 3(b).
It follows from the time evolution of the single-particle second-rank OTCF shown in Fig. 2(a) that as the system settles into the nematic phase, two power law decay regimes, that are separated by a plateau, emerge. Such a feature bears a close resemblance with what has been observed recently for a model system of calamitic liquid crystals Chakrabarti-PRL-2005 . The decay pattern is also similar to those observed for models supercooled molecular liquids Kammerer-PRE-1997 ; Michele-PRE-2001 . In fact, based on a series of OHD-OKE measurements Fayers and coworkers have recently drawn an analogy in the orientational dynamics between calamitic liquid crystals in their isotropic phase near the I-N transition and supercooled molecular liquids Cang-JCP-2003 . The analogous dynamics could be captured in a subsequent molecular dynamics simulation study of model systems of these two classes of soft condensed matter Chakrabarti-Bagchi-Unpublished . The short-to-intermediate time power law decay of the OKE signal observed therein bears a close similarity with what is found in the present discotic system across the I-N transition.
The contrasting behavior observed in orientational relaxation in the isotropic phase near the I-N and the I-C phase boundaries is noteworthy. Such an observation may throw new light on the origin of the power law relaxation in the isotropic phase near the I-N transition. While the I-C transition is strongly first order in nature, the I-N transition is only weakly first order with certain characteristics of the continuous transition. This is reflected in the present case in a much larger change in the density marking the I-C transition as compared to the I-N transition (data not shown). The weakly first order nature of the I-N transition appears to play a role in the short-to-intermediate time power law relaxation. It seems fair to trace the origin of the power law decay in orientational relaxation to the growth in the orientational correlation length in the isotropic phase near the I-N transition. To this end, we attempt a theoretical analysis in the next section.
IV Theoretical analysis
The I-N phase transition is weakly first order both in calamitic and discotic systems. This is manifested in the growing orientational pair correlation length as the I-N phase boundary is approached from the high temperature isotropic phase. Apparently, a second order phase transition at a temperature only slightly lower (by ), where the orientational correlation length would have diverged, is preempted by the weakly first order phase transition. Nevertheless, even this weakly first order phase transition is driven by the growing correlation length. The temperature dependent growth of this correlation length can be given by the following expression deGennes-book i
| (10) |
where is in the Landau mean-field theory.
A simple mode coupling theory, based on time dependent density functional theory, shows that this growing correlation length can give rise to a power-law decay of the type observed in simulations. This approach uses the the generalized Debye-Stokes-Einstein relation between the correlation time, diffusion, and friction sarika-ACP-2001
| (11) |
and
| (12) |
where is equal to 1 for the single-particle relaxation, but is related to orientational caging for collective dynamics. It was shown elsewhere, the growing correlation length can give rise to a singular frequency dependence of over a frequency range with Gottkea-JCP-2002 ; Gottkeb-JCP-2002 . This power law dependence in the frequency dependence of friction in turn gives rise to a power law decay in the orientational time correlation function along with the slowing down of the relaxation.
Thus, in the above mentioned theory, the origin of the power law decay is essentially the same as observed near the critical phenomena Kunter-PRB-1982 . However, one may not expect a universal behavior since there is no true divergence. The absence of power law decay near the I-C phase boundary could then be due to the absence of any growing correlation length. The I-C phase transition is strongly first order in nature where both orientational and positional order set in at the same time. Since the growth of orientational correlation is small, a power law decay is not expected.
V Orientational Pair Distribution
To this end, we have calculated the distance dependent orientational pair distribution function Bates-JCP-1999 ; Allen-Tildesley-Book wihich is defined by
| (13) |
Here, is a spherical hermonics and denotes the sperical polar angle made by the particle symmetry axis with the intermolecular separation vector. it can be shown that at sufficiently large separation at which orientations are uncorrelated, two spherical harmonics can be averaged independently of each other. When the director is taken to define axis of the laboratory frame, separate averaging gives
| (14) |
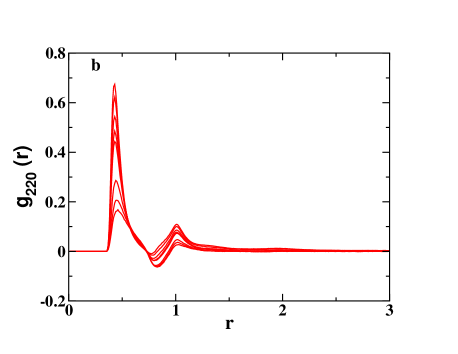
This coefficient will be vanished at large separations when ranks and are different. While for in the isotropic phase where order parameter vanishes and the coefficient tend to zero for large separatios, it will have a finite value if long range orientational correlation is devloped in the system. To verify our assertion made in theoretical section, we have calculated for the systems studied here along both the isobars and presented in Fig. 4(a) and Fig. 4(b), respectively. While the growth of orientational correlation length is clearly evident across the I-N transition for large separations, such a growth is found to be totally absent in the isotropic phase near the I-C phase boundary.

VI Conclusion
Let us first summarize the main results of the present work. In order to understand orientational relaxation in disk-like molecules that form discotic phase on cooling, we have performed molecular dynamics simulations of a model system that consists of oblate ellipsoids of revolution interacting with each other via a variant of the Gay-Berne pair potential. The system has been studied along two isobars so chosen that the phase sequence I-N-C appears upon cooling along the one and the sequence I-C along the other. We have investigated temperature dependent orientational relaxation across the I-N transition and in the isotropic phase near the I-C phase boundary with a focus on the short-to-intermediate time decay behavior. While the orientational relaxation across the I-N phase boundary shows a power law decay at short-to-intermediate times, such power law relaxation is not observed in the isotropic phase near the I-C phase boundary. Study of orientational pair distribution function shows that there is a growth of orientational pair correlation near the I-N transition whereas such a growth is absent in the isotropic phase near the I-C phase boundary. As the system settles into the nematic phase, the decay of the single-particle second-rank orientational time correlation function follows a pattern that is similar to what is observed with calamitic liquid crystals and supercooled molecular liquids Chakrabarti-PRL-2005 ; Kammerer-PRE-1997 ; Michele-PRE-2001 .
In order to further understand microscopic slowing down of the collective OTCF, we recall the expression Kivelson-ARPC-1980
| (15) |
where is the static second rank Kirkwood factor Allen-PRL-1987
| (16) |
and is a dynamic quantity which can be expressed in terms memory functions of orientation as Bern-Pecora-DynamicLightScattering-1975
| (17) |
where and is the projection operator. Here is the Liouville operator and is the component of the unit vector along the short axis of the oblate ellipsoid of revolution. It is non-trivial to calculate from first principles but one can always estimate it from Eq 15 where other qnatities are not hard to calculate in principle.
We have calculated static second rank Kirkwood factor anonymous-referee which may be thaught of the average number of molecules whose orientations are perfectly correlated to that of a given molecule Cheung-JCSFT-1997 . We find that shows the same behaviour as the order parameter variation for both the isobars studied here. Dynamic quantity has no such straight foroward physical interpretation like . Because of the slow power law decay, it has not been possible to calculate the relaxation times ( and ) near the I-N phase boundary. However, when calculated away from the phase boundary, when nrelaxation functions are nearly single exponential, the value of is found to be small. The dynamic quantity usually has small and negative value and also will not have much variation across the transitions as observed for several studies Allen-PRL-1987 ; Alms-JCP-1973 .
In contrast to our observation of the lack of power law decay in orientational relaxation of the discotic system in the isotropic phase near the I-C phase boundary, a very recent OHD-OKE experimental study by Fayer and coworkers finds a power law at short times and von schweidler power law at intermediate times along with a long time exponential relaxation in the isotropic phase above the I-C transition Li-JCP-2006 . The decay pattern is somewhat similar to what was observed for the calamitic system in the isotropic phase near I-N phase transition. It is possible that nematic fluctuations were important in their experimental system depending upon the choice of temperature. This point deserves further study.
Acknowledgments
This work was supported in part by the grants from the DST, India and the CSIR, India. DC acknowledges UGC, India and BJ acknowledges CSIR, India for providing financial support.
References
- (1) P. G. de Gennes and J. Prost, The Physics of Liquid Crystals, (Clarendon Press, Oxford, 1993).
- (2) S. Chandrasekhar, Liquid Crystals (Cambridge University Press, Cambridge, 1992).
- (3) S. Chandrasekhar, B. K. Sadashiva, and K. A. Suresh, Pramana 9, 471 (1977).
- (4) K. Ohta et al., Proc. . Inter. Conf. Dielec. Liq. (IDCL ’99), Nara, Japan, July 20-25, 561 (1999).
- (5) D. Adam et al., Nature. 371, 141 (1994).
- (6) K. Yoshino et al., Proc. . Inter. Conf. Dielec. Liq. (IDCL ’99), Nara, Japan, July 20-25, 598 (1999).
- (7) S. Chandrasekhar and G. S. Ranganath, Rep. Prog. Phys. 53, 57 (1990).
- (8) P. Hindmarsh, M. Hird, P. Styring, and J. W. Goodby, J. Mater. Chem. 3, 1117 (1993).
- (9) P. Pasini and C. Zannoni, eds., Advances in the Computer Simulations of Liquid Crystals, (Kluwer Academic Publishers, Dordrecht, 2000).
- (10) M. R. Wilson, Int. Rev. Phys. Chem. 24, 421 (2005).
- (11) C. Zannoni, J. Mater. Chem. 11, 2637 (2001).
- (12) M. P. Allen, G. T. Evans, D. Frenkel, and B. M. Mulder, Adv. Chem. Phys. 86, 1 (1993).
- (13) H. C. Andersen, D. Chandler, and J. D. Weeks, Adv. Chem. Phys. 34, 105 (1976).
- (14) R. Eppenga and D. Frenkel, Mol. Phys. 52, 1303 (1984).
- (15) D. Frenkel and B. M. Mulder, Mol. Phys. 55, 1171 (1985).
- (16) M. P. Allen, Phys. Rev. Lett. 65, 2881 (1990).
- (17) J. A. C. Veerman and D. Frenkel, Phys. Rev. A 45, 5632 (1992).
- (18) J. G. Gay and B. J. Berne, J. Chem. Phys. 74, 3316 (1981).
- (19) A. P. J. Emerson, G. R. Luckhurst, and S. G. Whatling, Mol. Phys. 82, 113 (1994).
- (20) M. A. Bates and G. R. Luckhurst, J. Chem. Phys. 104, 6696 (1996).
- (21) D. Caprion, L. Bellier-Castella, and J.-P. Ryckaert, Phys. Rev. E 67, 041703 (2003).
- (22) T. Coussaert and M. Baus, J. Chem. Phys. 116, 7744 (2002).
- (23) A. Maliniak, J. Chem. Phys. 96, 2306 (1992).
- (24) S. Zamir et al., J. Am. Chem. Soc. 116, 1973 (1994).
- (25) H. Groothues, F. Kremer, D. M. Collard, C. P. Lillya, Liq. Cryst. 18, 117 (1995).
- (26) R. Y. Dong, N. Boden, R. J. Bushby, and P. S. Martin, Mol. Phys. 97, 1165 (1999).
- (27) R. Y. Dong and C. R. Morcombe, Liq. Cryst. 27, 897 (2000).
- (28) S. V. Dvinskikh, I. Furó, H. Zimmermann, and A. Maliniak, Phys. Rev. E 65, 050702(R) (2002).
- (29) F. M. Mulder et al., J. Am. Chem. Soc. 125, 3860 (2003).
- (30) J. Zhang and R. Y. Dong, Phys. Rev. E 73, 061704 (2006).
- (31) D. Chakrabarti, P. P. Jose, S. Chakrabarty, and B. Bagchi, Phys. Rev. Lett. 95, 197801 (2005).
- (32) S. D. Gottke, D. D. Brace, H. Cang, B. Bagchi, and M. D. Fayer, J. Chem. Phys. 116, 360 (2002).
- (33) S. D. Gottke, H. Cang, B. Bagchi, and M. D. Fayer, J. Chem. Phys. 116, 6339 (2002).
- (34) H. Cang, J. Li, M. D. Fayer, Chem. Phys. Lett. 366, 82 (2002).
- (35) J. Li, I. Wang, and M. D. Fayer, 109, 6514 (2005).
- (36) P. P. Jose and B. Bagchi, J. Chem. Phys. 120, 11256 (2004).
- (37) D. Bertolini, G. Cinacchi, L. D. Gaetani, and A. Tani, J. Phys. Chem. B 109, 24480 (2005).
- (38) J. M. Ilnytskyi, and M. R. Wilson, Comput. Phys. Comm. 148, 43 (2002).
- (39) R. Torre, P. Bartolini, and R. M. Pick, Phys. Rev. E 57, 1912 (1998).
- (40) S. Kämmerer, W. Kob, and R. Schilling, Phys. Rev. E 56, 5450 (1997).
- (41) C. D. Michele and D. Leporini, Phys. Rev. E 63, 36702 (2001).
- (42) H. Cang, J. Li, V. N. Novikov, and M. D. Fayer, J. Chem. Phys. 118, 9303 (2003).
- (43) D. Chakrabarti, and B. Bagchi, (manuscript in preparation)
- (44) B. Bagchi, and S. Bhattacharyya, Adv. Chem. Phys. 116, 67 (2003).
- (45) R. Kutner, K. Binder, and K. W. Kehr, Phys. Rev. B 26, 2967 (1982).
- (46) M. A. Bates, and G. R. Luckhurst, J. Che. Phys. 110, 7087 (1999).
- (47) M. P. Allen, and D. J. Tildesley, Computer simulation of liquids, (Clarendon Press, Oxford, 1987).
- (48) D. Kivelson, and P. A. Madden, Ann. Rev. Phys. Chem. 31, 523 (1980).
- (49) M. P. Allen, and D. Frenkel, Phys. Rev. Lett., 58, 1748 (1987).
- (50) B. J. Berne, and R. Pecora, Dynamic light scattering, (John Wiley & sons, Inc, New York, 1975)
- (51) We thank anonymous referee for pointing out this issue.
- (52) T. W. Cheung, S. Fan, G. R. Luckhurst, and D. L. Turner, J. Chem. Soc., Faraday Trans., 93, 3099 (1997).
- (53) G. R. Alms, D. R. Bauer, J. I. Brauman, and R. Pecora, J. Chem. Phys. 59, 5310 (1973).
- (54) J. Li, K. Fruchey, and M. D. Fayer, J. Chem. Phys. 125, 194901 (2006).