Permanent address: ]College of Wooster, Wooster, OH 44691, USA Current address: ]Department of Geosciences, Pennsylvania State University, University Park, PA 16802, USA
Structure and heat capacity of Ne and Xe adsorbed on a bundle of carbon nanotubes
Abstract
The structural and thermal properties of Ne and Xe gases adsorbed on the outer surface of a large nanotube bundle have been evaluated with computer simulation. The potential energy model and numerical techniques were used previously to study Ar [N. M. Urban, S. M. Gatica, M. W. Cole, and J. L. Riccardo, “Correlation functions and thermal properties of Ar adsorbed on the external surface of a bundle of carbon nanotubes”, Phys. Rev. B 71, 245410 (2005)]. Heat capacity results for Ne and Xe exhibit peaks associated with reordering and “stripe” melting transitions for these gases.
pacs:
61.46.Fg, 68.43.De, 68.43.FgI Introduction
In recent years there has been considerable discussion of the properties of gases adsorbed on bundles of carbon nanotubes. Measurements of thermal properties (isotherms, isosteric heats, and thermal desorption behavior) have provided information about the energies of these gases, while scattering and spectral data have provided information about their structures and dynamical properties.ref1 ; ref2 ; ref3 ; ref4 ; ref5 ; ref6 ; ref7 ; ref8 In parallel with these experiments have been various theoretical and simulation studies, predicting virtually every property that is amenable to such measurements. Varying assumptions underlying the calculations pertain to the geometries and the adsorption potentials.
Our group has undertaken a series of computer simulation studies of simple classical gases adsorbed on the outside of large bundles.ref9 ; ref10 ; ref11 Since these bundle are large, the calculations actually assumed the bundle surface to be flat, which would be precisely correct if the bundle were actually infinite in radius or else if the bundle consists of a layer of nanotubes deposited on a surface. The potential experienced by an adsorbed molecule was evaluated by summing contributions from a line of parallel tubes, each of radius ; this approach neglects contributions from the interior of the bundle, an assumption that is plausible only for the first or second adlayer. Fig. 1 shows the potential energy that results for a Ne atom in such an environment, based on the potential model used in our group. That model ignores the chirality of the nanotubes by smearing out the carbon atoms into a cylinder made of continuous carbon matter. These assumptions are semiquantitatively accurate, at best.
Our simulations employ either canonical or grand canonical Monte Carlo methods. In early work, the familiar Metropolis algorithm was used, but our most recent studyref11 of Ar (denoted I) employed the efficient Wang-Landau algorithmref12 , discussed below. The adsorption behavior derived from the model consists of a sequence of “striped” phases, with the number of stripes increasing as the gas pressure is increased. The first of these, appearing at low because of the very attractive potential, is the so-called “groove” phase, in which the gas is confined to a quasi-one dimensional vicinity of the potential minimum, nestled between two adjacent tubes. As increases, a transition to a “three stripe” phase occurs, followed by the appearance of a well defined monolayer. An intriguing “second layer groove” phase has been seen in both simulations and experiments. Multilayer films can occur, but these have not been investigated because desorption precludes their observation, except at very low temperature.
This paper focuses on the thermal properties of Ne and Xe, extending the Ar study, I. The next section summarizes the methodology and reports results for a very low density phase, called . The number is the number of adparticles confined within one unit cell of the simulation (which is periodically replicated across the surface). The extent of this cell in the lateral () direction is 1.7 nm, taken to be the spacing between (10,10) tubes. In the direction (parallel to the tubes’ axes), the extent is , where is the Lennard-Jones diameter of the particles; the other gas parameter entering the calculation is , the well depth of the adatom-carbon pair interaction. In the direction, perpendicular to the bundle surface, the simulation cell extends a distance nm, where a hard wall terminates the simulation volume. Since this boundary underestimates the (macroscopic) experimental gas volume, its presence tends to suppress desorption relative to what is seen in experiments.
Sections III and IV describe simulation results obtained for Ne and Xe, respectively. Section V summarizes our principal results and draws conclusions.


II Calculations for
The Wang-Landau algorithm is a simulation technique that generates the density of states , the number of states per unit energy at energy , for a specified number () of particles; we omit a descriptor from for notational simplicity. The procedure used to compute is discussed in I and in greater detail in a recent thesis reporting this work.ref13 From this function, thermal properties may be computed at any temperature . Since classical systems have a specified kinetic energy per particle, , we focus on the potential energy and omit that contribution except when showing numerical results for the heat capacity . For example, the (mean) potential energy of the system is
| (1) |
The specific heat (in Boltzmann units) is then computed from
| (2) |
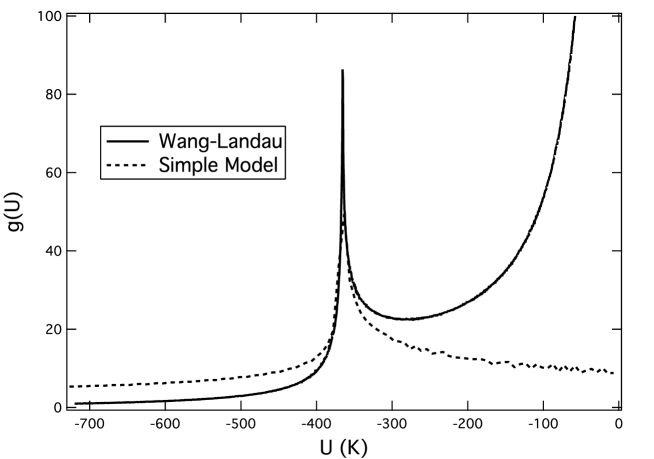
Results for for are shown in Fig. 2.ref13 This function exhibits a striking variation with , which can be understood with simplifying models, as follows. For classical systems, is strictly proportional to the volume of phase space confined between surfaces of energy and . This quantity, for N=1 particle, was called the “volume density of states” in I, where it was evaluated from histograms of the potential energy distribution in real space; the result agrees with that found directly with the Wang-Landau simulation method. The lowest energy “states” originate from the vicinity of the groove region. The resulting low behavior, , was derived in I by assuming that the constant energy contours are circles, centered on the groove; ellipses yield the same analytical form. The two most striking features of are a sharp peak, near a potential energy K of and a divergence near the desorption threshold, . The latter divergence is of the form , where the power 4/3 was derived in I from the asymptotic van der Waals interaction, . The divergent behavior just above the peak at , was derived in I, by analyzing an assumed potential energy near the cylindrical surface at which the monolayer forms: . Here, the value is the holding potential of a particle near a single cylindrical tube; the quadratic functional form is analogous to that found near the equilibrium position on a flat surface. To understand the divergent behavior of just below the peak (), we have invented a simple model potential that roughly characterizes the spatial dependence near the groove and monolayer:
| (3) |
Here and K/Å2 are fitting parameters determined from the potential. This form is shown in Fig. 1 to resemble that of the “true” potential near the divergence for . Even for this simple model, we cannot determine analytically, unfortunately, but we can evaluate it numerically. For the “true” potential the density of states was calculated directly using Wang-Landau Monte Carlo, and for the simple model it was calculated by discretizing space and binning the volume elements with potentials between and to produce a histogram. As seen in Fig. 2, there is a qualitative agreement between the two curves for in the region of the divergence, just below . The divergence originates because there is a large volume, near the outermost ellipse surrounding the groove, for which the potential energy is close to this value.
The specific heat of Ne and Xe, for , is analogous to that found for Ar. At low , the value 5/2 is expected for the specific heat because particles have two degrees of freedom due to potential energy of the confining potential within the groove, plus three more degrees of freedom from the kinetic energy. The peak in near K for Ne, or K for Xe, is due to excitation out of the groove, on to the cylindrical surface of the nanotube. This is confirmed by model calculations, as described in I, in which particles are located either in the groove region or on a nominally flat surface. The high limit, , is attributable to the potential energy contribution from one degree of freedom, associated with motion perpendicular to the surface. This behavior is depicted, along with higher coverage results, in Figs. 3 and 4.
III Ne adsorption at finite coverage
The Wang-Landau method was used to calculate the heat capacity for higher coverages (Fig. 3).111The Wang-Landau algorithm approached convergence for Ne , but ultimately failed to converge completely: the density of states at low energies did not achieve sufficient flatness even after the run time was extended. Convergence studies suggest that the small “shoulder” next to the first heat capacity peak may be a computational artifact, and the second peak may be slightly larger than is depicted. For Ne, the groove phase occurs at a density of adatoms in the simulation cell; the three stripe, monolayer, and second groove phases occur at , 72, and 81, respectively.
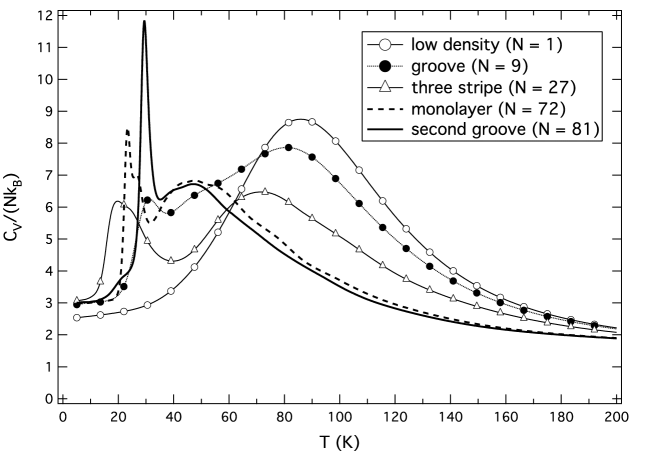
The low density results show a heat capacity peak near K, due to excitation of Ne atoms out of the groove. The higher coverage results have a similar peak (referred to here as the second peak), as well as an additional low temperature peak (first peak), i.e., a characteristic double peak structure in .
Monte Carlo configurational samples indicate that the second peak is due to substantial excitation of adatoms, as in the case. The excitation is primarily from the groove into the stripe or monolayer regions. The second peak occurs at somewhat lower temperature than in the case, because it is easier to excite atoms out of a densely packed groove than a nearly empty one. This is a result of repulsive mutual interactions that predominate when the groove nears completion.
The lower temperature, first peak in the heat capacity, in contrast, is not associated with promotion of adatoms into different regions of the substrate. Rather, it is due to “energy broadening”, in which the adatoms remain at or near the same sites, but are thermally excited over a broader range of energies. This phenomenon is exhibited in Fig. 4 for the three stripe phase. The distribution of Ne atoms indicates that at the first peak ( K), most of the atoms remain in the stripes, albeit with some promotion into the full monolayer. The atoms remaining in the stripes spread out, confined less strongly in the stripe potential minima, as a result of energy broadening. At the second peak, atoms in the stripes have been fully promoted into the monolayer and the stripes disappear.

IV Xe adsorption at finite coverage
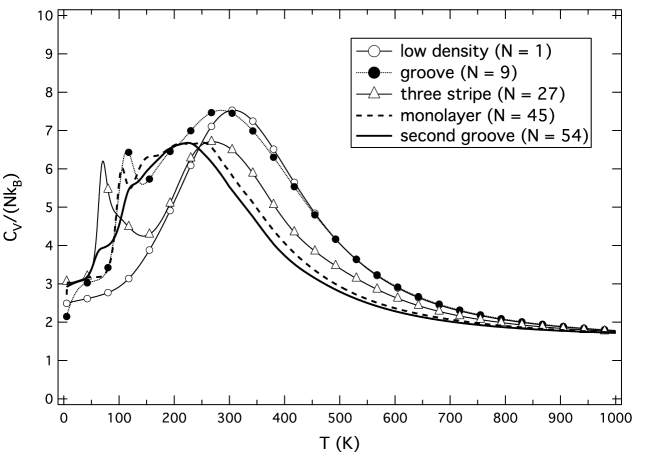
The Xe behavior, shown in Figs. 5 and 6, is qualitatively similar to that of Ne, as might be expected. There are some differences of detail, however. For example, the peaks are smaller and occur at much higher temperature in the Xe case. The higher temperature is attributable to the higher energy scale associated with the interactions’ strengths; the gas-gas well depth for Xe is a factor of seven higher than that of Ne and the adsorption potential is nearly a factor of three more attractive. (The behavior of of Ar, explored in I, is intermediate between these two.) We surmise that the smaller peak height is due to the fact that the importance of the adhesive interaction, relative to the cohesive interaction, is reduced in the Xe case, so the peak in , attributed primarily to the interaction with the substrate, is less narrow for Xe. For the same reason, we believe, “stronger” cohesive interactions, arising from subtle intra-film interactions, produce wiggles for of Xe, not found for Ne. (We have confirmed that these are not artifacts of the calculation by refining our simulations.) We conjecture that the intermediate “wiggle” in for the monolayer film, near K, is due to the two non-groove stripes melting into the monolayer (compare the and 150 K density distributions in Fig. 6); the lower-energy groove stripe itself remains intact until the groove-to-monolayer promotion at the higher temperature peak near K.

V Conclusions
We have derived the evolution of density with T and the heat capacity for Ne and Xe gases adsorbed on an array of nanotubes. The behavior is qualitatively consistent with that reported previously in I for the case of Ar. These predictions, along with those of the isotherms,ref9 ; ref10 ; ref11 are testable experimentally and we look forward to such results, from which conclusions may be drawn. The principal assumptions that may or may not be validated by such studies pertain to the geometry and the interactions. The latter type of assumption would seem more reliable, since the interactions are semi-empirical, derived from experiments involving adsorption on graphite. However, extrapolation to the nanotube case, as done here, represents a further, simplified assumption: that the chemistry of the atoms is not sensitive to their structure. While this might seem plausible for C, it remains to be verified. More severe, presumably, is the assumption that the interaction arises from a smeared-out array of C atoms. While clearly open to question, this assumption might be justified by the fact that since the assumed pair potential is already a rough approximation, the continuum approximation is not much more drastic. Of course, possible commensurate structures are not found in the continuum approach.
Concerning the geometry, the assumption of a unique radius for all tubes is another oversimplification,ref14 as is the presumption that the bundle radius is essentially infinite. While more detailed studies are feasible, they require significantly greater computational effort.
Acknowledgements.
This research was supported by NSF DMR-0505160 and REU grant assistance from the Penn State MRSEC program, supported by NSF DMR-0213623.References
- (1) M. R. Johnson, S. Rols, P. Wass, M. Muris, M. Bienfait, P. Zeppenfeld, and N. Dupont-Pavlovsky, Chem. Phys. 293, 217 (2003); B. K. Pradhan, et al., J. Mater. Res. 17, 2209 (2002).
- (2) A. D. Migone and S. Talapatra, in Encyclopedia of Nanoscience and Nanotechnology, Vol. 4, edited by H. S. Nalwa (American Scientific Publishers, Los Angeles, 2004), p. 749.
- (3) S. Ramachandran et al., J. Low Temp. Phys. 134, 115 (2004).
- (4) Y. H. Kahng, R. B. Hallock, and E. Dujardin, Physica B 329, 280 (2003).
- (5) T. Wilson, A. Tyburski, M. R. DePies, and O. E. Vilches, J. Low Temp. Phys. 126, 403 (2002); F. R. Hung, K. E. Gubbins, R. Radhakrishnan, K. Szostak, F. Beguin, G. Dudziak and M. Sliwinska-Bartkowiak, Applied Phys. Lett. 86, 103110 (2005).
- (6) H. Chen, J. K. Johnson, and D. S. Sholl, J. Phys. Chem. B 110, 1971 (2006); C. Matranga, L. Chen, B. Bockrath, and J. K. Johnson, Phys. Rev. B 70, 165416 (2004); A. Kuznetsova, J. T. Yates, Jr., V. V. Simonyan, J. K. Johnson, C. B. Huffman, and R. E. Smalley, J. Chem. Phys. 115, 6691 (2001).
- (7) Adsorption by Carbons, edited by J. M. D. Tascon (Elsevier, Amsterdam, 2005).
- (8) D. G. Narehood et al., Phys. Rev. B 67, 205409 (2003).
- (9) S. M. Gatica, M. J. Bojan, M. W. Cole, M. M. Calbi, and J. K. Johnson, in Ref. ref7, .
- (10) S. M. Gatica, M. J. Bojan, G. Stan, and M. W. Cole, J. Chem. Phys. 114, 3765 (2001); M. M. Calbi, S. M. Gatica, M. J. Bojan and M. W. Cole, J. Chem. Phys. 115, 9975 (2001).
- (11) N. M. Urban, S. M. Gatica, M. W. Cole, and J. L. Riccardo, Phys. Rev. B 71, 245410 (2005).
- (12) F. Wang and D. P. Landau, Phys. Rev. E 64, 056101 (2001); D. P. Landau, S.-H. Tsai, and M. Exler, Am. J. Phys. 72, 10 (2004).
- (13) The density of states appearing in I for is mistaken. See N. M. Urban, Ph.D. thesis, Pennsylvania State University (2006), unpublished.
- (14) W. Shi and J. K. Johnson, Phys. Rev. Lett. 91, 015504 (2003).