Lifting of Ir{100} reconstruction by CO adsorption: an ab initio study
Abstract
The adsorption of CO on unreconstructed and reconstructed Ir{100} has been studied, using a combination of density functional theory and thermodynamics, to determine the relative stability of the two phases as a function of CO coverage, temperature and pressure. We obtain good agreement with experimental data. At zero temperature, the (15) reconstruction becomes less stable than the unreconstructed (11) surface when the CO coverage exceeds a critical value of 0.09 ML. The interaction between CO molecules is found to be repulsive on the reconstructed surface, but attractive on the unreconstructed, explaining the experimental observation of high CO coverage on growing islands. At all temperatures and pressures, we find only two possible stable states: 0.05 ML CO c overlayer on the (11) substrate, and the clean (15) reconstructed surface.
I INTRODUCTION
Automotive exhausts contain several noxious gases, such as CO and NO, which need to be converted to less harmful products (e.g., CO oxidized to CO2, and NO reduced to N2) before they are released into the atmosphere. The surfaces of metals like Pt, Ir and Rh are good catalysts for such reactions. A better understanding of the catalytic activity of these surfaces could lead to the development OF cheaper and better catalysts, and these reactions have therefore been the subject of extensive experimental and theoretical studiesLiu .
In response to reduced coordination at the surface, the {100} surfaces of the face centered cubic (fcc) metals Au, Pt and Ir reconstruct to form a corrugated quasi-hexagonal overlayer (hex) on top of the square fcc substrate. While Pt{100} and Au{100} display complex periodic patterns with large unit cellsAuPt , Ir{100} has a similar structure, but with a comparatively small (15) unit cell. Low energy electron diffraction (LEED) experimentsHove ; Lang ; Bickel ; Johnson and density functional theory (DFT) calculations Ge on Ir{100} have shown that the stable overlayer registry with respect to the substrate is in accordance with the “two-bridge model”. The lack of registry between overlayer and substrate atoms results in a significant buckling in the two topmost layersJohnson , as well as a lateral shift in the second layer. Moreover, the reconstruction appears to go down deep, into at least the fourth layerSchmidt . Though most previous studies have focused on adsorption and reaction mechanisms on Pt{100} rather than Ir{100}, in this work we choose to focus on Ir{100}, since its smaller unit cell makes it more accessible to ab initio calculations. However, the structural similarity of the reconstructions on Pt{100} and Ir{100} suggests that the chemical reactions and physical processes taking place on the two surfaces might have similar mechanisms.
Surface adsorbates such as CO, NO and O2 are known to lift the reconstruction on Pt{100} and Ir{100}. For Pt{100}, the adsorbate-induced lifting of the reconstruction has been widely investigatedThiel ; CO1 ; CO2 ; Ritter ; Borg . There have also been a few studies on the lifting of reconstruction on Ir{100} by molecular adsorbatesCOIr ; O2Ir ; Deskins ; Yeo95 ; Khatua . Measurements of heats of adsorption, on both unreconstructed and reconstructed Pt{100} and Ir{100}, by Hopkinson et al. CO2 , Yeo et al. Yeo95 and Ali et al. COIr , have shown that the binding energy of CO is greater on the unreconstructed surface than the reconstructed one; this provides the driving force for the lifting of the reconstruction upon adsorption of CO.
The catalytic oxidation of CO on metal surfaces is certainly one of the most important catalytic processes studied in surface science. When the catalyst is Pt{100} or Ir{100}, the CO-induced lifting of the reconstruction forms a crucial component of the catalytic cycle, since the surface alternates rapidly between being CO-rich and (after the CO has combined with oxygen to form CO2) being clean. Thus, the surface alternates also between being unreconstructed and reconstructed, and the thermodynamics and kinetics governing this process are of great interest if one wishes to gain a better understanding of the catalytic cycle.
The parameters that characterize the process by which the reconstruction is lifted are: (i) the adsorbate coverage on the metal surface, (ii) the nucleation of unreconstructed islands, and (iii) the growth rate of these islands. In the following paragraphs, we summarize the present state of knowledge regarding these three parameters:
(i) Coverage: What is the coverage of CO on the islands, and at what critical coverage is the lifting initiated? Is the critical parameter the global CO coverage, or is it a local CO coverage (that differs from the average value) that is important? In experimental investigations of the restructuring process on Ir{100} and Pt{100}, it has been reported that the local CO coverage on the growing (11) islands is 0.5 ML. However, the critical value of the total CO coverage, for the onset of the transition, has been found to be much lower than this, on both Ir{100} and Pt{100}. For example, thermal energy atomic scattering measurements on Ir{100} and Pt{100} suggest that the restructuring begins somewhere between 0.05 and 0.13 ML on Ir{100}COIr , and between 0.01 and 0.03 ML on Pt{100}CO2 ; while electron energy loss spectroscopy measurements by Behm et al.Behm and Rutherford back scattering measurements by Jackman et al.Jackman on Pt{100} have indicated that the lifting of the reconstruction is initiated at a critical CO coverage of 0.05 ML and 0.08 0.05 ML respectively. When the total CO coverage is 0.5 ML, the entire surface appears to be in the (11) phase.
(ii) Nucleation: It is not clear from the literature whether the nucleation of (11) islands is homogeneous or heterogeneous. On the one hand, the finding of similar CO adsorption energies on steps and terraces reported by Hopster et al.Ibach , indicates that the nucleation may be homogeneous. Using scanning tunneling microscopy (STM), Ritter et al.Ritter have proposed that homogeneous nucleation of the (11) islands takes place due to fluctuations in the density of CO molecules. According to them, when the islands grow beyond a critical size, they become stable and act as nucleation centers. The spatial progress of the transformation occurs when the rate of growth of the islands becomes large compared to their rate of nucleation. On the other hand, STM studies by Borg et al.Borg1 suggest that the restructuring is initiated by heterogeneous nucleation, the nucleation centers being step edges and structural irregularities disrupting the hexagonal structure along a direction close to the [] direction of their [N 1 ; ] reconstruction. In agreement with this, molecular dynamics (MD) simulations by van Beurden et al.Borg ; Kramer of the lifting of the reconstruction on Pt{100}, at CO coverages between 0.4 and 0.5 ML, indicate that the transformation is heterogeneously nucleated at step edges aligned along the [011] direction.
(iii) Growth rate: From their molecular beam experiments, Hopkinson et al. deduced how , the growth rate of the (11) islands, depends on the local CO coverage on the hex-surface (). They obtained a non-linear variation of the growth rate: , where is independent of , is the fraction of surface remaining in the reconstructed form, and the reaction order was found to be . From this, they concluded that 4 to 5 CO molecules must be involved cooperatively in the growth of the (11) phase. Similar studies by Ali et al.COIr of the CO-induced lifting of reconstruction on Ir{100} also showed a power law behavior for the growth of (11) islands, with . Recent time-resolved reflection absorption infrared spectroscopy (RAIRS) results indicate a similar power law relationship by an alternative, and very direct, technique Pratt .
For the Pt surface, the presence of a non-linear term in the growth law appears to be crucial to the appearance of oscillations in many catalytic processes, e.g., CO oxidation with NO CONO1 ; CONO2 , CO oxidation with O2COO21 ; COO22 and NO reduction with H2NOH21 ; NOH22 . Under reaction conditions, the catalyst surfaces undergo transformation; these are non-equilibrium processes. Moreover the reaction rate may not remain constant but changes periodically or exhibits chaotic behavior. There can also be the formation of spatial patterns on the catalyst surfaceNicolis , and these have been modelled recently within a sophisticated reaction-diffusion schemeAnghel . Although we are not aware of any literature concerning oscillatory reactions on Ir{100}, the experimental findings by Ali et al. suggest that such oscillatory behavior may be present at temperatures above 900 K.
What is the underlying mechanism that is responsible for the non-linear growth law? Hopkinson et al.CO1 and Ali et al.COIr have proposed a simple mechanism for the restructuring process which involves a cooperative phenomenon among CO molecules: due to statistical fluctuations of the local CO coverage on the hex phase, 4-5 CO molecules come together at the boundary of the growing (11) domain, or at a step, and convert 8-10 Pt atoms from a hex to square arrangement; however it is not clear why 4-5 CO molecules are needed or precisely how they cooperate. One explanation for the ‘magic’ value has been suggested by Passerone et al.Tosatti , who performed MD simulations on Au{100}, and found that when islands/craters are formed by adsorbing/desorbing Au atoms, they do not remain stable unless they exceed a critical size of 8-10 Au atoms. However, it is not clear that this number will translate to Pt or Ir surfaces, especially in the presence of CO. The restructuring of Pt{100} has also been studied in more recent MD simulations by van Beurden and coworkersBorg , who have found that the CO molecules initiate surface relaxations and lead to a shear tension between adjacent rows due to the preference for a square rather than a hexagonal coordination sphere, and the restructuring proceeds through the ejection of chains of Pt atoms, and a rearrangement of the remaining surface atoms. Their simulations showed no evidence of a cooperative phenomenon between 4-5 CO molecules, and the source of the non-linear growth law remains a mystery. However, it is important to note that their MD simulations were done at much higher CO coverages (0.4-0.5 ML) than the critical coverage at which the experiments showing the fourth-order power law dependence of the rate of (11) formation were conducted. The mechanism for the lifting of the reconstruction is clearly not the same for low and high CO coverage. At low coverage, lifting of the reconstruction occurs when random statistical fluctuations bring about a sufficiently high local coverage to instigate nucleation of (11) islands; at the high total coverages studied in the MD simulations, such high local coverage would be found across the whole surface at all times. The experimentally-observed power law dependence stems from the probability of bringing together 4-5 CO molecules within a sufficiently small area at low overall coverage.
As a first step towards quantifying these arguments theoretically, it is desirable first to understand the thermodynamics, i.e., at what coverage the phase transition becomes thermodynamically favorable. In this work, we determine this quantity through the study of the thermodynamics of the reconstructed and unreconstructed surfaces using ab initio DFT. We then extend these results to finite temperatures and pressures, by making use of the chemical potential. This is useful because it brings the results into regimes where it becomes possible to compare with experiment.
Our work is similar in spirit to a recent DFT study by Deskins et al.Deskins , who showed that the adsorption of atomic oxygen on Pt{100} makes the unreconstructed surface more thermodynamically stable than the reconstructed one. In their work, the reconstructed structure of Pt{100} was approximated by a unit cell. Note however that: (i) our focussing on Ir{100} enables us to use a relatively small unit cell that corresponds to the true reconstructed structure; (ii) we have studied the adsorption of CO; (iii) details of our analysis are also different.
The rest of this paper is structured as follows: Section II provides some details about our first-principles calculations. Sections III.1 and III.2 contain the results of our calculations on the clean Ir{100} surface (both unreconstructed and reconstructed), while our results for CO adsorbed on the unreconstructed and reconstructed Ir{100} surfaces are contained in Sections III.3 and III.4 respectively. We emphasize that it is particularly important to choose k-point meshes (used for Brillouin zone integrations) very carefully; this issue is discussed in Section II, while some illustrative examples are presented in III.3. The ab initio density functional theory results feed into an analysis using the entropy and the chemical potential, presented in Section III.5. Finally, we discuss the implications of our results and summarize in Section IV.
II DETAILS OF AB INITIO CALCULATIONS
It is known that the lifting of the reconstruction in the systems under study is governed by very small differences in the energies of the competing structures; it is therefore vital to do as accurate a calculation as possible. For this reason, we have chosen to perform ab initio calculations within the framework of density functional theoryDFT (DFT), since this is perhaps the most reliable method currently available for obtaining accurate values of ground state properties such as structures, surface energies and adsorption energies.
Our calculations have been performed using the CASTEP package, wherein the Kohn-ShamKS equations are solved iteratively by conjugate gradient minimization.CG We have used a plane wave basis set, with a cut-off of 25 Ry (340) eV, and ultrasoft pseudopotentials. The pseudopotentials for Ir, C and O are Ir_OO.usp, C_OO.usp and O_OO.usp respectively which are provided along with the CASTEP distribution (Version 4.2). For the exchange-correlation interactions, we have used the Perdew-Wang form of the generalized gradient approximation (GGA) Wang ; note that earlier calculationsGe showed that gradient corrections are essential in properly describing this surface, and that use of the local density approximation (LDA) instead of the GGA would incorrectly predict clean Ir{100} to be stable against reconstruction. Integrations over the Brillouin zone have been evaluated with a Monkhorst-Pack (MP) MP mesh (further details of which are given below), along with a Gaussian smearing function of width 0.1 eV.
In order to test the reliability of the pseudopotentials used in our calculations, we first performed calculations on bulk Ir and a CO molecule in the gas phase. For the former we obtain a lattice constant of 3.86 Å, which is in excellent agreement with the experimental value of 3.84 Å, while for the latter, we obtained a C-O bond length of 1.14 Åwhich also agrees very well with the experimental value of 1.13 ÅCRC .
For surface calculations, we use a supercell consisting of a slab of six layers of Ir atoms separated by a vacuum thickness of about 10 Å. The top four Ir layers are allowed to relax their positions, whereas the bottom two are fixed at the bulk separation (‘asymmetric’ slab). Further, only the top surface is allowed to reconstruct; note that the density of atoms is different on a reconstructed and unreconstructed surface. Thus, all such asymmetric slabs will contain one surface that is of interest to us, while the other side consists of a bulk-truncated (unrelaxed and unreconstructed) Ir{100} surface. In order to determine the surface energy of the latter, we also perform a calulation on a ‘symmetric’ slab, comprised of eight layers, of which the middle two are fixed at the bulk spacing, while the top three and bottom three layers are allowed to relax. A comparison of the symmetric and asymmetric slabs for the unreconstructed structure enables one to determine separately the surface energies of a relaxed and bulk-truncated surface.
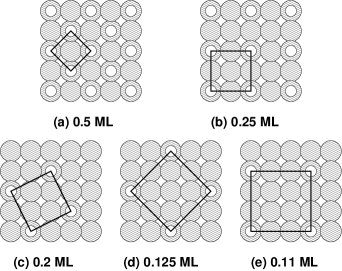
The size of the surface unit cell used depends upon whether whether we are looking at an unreconstructed surface or a reconstructed one, and what CO coverage we are considering. Calculations for the clean unreconstructed surface were carried out using both and cells; the results obtained with the two were almost identical. For the clean reconstructed surface, we use a cell. To study CO adsorption on the unreconstructed and reconstructed surface we adsorb CO on only one side (the side which we are allowing to relax) of the ’asymmetric slab’. For adsorption of CO on the unreconstructed surface, we consider coverages of 0.11, 0.125, 0.2, 0.25 and 0.5 ML. The unit cells used for these calculations are shown in Fig. 1; note that (i) all the unit cells are square, i.e., the distance between adjacent CO molecules is the same in both directions, and (ii) the cells for different coverages are not necessarily commensurate with one another. Finally, for studying adsorption of CO on the reconstructed surface, we use a cell, within which we consider CO coverages of 0.1, 0.2 and 0.6 ML. (Note that all CO coverages in this paper are given with respect to the density of atoms in the topmost layer of the unreconstructed surface.)
An important consideration is the choice of k-point meshes for Brillouin zone (BZ) sampling. For the surface cells, we have used Monkhorst-Pack meshes, of the form , where and determine the fineness of the mesh. This issue becomes particularly crucial in the present problem, since we are interested in computing energy differences that are comparable to the errors introduced by incorrect (unconverged) BZ sampling. Such errors can be reduced by using a k-point mesh that is as fine as possible, while keeping computational feasibility in mind. We have found that, as expected, the convergence is faster when one uses a mesh that does not include high symmetry points [the Brillouin zone center (BZC) and the k-points on the edges of the BZ]; this corresponds to choosing and to be even numbers. Examples of this are presented below in Section III.4.
The specific choices made for and for the various surface cells used in the present paper are given in Table 1; we emphasize that convergence with respect to k-point sampling has been carefully established for all the cases. Note also that computing surface energies and adsorption energies requires comparing the total energies of two systems (bulk and clean surface, or clean and covered surface); in such cases, we are careful to make sure that the unit cells and k-point meshes used for the two systems are either identical or related by folding, thereby further reducing the errors introduced by incomplete k-point sampling.
III RESULTS
III.1 Unreconstructed Clean Surface
Using the asymmetric six-layer slab described above, we find that the first interlayer distance is contracted (with respect to the bulk interlayer separation) by 6.14%. This result compares well with that obtained from ab initio calculations by Ge et al.Ge (6.5%), but is larger than the reported experimental value ( 3.6%)Heinz . Upon comparing the total energy of this asymmetric slab with that of the bulk structure, we find that the sum of the surface energies of the two surfaces (one relaxed and the other unrelaxed) is 3.01 eV per area. Next, using the symmetric eight-layer slab, which possesses two relaxed surfaces, we determine the energy of the relaxed unreconstructed surface, , to be 1.50 eV per area, while the energy of the unrelaxed (bulk-truncated) unreconstructed surface, , is 1.51 eV per area. This latter quantity is subtracted out when determining surface energies for slabs that are reconstructed and/or have CO adsorbed on only one side.
III.2 Reconstructed Clean Surface
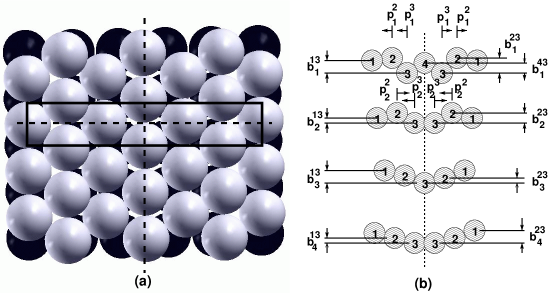
In the reconstructed surface, the topmost layer forms a quasi-hexagonal layer on top of the square substrate, as can be seen in Fig. 2(a). The surface unit cell is . The reconstruction results in buckling within the layers, as well as lateral shifts of the atoms with respect to their bulk-truncated positions. The parameters used to specify these structural rearrangements are indicated in Fig. 2(b), and the values we obtain for them are presented in Table 2. It can be seen that our results are in excellent agreement with those obtained from LEED and STM by Schmidt et al.Schmidt . In accordance with their observations, we find that in addition to the reconstruction of the topmost layer, there are significant lateral shifts and buckling in the three layers below. The only (minor) difference between our results and theirs is that our calculations yield a very small lateral shift of the third atom in the second layer () in a direction opposite to that determined by them.
The value we obtain for the surface energy of the reconstructed surface is = 1.45 eV per area, and we thus correctly obtain the result that the clean surface would prefer to reconstruct. Note also that the energy of reconstruction for Ir{100} is very small, viz. 0.05 eV/(11) area. This is in reasonably good agreement with the value of 0.07 eV/(11) area obtained by Ge et al.. The slight difference between our results and theirs presumably arise from the use of slabs of different thicknesses and different k-point meshes. (Note that the energy difference here is somewhat smaller than the value of 0.21 eV/(11) area found experimentally for the Pt{100} surface Yeo95 ).
III.3 CO on unreconstructed Ir{100}
As discussed in Sections I and II, the choice of a proper k-point mesh is very crucial for our calculations. Even values of and lead to better sampling of the BZ and quicker convergence of the adsorption energy. This fact becomes evident on inspecting Fig. 3, where we have shown how the adsorption energy, for CO at 0.5 ML and using a unit cell, converges as a function of k-point sampling. Accordingly, we use a mesh for this particular unit cell; similar checks were performed for other coverages and cells.
Experiments and previous theoretical calculationsTitmuss indicate that the atop site is the most probable site for CO adsorption. To verify this, and compare our results with previous DFT calculations and LEED measurements,Titmuss , we calculate the geometry and adsorption energies of CO molecules occupying hollow, bridge and atop sites within a (22) surface unit cell, and at 0.5 and 0.25 ML CO coverages. The adsorption energy per CO molecule, , is given by:
| (1) |
where , and are the the total energies of the slab with CO adsorbed on it, the clean slab, and a CO molecule in the gas phase, respectively, while is the number of CO molecules adsorbed per surface unit cell. The results obtained by us for , for different sites at the two coverages considered, are summarized in Table 3. Although there are slight numerical differences between the adsorption energies obtained from our calculations and those of Titmuss et al.Titmuss , both sets of calculations predict that CO molecules adsorb on the atop site. The differences in the numerical values of the adsorption energy obtained from the two calculations presumably arise from the use of slabs of different sizes and different k-point mesh. The structural parameters are also in good agreement with both the LEED measurements and theoretical calculations.
We go on to study the variation of the adsorption energy of CO on the atop site as a function of CO coverage. The results are summarized in the second column of Table 4. The difference in adsorption energy between 0.5 ML and 0.25 ML CO coverage is 0.04 eV. For lower coverage, ( ML) the adsorption energy is more or less constant ( 2.51 eV). The slight variation in the numerical values of Eads is most likely due to numerical errors that arise because the k-point meshes used for different surface unit cells are not exactly commensurate. At lower coverage, the distance between CO molecules increases, decreasing the interaction between them. At sufficiently low coverage, the CO molecules are so far apart that they do not interact with one another, resulting in a constant value of the adsorption energy. The increase in Eads with increase in CO coverage indicates the presence of very weak attractive interactions between nearest-neighbor CO molecules on the unreconstructed surface.
In addition to the CO adsorption energies, we also calculate the “surface energies” () at different CO coverages. These “surface energies” will be used below as a measure of the stability of the reconstructed and unreconstructed surfaces. We define the “surface energy” of the CO covered surface () as:
| (2) |
where is the ratio of the area of the surface unit cell to that of the (11) cell, and the superscript represents the unrelaxed and unreconstructed lower surface of the slab.
III.4 CO on reconstructed Ir{100}
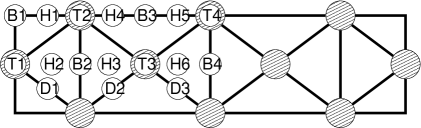
CO adsorption on the reconstructed surface has been studied for coverages of 0.1, 0.2 and 0.6 ML. In all the cases, we use a (25) supercell, so as to minimize the interaction between periodic images of CO molecules in adjacent supercells. Since the reconstructed surface is quasi-hexagonal in nature, there are many possible adsorption sites. The different adsorption sites which we consider for CO adsorption at 0.1 ML coverage are shown in Fig. 5. Our result for the adsorption energies for these different sites are given in table 5. Of all the different possibilities, we find that the “atop3” site (T3) is the most probable one. While it is not surprising that CO prefers an atop site, it is somewhat unexpected that the most favoured site is atop the Ir atom that is lies lowest within the buckled surface layer, rather than the Ir atom that protrudes. We intend to address the origin of this very surprising result in a future publication.
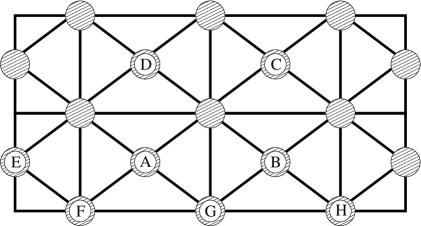
For a coverage of 0.2 ML, we have to adsorb two CO molecules in the (25) cell. Since CO clearly prefers to adsorb on the “atop3” (T3) sites, we choose a combination of two T3 sites. There are three inequivalent combinations of two T3 sites in the (25) cell, namely, A and B, A and C, and A and D (see Fig. 6). Our results for the CO adsorption energies at these different sites are listed in Table 5. Out of these three possible combination of sites, we find similar adsorption energies for the AB and AC combinations. The fact that the AD combination is disfavored suggests that CO molecules on this surface would prefer not to sit too close to each other. Comparing the adsorption energies for coverages of 0.1 and 0.2 ML, we find that the interaction between CO molecules on the reconstructed surface is repulsive in nature, in contrast to the very weak attractive interaction on the unreconstructed surface. For a coverage of 0.6 ML, we need to adsorb six CO molecules per (25) cell. Since the CO molecules interact repulsively on the unreconstructed surface, they will tend to spread out uniformly at low temperatures. Hence we assume that at a coverage of 0.6 ML, CO will adsorb at every atop site, as shown in Fig. 6.
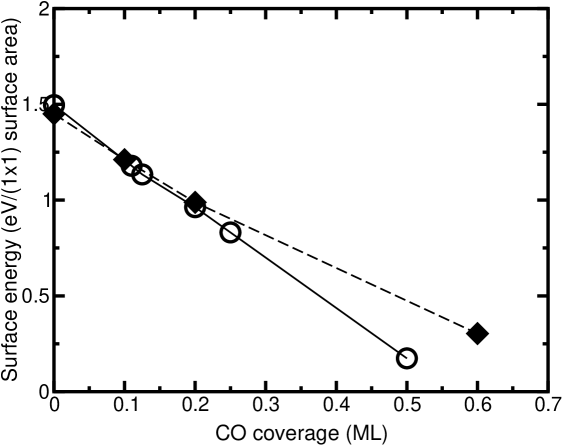
The variation, with coverage, of the “surface energies” of the reconstructed and unreconstructed surfaces (computed using Equation. (2)), is plotted in Fig. 7. At zero CO coverage, the reconstructed (15) surface is energetically more stable than the unreconstructed (11). However, at 0.1 ML coverage the unreconstructed surface is more stable than the reconstructed one by about 0.03 eV per (11) area. The crossover between the stability of the two surfaces takes place at around 0.09 ML CO coverage. Thus adsorption of CO switches the stability of the Ir{100} surfaces at a very low total coverage, that appears to be in very good agreement with the experimentally reported values of Hopkinson et al.. However, we note that this analysis has been done at conditions corresponding to zero temperature and pressure. In the next section, we extend this results to finite temperatures and pressures, by performing a thermodynamic analysis.
III.5 Thermodynamic Analysis
In order to account for the effect of varying gas-phase temperature and pressure upon the surface configuration, we apply concepts from classical thermodynamics. The free energy () of a system gives a measure of the stability of the system. For a multi-species system is given by:
| (3) |
where , , and are the pressure, volume, temperature and entropy, respectively. and are, respectively, the number of molecules and the chemical potential of species at the surface. is the internal energy of the system and is obtained from the DFT calculations.
In order to apply these concepts we need to have a clear demarcation between that which we consider to be a part of the “system” and that which we take to be its “surroundings”. For our case this can be achieved in two ways:
(i) entropy viewpoint, in which the “system” is considered to include the surface, the adsorbed molecules on the surface and the gas above the surface; the “surroundings” include only the world beyond some external gas container. Taking this view, the number of particles in the system is now fixed but the entropy is considerably large, since it includes large translational and rotational contributions from the gas molecules which are not adsorbed on the surface. Hence Equation (3) is modified as:
| (4) |
From this viewpoint, the changes in the configuration of the surface are driven by massive changes in entropy between molecules on the surface and in the gas phase; net adsorption (desorption) occurs when the enthalpy of adsorption is greater (less) than this entropy difference.
(ii) chemical potential viewpoint, in which the “system” consists of the surface and any molecules adsorbed on the surface. The rest of the world beyond then constitute the “surroundings”. Now to a fair approximation the entropy of the system is more or less negligible, since it consists only of vibrational contributions. On the other hand, the number of particles in the system is variable, so the chemical potential of the gas molecules must be included. The thermodynamic potential now becomes:
| (5) |
The changes in surface configuration are driven by the need to maintain the equality of surface and gas-phase chemical potentials; net adsorption (desorption) occurs when the gas-phase chemical potential is instantaneously greater (less) than the surface chemical potential. Note that from both the approaches one should get the same results.
III.5.1 Entropy Viewpoint
Taking the viewpoint that our thermodynamic system includes the surface, adsorbed molecules and the gas above it, we calculate the necessary free energy that must be minimized. This is achieved by defining free energies relative to that of the clean unreconstructed surface:
| (6) |
where and have been evaluated for the same unit cell, thus mitigating any systematic errors that may arise due to different k-point sampling. To evaluate the free energy of the solid phases, slab with CO molecules adsorbed on it () and for the clean one () we ignore the effects of because typically the entropy of the solid phase is negligible compared to that of the gas phase. For the solid phases we ignore the effects of and approximate it for CO in the gas phase, by assuming that the gas phase obeys the ideal gas equations. With these approximations the free energy of the solid phases equals the internal energy obtained from DFT calculations. The third term in Equation (6) contains the free energy per atom in the Ir bulk () and the difference in the number of Ir atoms () between the DFT calculations used to obtain the first two terms. In the last term, is the free energy of the CO molecules in the gas phase. The last term accounts for the decrease in entropy of the system due to the adsorption of CO molecules from the gas phase. represents the number of (11) cells over which the value of has been calculated. By construction, therefore, for the clean reconstructed surface is the negative of the reconstruction energy, while for the clean unreconstructed surface . The lowest value of under any temperature and pressure conditions indicates the most thermodynamically stable surface configuration, .
In order to evaluate we need to know the value of for the gas phase at different temperatures and pressures. The values of at a pressure of 1 bar and for a temperature range of 298.15 to 1500 K can be obtained from the CRC handbookCRC . We then derive the variation of with pressure and temperature from the following formula:
| (7) |
(=1 bar) is the reference pressure and is the universal gas constant. In Fig. 8, we plot a series of lines calculated at a variety of pressures, each plotting the value of as a function of temperature. It is apparent that for all temperatures and pressures considered, there are only two possible configurations of the surface that are thermodynamically stable, the clean unreconstructed (15) surface and the 0.5 ML c(22) CO overlayer on the unreconstructed substrate. The critical temperature at which the crossover in the stability occurs varies as a function of pressure and is depicted in Fig. 9.
III.5.2 Chemical Potential Viewpoint
In order to evaluate the relative stability of different surface configurations from the chemical potential viewpoint, we evaluate the free energy as given in by Equation (5). The chemical potential can be obtained by making use of its relationship to the enthalpy () and entropy:
| (8) |
The values of entropy at standard pressure can be extracted from the CRC HandbookCRC . The CRC Handbook lists only the change in at in going from absolute zero temperature to a variety of finite temperatures . Therefore can be extracted using the following relation:
| (9) |
where can be obtained from DFT calculations. The variation of with pressure is computed as:
| (10) |
IV Discussion and Summary
As in previous calculations, we find that Ir{100} is reconstructed; the stabilization energy being very small, viz. 0.05 eV per (11) area. Note that this is comparable to the errors typically introduced by incorrect k-point sampling, emphasizing the need for careful calculations. The structure of the reconstructed surface obtained by us is in excellent agreement with experiment. While the increase in density is confined to the topmost layer, the three layers below also display marked buckling and lateral shifts.
However, as more and more CO is adsorbed on the surface, there is a reversal in phase stability. Our calculations show that at zero temperature and pressure, when CO is adsorbed on Ir{100}, the relative stability of the reconstructed and unreconstructed phases is reversed at a very low total CO coverage of 0.09 ML. This shows that the lifting of the reconstruction is thermodynamically favoured at a low local coverage. The need for statistical fluctuations to bring 4-5 molecules together to trigger the lifting of the reconstruction is kinetic in origin, rather than thermodynamic.
On the unreconstructed Ir{100} surface, CO adsorbs at atop sites, and there is a very weak attractive interaction between CO molecules. Note that in this respect Ir{100} appears to behave differently from Pt{100}, where there is a repulsive interaction between CO moleculesBehm ; Yeo . The attractive nature of the CO-CO interactions on the unreconstructed (11) surface suggests that at sufficiently low temperature, CO molecules would tend to cluster together on being adsorbed on the fully unreconstructed surface in order to maximize their coverage, until a saturation coverage of 0.5 ML is achieved. The weakness of the interaction, however, means that such clustering may not easily be observed in experiments performed at moderate temperature. In contrast, the interaction between CO molecules adsorbed on the reconstructed (15) surface is repulsive, and they tend to spread out uniformly over the surface. Including the cost of lifting the reconstruction, the adsorption energy of CO molecules at any total coverage to form an island of 0.5 ML local coverage on a corresponding patch of (11) substrate (2.45 eV per CO molecule) is still higher than the adsorption energy of CO molecules at any coverage on the unreconstructed surface. This suggests that at any total coverage, the molecules will prefer to cluster into islands of local 0.5 ML coverage on patches of the unreconstructed (11) substrate, rather than remain spread out on the reconstructed (15) substrate. This bolsters the interpretation of 0.5 ML local CO coverage on the unreconstructed (11) islands by Ali et al. even at low total CO coverage. The higher heat of adsorption and the attractive nature of the interaction between CO molecules on the (11) unreconstructed surface provide a driving force to lift the reconstruction. For both Ir{100} (where the interaction between CO molecules on the unreconstructed surface is weakly attractive) and Pt{100} (where this interaction is weakly repulsive), the main effect is that the heat of adsorption on the unreconstructed surface far exceeds that on the reconstructed surface. As a result, the reconstruction lifting phenomenon remains similar on both Ir{100} and Pt{100}. However we donot understand the driving force behind the shift of the weakly attractive interaction between CO molecules on the unreconstructed surface to a repulsive nature on the reconstructed one.
Our thermodynamic analysis extends the results obtained from DFT calculations to a range of pressures and temperatures. For the entire temperature and pressure range considered by us, there are only two thermodynamically stable configurations, namely 0.5 ML of CO on the unreconstructed substrate in a c(22) structure, and the clean reconstructed substrate. The phase diagram shows that a small change in temperature and/or pressure can result in a very large change in coverage. From experiments, we know that the lifting of the reconstruction sets in at 490 K at very low pressures (- mbar). From our phase diagram we find that at similar pressure ranges, the transition temperature lies between 550 and 600 K. Thus our results from thermodynamic analysis are reasonably consistent with experimental observations. The slight discrepancies may have arisen from our use of the ideal gas equation of state to describe the gas phase. In practical applications such as in catalytic converters in vehicles, the reactions take place at temperatures above about 750 K and at 10 mbar pressure. According to our phase diagram, such temperatures and pressures lie very close to the transition line. Hence slight changes in the reaction conditions may lead to drastic changes in the surface, which in turn will affect the rate of chemical reactions.
To conclude, we have investigated the thermodynamic stability of unreconstructed and reconstructed phases of the Ir{100} surface, in the presence of CO. Though our results for the critical coverage, etc., are in good agreement with experiment, it still remains intriguing to speculate about the role played by kinetic factors in the restructuring process. In particular, the origin of the nonlinear growth law observed in experiments is still a puzzle; we hope that future work on the kinetics of the restructuring mechanism will shed light on this.
One of us (P.G.) acknowledges CSIR, India for a research scholarship. The Royal Society is also thanked for a University Research Fellowship (S.J.J.). We are grateful to Dr. Stephanie Pratt for helpful discussions.
References
- (1) Z-P. Liu, Pure Appl. Chem. 76, 2069 (2004).
- (2) M. A. Van Hove, R. J. Koestner, P. C. Stair, J. P. Bibiérian, L. L. Kesmodel, I. Bartǒs, and G. A. Somorjai, Surf. Sci. 103, 189 (1981).
- (3) M. A. Van Hove, R. J. Koestner, P. C. Bibérian, L. L. Kesmodel, I. Bartǒs, and G. A. Somorjai, Surf. Sci. 103, 189 (1981).
- (4) E. Lang, Müller, K. Heinz, M. A. Van Hove, R. J. Koestner, and G. A. Somorjai, Surf. Sci. 127, 347 (1983).
- (5) N. Bickel and K. Heinz, Surf. Sci. 163, 435 (1985).
- (6) K. Johnson, Q. Ge, S. Titmuss, and D. A. King, J. Chem. Phys. 112, 10460 (2000).
- (7) Q. Ge, D. A. King, N. Marzari, and M. C. Payne, Surf. Sci. 418, 529 (1998).
- (8) A. Schmidt, W. Meier, L. Hammer, and K. Heinz, J. Phys.: Condens. Matter 14, 12353 (2002).
- (9) P. A. Thiel, R. J. Behm, P. R. Norton, and G. Ertl, Surf. Sci. 121, L553 (1982).
- (10) A. Hopkinson, J. M. Bradley, X. C. Guo, and D. A. King, Phys. Rev. Lett. 71, 1597 (1993).
- (11) A. Hopkinson, X. C. Guo, J. M. Bradley, and D. A. King, J. Chem. Phys. 99, 8262 (1993).
- (12) E. Ritter, R. J. Behm, G. Pötschke, and J. Wintterlin, Surf. Sci. 181, 403 (1987).
- (13) P. van Beurden, B. S. Bunnik, G. J. Kramer, and A. Borg, Phys. Rev. Lett. 90, 066106 (2003).
- (14) T. Ali, B. Krotzer, A. V. Walker, and D. A. King, J. Chem. Phys. 109, 10996 (1998).
- (15) T. Ali, B. Krotzer, A. V. Walker, Q. Ge, and D. A. King, J. Chem. Phys. 109, 9967 (1998).
- (16) A. Deskins, J. Lauterbach, and K. T. Thomson, J. Chem. Phys. 122, 184709 (2005).
- (17) Y.Y. Yeo, C.E. Wartnaby and D.A. King, Science 268, 1731 (1995).
- (18) S. Khatua, Z.-P. Liu and D. A. King, Surf. Sc. 584, 214 (2005).
- (19) R. J. Behm, P. A. Thiel, P. R. Norton, and G. Ertl, J. Chem. Phys. 78, 7437 (1983).
- (20) T. E. Jackman, K. Griffiths, J. A. Davies, and P. R. Norton, J. Chem. Phys. 79, 3529 (1983).
- (21) H. Hopster, H. Ibach, and G. Comsa, J. Catalysis 46, 37 (1977).
- (22) A. Borg, A.-M. Hilmen, and E. Bergene, Surf. Sci. 306, 10 (1994).
- (23) P. van Beurden and G. J. Kramer, J. Chem. Phys. 121, 2317 (2004).
- (24) S. Khatua, S.J. Pratt and D.A. King, to be submitted.
- (25) A. Hopkinson and D. A. King, Chem. Phys. 177, 433 (1993).
- (26) A. Hopkinson and D. A. King, Faraday Discuss 6, 255 (1993).
- (27) M. Gruyters, T. Ali, and D. A. King, Chem. Phys. Lett. 232, 1 (1995).
- (28) M. Gruyters, T. Ali, and D. A. King, J. Phys. Chem. 100, 14417 (1996).
- (29) M. Gruyters, A. T. Pasteur, and D. A. King, J. Chem. Soc., Faraday Trans. 92, 2941 (1996).
- (30) A. V. Walker, M. Gruyters, and D. A. King, Surf. Sci. 384, L791 (1997).
- (31) G. Nicolis and F. Baras, Chemical Instabilities (Reidel, Dordrecht, 1984).
- (32) A.T. Anghel, R.B. Hoyle, I.M. Irurzun, M.R.E. Proctor and D.A. King, to be published.
- (33) D. Passerone, F. Ercolessi, and E. Tosatti, Surf. Sci. 454-456, 947 (2000).
- (34) P. Hohenberg and W. Kohn, Phys. Rev. 136, 864B (1964).
- (35) W. Kohn and L. J. Sham, Phys. Rev. 140, 1133A (1965).
- (36) M.C. Payne, M.P. Teter, D.C. Allan, T.A. Arias, and J.D. Joannopoulos, Rev. Mod. Phys. 64, 1045 (1992).
- (37) Y. Wang and J. P. Perdew, Phys. Rev. B 43, 8911 (1991).
- (38) Hendrik J. Monkhorst and James D. Pack, Phys. Rev. B 13, 5188 (1976).
- (39) CRC Handbook of Chemistry and Physics, editor-in-chief David R. Lide, 84th edition (2003-2004).
- (40) K. Heinz and G. Besold, Surf. Sci. 125, 515 (1983).
- (41) S. Titmuss, K. Johnson, Q. Ge, and D. A. King, J. Chem. Phys. 116, 8097 (2002).
- (42) Y. Y. Yeo, L. Vattuone, and D. A. King, J. Chem. Phys. 104, 3810 (1996).
| Surface unit cell | k-point mesh |
|---|---|
| 11 | 1010 |
| 1212 | |
| 22 | 88 |
| 88 | |
| 22 | 66 |
| 33 | 66 |
| 15 | 102 |
| 25 | 52 |
| Parameters | Our Calculations | Expt. Schmidt | Ge et al. Ge |
|---|---|---|---|
| (Å) | 1.93 | 1.92 | 1.92 |
| (Å) | 1.96 | 1.94 | 1.97 |
| (Å) | 2.24 | 2.25 | - |
| (%) | 16.09 | 16.67 | - |
| (Å) | 1.82 | 1.79 | - |
| (Å) | 1.88 | 1.88 | - |
| (%) | -2.56 | -2.08 | - |
| (Å) | 1.88 | 1.83 | - |
| (Å) | 1.94 | 1.93 | - |
| (%) | 0.54 | 0.52 | - |
| (Å) | 1.91 | 1.89 | - |
| (Å) | 1.923 | 1.91 | - |
| (%) | -0.34 | -1.01 | - |
| (Å) | 0.22 | 0.25 | - |
| (Å) | 0.53 | 0.55 | 0.47 |
| (Å) | 0.2 | 0.20 | 0.20 |
| (Å) | 0.03 | 0.05 | 0.05 |
| (Å) | 0.07 | 0.07 | 0.02 |
| (Å) | 0.04 | 0.07 | - |
| (Å) | 0.08 | 0.10 | - |
| (Å) | 0.01 | 0.01 | - |
| (Å) | 0.0004 | -0.02 | - |
| (Å) | 0.06 | 0.10 | - |
| (Å) | 0.03 | 0.05 | - |
| (Å) | 0.04 | 0.06 | - |
| (Å) | 0.01 | 0.03 | - |
| c(22) phase, 0.5 ML CO coverage | |||||||||||||||
| Site | |||||||||||||||
| eV/ CO molecule | (Å) | (Å) | (Å) | (Å) | |||||||||||
| Ours | Prev | Expt | Ours | Prev | Expt | Ours | Prev | Expt | Ours | Prev | Expt | Ours | Prev | Expt | |
| Atop | -2.69 | -2.65 | - | 1.86 | 1.86 | 1.81 0.05 | 1.16 | 1.16 | 1.16 0.05 | 0.14 | 0.19 | 0.13 0.05 | 1.82 | 1.82 | 1.82 0.04 |
| Bridge | -2.51 | -2.29 | - | 2.06 | 2.04 | - | 1.17 | 1.18 | - | 0.0 | 0.0 | - | 1.89 | 1.90 | - |
| Hollow | -2.1 | -1.5 | - | 2.29 | 2.28 | - | 1.2 | 1.2 | - | 0.0 | 0.0 | - | 1.90 | 1.92 | - |
| p(22) phase, 0.25 ML CO coverage | |||||||||||||||
| Atop | -2.83 | -2.61 | - | 1.86 | 1.86 | - | 1.16 | 1.16 | - | 0.15 | 0.20 | - | 1.82 | 1.83 | - |
| Bridge | -2.71 | - | - | 2.05 | - | - | 1.17 | - | - | 0.06 | - | - | 1.84 | - | - |
| Hollow | -2.34 | - | - | 2.46 | - | - | 1.2 | - | - | 0.0 | - | - | 1.84 | - | - |
| CO coverage | ||
|---|---|---|
| (ML) | unreconstructed surface | reconstructed surface |
| 1.0 | -1.93 | - |
| 0.6 | - | -1.90 |
| 0.5 | -2.55 | - |
| 0.25 | -2.51 | - |
| 0.2 | -2.51 | -2.27 |
| 0.125 | -2.52 | - |
| 0.11 | -2.53 | - |
| 0.10 | - | -2.31 |
| coverage | site | |
| (ML) | (eV/ CO molecule) | |
| T1 | -2.07 | |
| T2 | -2.09 | |
| T3 | -2.31 | |
| T4 | -1.92 | |
| H1 | -1.99 | |
| H2 | -1.68 | |
| H3 | -1.70 | |
| H4 | -2.01 | |
| 0.1 | H5 | -2.21 |
| H6 | -1.89 | |
| B1 | -2.00 | |
| B2 | -1.62 | |
| B3 | -2.19 | |
| B4 | -1.63 | |
| D1 | -1.76 | |
| D2 | -1.73 | |
| D3 | -2.00 | |
| A and B | -2.27 | |
| 0.2 | A and C | -2.27 |
| A and D | -2.15 | |
| 0.6 | A, B, E, F, G, H | -1.90 |