Dispersion of the odd magnetic resonant mode in near-optimally doped
Abstract
We report a neutron scattering study of the spin excitation spectrum in the superconducting state of slightly overdoped system (=87 K). We focus on the dispersion of the resonance peak in the superconducting state that is due to a S=1 collective mode. The measured spin excitation spectrum bears a strong similarity to the spectrum of the system for a similar doping level (i.e. ), which consists of intersecting upward- and downward-dispersing branches. A close comparison of the threshold of the electron-hole spin flip continuum, deduced from angle resolved photo-emission measurements in the same system, indicates that the magnetic response in the superconducting state is confined, in both energy and momentum, below the gapped Stoner continuum. In contrast to , the spin excitation spectrum is broader than the experimental resolution. In the framework of an itinerant-electron model, we quantitatively relate this intrinsic energy width to the superconducting gap distribution observed in scanning tunnelling microscopy experiments. Our study further suggests a significant in-plane anisotropy of the magnetic response.
pacs:
PACS numbers: 74.25.Ha 74.72.Hs, 25.40.FqI Introduction
It is now well established that the spin excitation spectrum in the superconducting (SC) state of many high- superconductors is dominated by an unusual spin triplet excitation Sidis_review ; rossat91 ; mook93 ; fong95 ; bourges96 ; fong96 ; miami ; fong00 ; dai01 ; Nature_Fong99 ; he ; tl2201 . This excitation is referred to as the magnetic resonance peak. It is centered at the planar antiferromagnetic (AF) wave vector (where is the lattice spacing) and at an energy that scales with the SC critical temperature, . Further, the resonance peak intensity vanishes above and exhibits a temperature dependence that looks like an order parameter. A renormalization of its characteristic energy with temperature is not observed within the experimental error bourges96 ; fong96 . This behavior has been reported in several families of copper oxides with maximum SC critical temperatures 90 K: in with uniformly spaced, single CuO2 layers tl2201 , as well as in bilayer systems such as (YBCO) rossat91 ; mook93 ; fong95 ; bourges96 ; fong96 ; miami ; fong00 ; dai01 and (Bi2212) Nature_Fong99 ; he . The magnetic resonance peak indicates the existence of a S=1 collective mode with a peculiar dispersion. Its downward dispersion starting at qAF was first observed in YBCO science_Bourges00 . Complementary measurements provided strong indications of a second upward dispersion starting from the resonance energy in optimally doped YBCOPRL_Pailhes04 ; PRL_Reznik04 ; woo . Importantly, both dispersive branches vanish above as does the magnetic resonance peak at . In strongly underdoped cuprates ( K), similar dispersive excitations have also been reported bourges97 ; stock ; hayden04 ; Nature_Hinkov04 ; hinkov06 , but only the downward branch vanishes above whereas the upward dispersion remains essentially unchanged across hinkov06 . Therefore, the spin excitation dispersion in YBCO exhibits a ”hour glass”-like shape centered at the resonance peak.
Recently, the debate became focused on the origin of the S=1 dispersive collective mode. The theoretical description of the mode is important, because antiferromagnetism is generally believed to play a significant role in the SC pairing mechanism in high- cuprates scalapino .
First, based on the spin dynamics data in the stripe ordered system , it has been proposed that could be a saddle point in the dispersion, with spin excitations propagating along a given in-plane direction (say ) below and along the perpendicular direction (i.e. ) above jmt04 ; revue_jmt . This gives rise to an X-like shape in twinned crystals where and are mixed. Saddle points can arise in models with spin and charge stripe order at low temperature. The spin excitation spectrum can then be modelled by a specific bond-centered stripe model according to which non-magnetic charge stripes separate a set of weakly coupled two-leg spin ladders in the copper oxide layers. The low energy excitations (below ) correspond to collective excitations that propagate perpendicular to the ladder direction, whereas the high energy part of the spectrum (above ) is associated to intra-spin ladder excitations propagating parallel to the lines of charges. This picture, later on sustained by calculations Voj04 ; Uhr04 ; Sei05 , implies a pronounced in-plane anisotropy of the magnetic spectrum. However, this is not consistent with the spin excitations in SC cuprates, in particular in underdoped and optimally doped YBCO Nature_Hinkov04 ; hinkov06 . Indeed, using detwinned YBCO samples hinkov06 , it has been shown that the spin excitation spectrum exhibits a 2D geometry both below Nature_Hinkov04 and above hinkov06 , inconsistent with a saddle-point dispersion. However, recent calculations of the spin dynamics considering fluctuating stripe segments Voj06 , shows that the magnetic spectrum is losing its 1D character for short charge segments (a few atomic distances) because they actually exist in both perpendicular directions. Further, it should be emphasized, once again, that the resonance peak intensity in all SC cuprates exhibits systematically a strong temperature dependence in the SC state Sidis_review . This is in a marked contrast to the data in the stripe-ordered system, where this anomalous temperature dependence is absent. These inconsistencies cast some doubt about a similar origin of the resonance peak seen in cuprates where superconductivity is well developed Sidis_review and the one reported in the stripe-ordered system jmt04 . As a matter of fact, it would be more meaningful to compare the spectrum in non-SC with the magnetic spectrum in the normal state of other SC cuprates, as it has recently been done in underdoped YBCO hinkov06 .
Second, starting from the metallic side of the phase diagram of high- superconductors and reducing the hole doping, one can try to understand the S=1 collective mode within an itinerant-electron model. It has been proposed that the resonant magnetic collective mode could be described as a spin exciton Eschrig_review ; PRL_Chubukov99 ; norman ; PRB_Onufrieva02 ; PRB_Schnyder04 ; PRL_Eremin05 , i.e a S=1 bound state, pushed below the gapped Stoner continuum in SC state by AF interactions. This type of excitation exists in the SC state only and vanishes when the gap disappears in the normal state. Alternatively, when starting from the Mott-insulator side of the phase diagram and increasing the hole doping, in framework of localized-spin models the mode can be viewed as the remnant of the magnon observed in the insulating AF state PRB_Sega03 ; condmat_Prelovsek06 . The collective modes of localized spins on Cu sites may survive in the metallic state, but are heavily damped by scattering from charge carriers. Long-lifetime collective excitations can then be restored in the SC state, when scattering processes are eliminated below the gapped Stoner continuum. When the mode energy is close to the gap, it can be viewed as a spin-exciton, as in the itinerant-spin approach PRB_Sega03 ; condmat_Prelovsek06 . Both approaches represent two different limits of a dual description of the magnetism of high- superconductors: localized and itinerant spins are tightly bound and cannot be disentangled PRB_Onufrieva94 ; JETP_Eremin06 . It is worth emphasizing that in a dual approach one can schematically ascribe the upper dispersion to the localized character of the magnetic response and the lower one to the itinerant one. However, future quantitative calculations are necessary to validate this picture.
In all of these models, the change of the band electronic excitations upon passing through has an important feedback on the spin excitation spectrum in the SC state. The determination of the electron-hole spin flip continuum then requires a good knowledge of the fermionic dispersion relations, which is still in a stage of rapid development in the YBCO system condmat_Borisenko06 . In contrast, the charge excitations in have been extensively studied by surface-sensitive techniques. First, the Fermi surface and the band dispersions have been determined by angle resolved photo-emission spectroscopy (ARPES) (see Eschrig_review ; arpes ; PRB_Kordyuk03 and references therein). Second, Scanning Tunnelling Microscopy (STM) data PRB_Howald ; PRL_McElroy05 ; Nature_Davis06 evidence a local distribution of the superconducting gap and then infer the low energy quasi-particle excitations and the Fermi surface through Friedel oscillations. Recently, attempts to compute the spin excitation spectrum in nearly optimally doped Bi2212 starting from ARPES measurements condmat_Campuzzano06 ; borisenko have been performed using the itinerant-spin approach (excitonic scenario).
In this paper, we present a study of both energy and momentum dependences of the resonant spin excitations in the SC state of a nearly optimally doped Bi2212. Our study reveals that the spin excitation spectrum in Bi2212 bears close similarity to the spin excitation spectrum reported in YBCO for the same doping level. We further show that the resonant spin collective modes are located below the gapped Stoner continuum computed from ARPES data. The combination of our inelastic neutron scattering (INS) measurements and ARPES and STM measurements on the same system provides the opportunity to test theoretical models for the spin dynamics in the cuprates.
II Experimental
For the present study, we used a single crystal of of slightly overdoped Bi2212 with volume 1.5 g and =87 K . The INS measurements were performed on the thermal triple-axis spectrometers IN8 at the Institute Laue Langevin in Grenoble (France), 2T at the Laboratoire Léon Brillouin at the reactor Orphée in Saclay (France), and PUMA at the reactor FRM-II in Garching (Germany). Measurements were carried out with a double-focusing PG(002) monochromator and a PG(002) analyzer. The final neutron wave vector was set to =4.1 Å-1, yielding an energy resolution 6 meV. A PG filter was inserted into the scattered beam in order to eliminate higher order contaminations. For high energy transfers (55 meV), the PG filter was removed and set to 5.5 Å-1. To cover the full q-dependence of the spin excitations, three different scattering planes were used for the measurements. The sample was successively oriented such that momentum transfers of the form (H,H,L), (K/3,K,L) and (H,0.3L,L) were accessible. We use a notation in which is indexed in units of the tetragonal reciprocal lattice vectors Å and Å-1.
The magnetic neutron scattering cross section is proportional to , the imaginary part of the dynamical magnetic susceptibility, weighted by the square of the Cu magnetic form factor, , and the detailed balance temperature factor bourges96 ; fong96 ; fong00 . For a paramagnetic system, it reads:
| (1) |
where is the full wave vector and is the planar wave vector in the CuO2 plane. cm is the neutron magnetic scattering length. Like the YBCO system, the Bi2212 system contains two planes per unit cell. Owing to the interaction between the planes within a bilayer, spin excitations with odd (o) and even (e) symmetry with respect to the exchange of the layer contribute to the spin susceptibility as in YBCO fong00 ; PRL_Pailhes03 , so that:
| (2) |
=0.109 is the reduced distance between the planes of the bilayer. Using different values of the c∗ component of the momentum transfer, the mode of each symmetry can be measured. The observation of resonant modes with both symmetries has recently been reported in Bi2212 Lucia in two samples and in particular in the sample studied here. In the present study, we focus on the odd spin excitations, that can be selectively probed by an appropriate choice of the L component: L=14 for the planar wave vector (0.5,0.5) and L=4.7 for the planar wave vector (0.5,1.5). Note that the square of the Cu magnetic form factor is about 1.4 times larger for (0.5,1.5,4.7) than for (0.5,0.5,14). This is because the magnetic form factor is anisotropic in the cuprates shamoto .
III Inelastic Neutron Scattering measurements
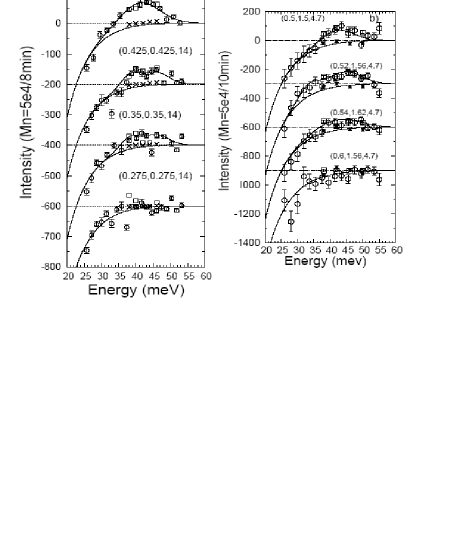
Throughout this paper, we focus on the enhancement of the magnetic response in the SC state, corresponding to the resonant spin excitations. To extract this response, we subtracted scans at T=10 K and T=100 K (=87 K). This procedure generates a negative background in the differential spectra, owing to the thermal enhancement of the nuclear background. The main contribution to this negative background comes from the thermal population of phonons given by the detailed balance factor. In the energy range of interest for the present study, 25-60 meV, the nuclear (phononic) background continuously decreases. Thus, the energy dependent negative background can be quite well approximated by a functional form like , with =100K. Owing to the weakness of the magnetic signal ( 10 % of the nuclear one), one also becomes sensitive to multiple scattering effects. This is the main reason why the background in the difference signal remains weakly negative even at high energy, where the detailed balance factor has a negligible effect. Difference scans performed far away from the antiferromagnetic wave vector at Q=(0.275,0.275,14) (Fig. 1.a) and Q=(0.5,1.8,4.7) (Fig. 1.b) show the typical energy dependence of the negative background. On top of the above described negative background, the enhanced magnetic intensity appears in energy scans at the AF wave vector at Q=(0.5,0.5,14) (Fig. 1.a) and Q=(0.5,1.5,4.7) (Fig. 1.b). The resonant magnetic signal is located at =42 meV and exhibits a Gaussian profile with an energy width of 13 meV (FWHM). From constant-Q scans (Fig. 1), it appears that the magnetic intensity at all wave vectors is limited at low energy by a spin-gap of 32 meV. Below the spin gap, the magnetic signal is, at least, less than 1/4 of its value at =42 meV. This value agrees with reports on YBCO for similar doping levels bourges96 ; science_Bourges00 ; reznik .
| Refs. | Tc(K) | Er(meV) | (meV) | (meV) |
|---|---|---|---|---|
| Fong et alNature_Fong99 | 91 | 43 | 13 2 | 12 2 |
| Present study | 87 | 42 | 13 2 | 11 2 |
| He et alhe | 83 | 38 | 12 2 | 10 2 |
| Capogna et alLucia | 70 | 34 | 8 1 | 5 1 |
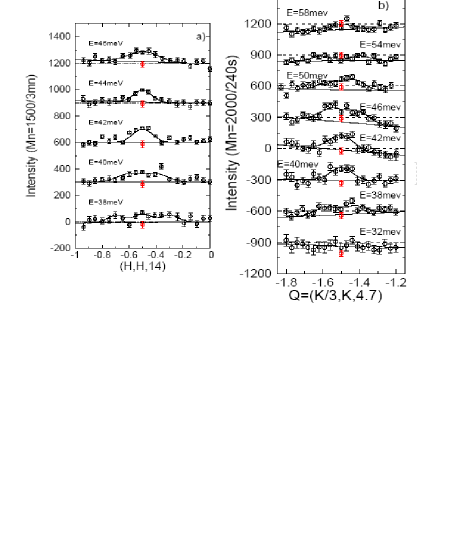
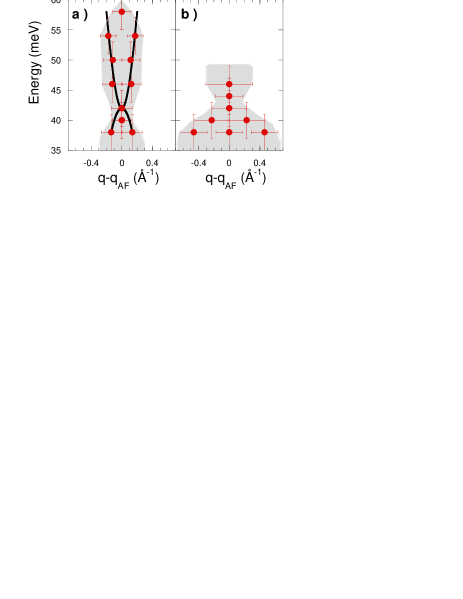
In addition to the constant Q-scans shown in Fig. 1, systematic constant-energy scans have been performed in each scattering plane (Fig. 2) to characterize the q-dependence of the magnetic intensity. Along the (130) direction, the magnetic resonance peak at 42 meV is centered at the AF wave vector and displays a Gaussian lineshape on top of a sloping background (Fig. 2.b). A similar signal can be observed at 40 meV, whereas at slightly lower energy, 38 meV, the magnetic response weakens and starts to broaden. Although the spin response is not clearly peaked at an incommensurate wave vector, the lineshape of the signal at this energy can be fitted to a double-peak structure. On decreasing the energy transfer further, no sizeable magnetic response can be detected at 32 meV. Nonetheless, within the error bars one cannot exclude a weak magnetic response of magnitude at most half of the one measured at 38 meV. It is worth noting that below 36 meV, the large nuclear background makes the detection of a magnetic response (if any) particularly difficult. The broadening of the magnetic response is not observed exclusively below the energy of the magnetic resonance peak. At higher energy (scans at 46 and 50 meV in Fig. 2.b), the magnetic response also broadens, but in contrast to the measurements at 38 meV, the magnitude of the signal remains comparable with that of the magnetic resonance. While at 54 meV a magnetic response with a double peak profile can be observed, at slightly higher energy, 58 meV, the magnetic response seems to be weak and commensurate, suggesting that the spin excitations may move back to the AF wave vector. The broadening of the magnetic response above and below =42 meV is consistent the differential energy scans performed away from the AF wave vector at Q=(0.52,1.56,4.7) and Q=(0.54,1.62,4.7) (Fig. 1.b). Indeed, at these wave vectors, the magnetic scattering is widely spread in energy, but shows a slight dip at 42 meV. The combination of energy scans and constant-energy scans along the (130) direction is consistent with the existence of resonant spin excitations dispersing upward and downward, as previously observed in the YBCO system. Guided by the data in YBCO science_Bourges00 ; PRL_Pailhes04 , we then model both dispersions of Fig. 3.a by the relations: where (-) and (+) correspond to the downward and upward dispersions, respectively. One obtains meV.Å and meV.Å in good agreement with the dispersions in YBCO obtained for similar doping levels science_Bourges00 ; PRL_Pailhes04 ; PRL_Reznik04 .
Along the (110) direction, the evolution of the momentum distribution of the magnetic signal as a function of the energy exhibits the same trends as those observed along the (130) direction, with a broadening at both high and low energies (46 meV and 40 meV in Fig. 2.a). A slight double-maximum structure also shows up in the energy scan at Q=(0.425,0.425,14) (Fig. 1.a). But a closer inspection of the data reveals marked differences. First, the signal begins to broaden already at 40 meV, and becomes almost twice as broad at 38 meV. At this energy, the lineshape of the magnetic response is now rather different, with a more complex structure that can be qualitatively described in terms of a central peak at the AF wave vector surrounded by two satellites of similar magnitude at Q= with =0.2. As a result of this expansion, a magnetic signal can still be observed in differential energy scans at Q=(0.35,0.35,14) (Fig. 1.a), i.e at a large distance in reciprocal space from the AF wave vector.
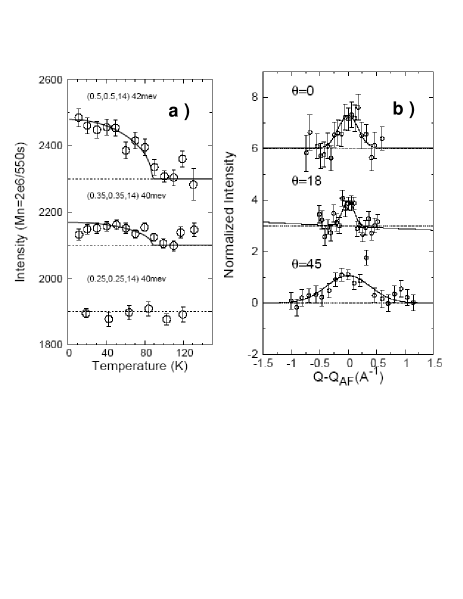
As emphasized above, one of the hallmarks of the resonant spin excitations in SC cuprates is their peculiar temperature dependence Sidis_review . In this respect, the behavior of Bi2212 is very similar to the phenomenology reported in YBCO. The magnetic resonance peak at 42 meV disappears steeply at , as can be seen in Fig. 4.a at 42 meV. The temperature dependence measured at Q=(0.35,0.35,14) and 40 meV suggests a similar change at , indicating that the differential signal at this wave vector is also of magnetic resonant type. At the background position, Q=(0.25,0.25,14), the T-dependence does not show any indication of a magnetic signal.
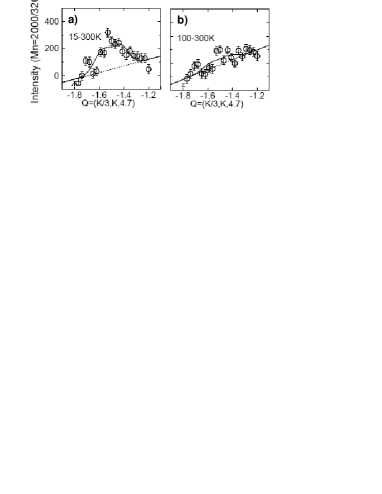
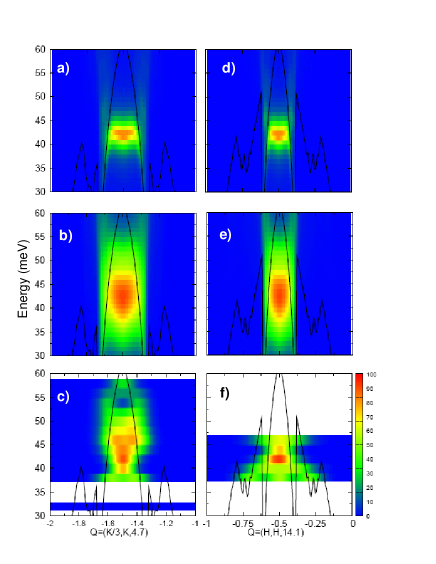
We now discuss some general aspects of the spin excitations of Bi2212. While the overall layout of the magnetic spectrum of Bi2212 is quite similar to that of YBCO, well-defined incommensurate magnetic peaks were not observed in Bi2212. Several reasons can be put forward to explain this difference. Obviously, the weak signal-to-noise ratio of the measurements in Bi2212 limits the possibility to see details of the q-dependence. In particular, we had to work with a broad q-resolution in order to pick up enough intensity. (Attempts with improved q-resolution were not successful because of insufficient intensity.) However, scans with similar resolution and scattering plane science_Bourges00 did reveal incommensurate peaks below in YBCO. Therefore, the origin of the difference between both systems is not purely instrumental, but at least in part intrinsic to Bi2212. It was previously noticedSidis_review that energy scans in Bi2212 exhibit a width larger than the energy resolution for all doping levels, as shown in Table 1, whereas the energy width of the odd resonance peak in YBCO is resolution-limited at optimal doping PRL_Pailhes04 ; PRL_Reznik04 . The intrinsic width of the mode blurs the details of the mode dispersion in Bi2212. If we nevertheless try to fit the data away from with a double peak structure, one obtains dispersive excitations both below and above as shown in Fig. 3, as previously reported in YBCO science_Bourges00 ; PRL_Pailhes04 ; PRL_Reznik04 . The overall energy and momentum dependences of resonant spin excitations then exhibit the typical hour-glass lineshape characterizing the resonant mode dispersion in YBCO, as evidenced by the color maps of Figs. 6.d-e deduced from our data along the two q-directions of Fig. 2. At 42 meV, the magnetic signal shrinks around . Further, below , additional magnetic excitations appear to develop in a momentum region far from . As shown by color maps of Figs. 6.d-e, the spectral weight of these excitations is maximum along the diagonal direction, leading to an anisotropy that we discuss in section V.
As pointed out at the beginning of this section, we focus on the enhancement of the magnetic response in the SC state. The main reason is that previous INS measurements in optimally doped Bi2212 Nature_Fong99 show that normal state excitations are not measurable around 40 meV. These early measurements are in agreement with the results in YBCO for the same doping level bourges96 ; fong96 . In YBCO miami , a systematic study as a function of hole doping indicates that the normal-state AF fluctuations weaken continuously with increasing doping level and fall below the detection limit above optimal doping miami . Note that the fact that the magnetic fluctuations are not sizeable above does not necessarily mean that they are absent, but it rather suggests that they are much weaker and/or broader in the normal state than in the SC state. For instance in weakly overdoped YBCO, the typical magnitude of the spin fluctuations left in the normal state at the resonance energy is estimated to be one order of magnitude weaker that magnetic resonance peak in the SC state bourges96 . In our slightly overdoped Bi2212 sample, the upper limit on the magnitude of the magnetic signal left in the normal state extracted from our data is about 1/4 of the signal in the SC state at 46 meV (Fig. 5). This is consistent with a previous report at 43 meV in an optimally doped Bi2212 sample Nature_Fong99 .
IV Fingerprints of the electron-hole spin flip continuum
In order to elucidate the relationship between the resonant spin excitations in the SC state and the gapped Stoner continuum, we have computed the threshold of the continuum in the odd channel for the two main directions along which most of the INS measurements were carried out (see Fig. 6.b-c): (130) and (110). One has to pay attention to the bilayer structure that affects both spin and charge properties. The motion of electron between the two layers in a bilayer unit leads to the formation of anti-bonding (a) and bonding (b) states, and consequently to a splitting of the Fermi surface, as shown in Fig. 6.a. The odd neutron scattering channel originates from electronic interband spin flip excitations, and the threshold of the Stoner continuum in the SC state is defined as the minimum , where is the electronic dispersion relation in the SC state. stands for the -wave SC gap and the bare electronic dispersion relation is described using a simplified tight-binding expression: . For a nearly optimally doped Bi2212 sample with a of 87 K, we used the following parameters determined by ARPES: =35 meV Mesot_PRL99 and for the parameters in units of PRB_Kordyuk03 . The chemical potential corresponds to a hole doping level determined from the SC transition temperature according to the phenomenological relationship of Tallon et al PRB_Tallon03 .
Before proceeding to the comparison of the locations of the gap in the Stoner continuum and the observed resonant spin excitations, one needs to mention that there are two ways to determine the absolute scale of electronic parameters. The value of these parameters in absolute units (meV) strongly relies on the estimate of the value of the nearest-neighbor hopping parameter , which in turn can be extracted from the Fermi velocity measured in ARPES experiments. Along the nodal direction, 2.0 eVÅarpes is related to the bare Fermi velocity by where describes the electronic interactions related to the real part of the electronic self-energy Eschrig_review ; arpes . In principle, can be determined by the band structure given by the Local Density Approximation (LDA). In a self-consistent experimental procedure using the Kramers-Kronig transformation to determine the self-energy PRB_Kordyuk03 , the energy scale is deduced from an estimate of the bare Fermi velocity along the nodal direction, 4.0 eV.ÅPRB_Kordyuk03 , yielding =397 meV, in good agreement with LDA predictions. An alternative approach to analyse the ARPES data essentially defines an effective band structure describing only low energy electronic excitations (see e.g. chang ). The hopping parameter determined in this way is about a factor of two smaller: meV. This does not significantly change the lineshape of the gapped Stoner continuum and can be ignored in this section. However, it is important for a quantitative description of the S=1 mode origin (see section VI).
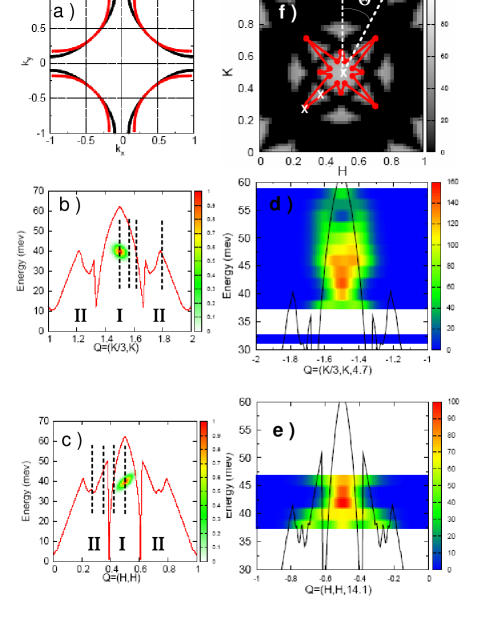
Figures 6d-e show color maps of the magnetic intensity deduced from fits to the constant energy scans of Fig. 2. The threshold of the gapped Stoner continuum is superimposed on the magnetic signal. For the sake of simplicity, one can define two distinct areas below the continuum (Fig. 6.b-c). In area I, the threshold of the continuum decreases away from the AF wave vector, exhibiting a dome-like shape. Area II corresponds to the remaining part of the gapped portion of the phase space. Along the (130) direction, the magnetic response in the SC state is confined to area I and appears to asymptotically approach the threshold of the continuum. The signal vanishes below the detection limit in areas where continuum excitations are possible according to the calculation.
Along the (110) direction, the situation is more complex. As shown in Fig. 6c,e, area I is smaller than along (130), so that its spread in momentum becomes similar to the q-width of the experimental resolution ellipsoid (Fig. 6.c). Moreover, the intrinsic energy width discussed above scrambles the observed magnetic response, limiting an accurate determination of the exact number of branches of the magnetic dispersion and their precise location. Some interesting observations can be made nonetheless. In particular, along (110) area II extends up to energies in the range 35-48 meV, higher than along (130). The extra magnetic signal along the (110) at 38 meV may hence be attributable to secondary spin excitations in area II, in addition to those observed in area I. In slightly underdoped YBCO6.85, such a secondary magnetic contribution has been observed in area II, albeit at higher energies around 54 meV PRL_Pailhes04 . There it was also shown that the continuum gives rise to almost vertical silent bands PRL_Pailhes04 , where the intensity of collective magnetic modes is suddenly suppressed presumably due to the decay into elementary electron-hole spin flip excitations. This scenario was further confirmed theoretically within the spin exciton model PRL_Eremin05 . Interestingly in Bi2212 the scan along (110) at 38 meV (Fig. 2.a) displays a slight minima at the planar wave vectors q(-0.4,-0.4) and q(-0.6,-0.6), which could be indicative of silent bands (see Fig. 6.c) in a location that coincides with the one expected based on the Fermi surface topology PRB_Kordyuk03 .
The comparison between the location of the observed magnetic excitation spectra and the momentum shape of the Stoner continuum of the -wave superconductor thus shows that spin excitations are only present in the gapped regions of the continuum. We emphasize that the locus of the Stoner continuum was computed from the electronic excitations directly measured by ARPES for the same doping level PRB_Kordyuk03 , without adjustable parameters. This interpretation is also qualitatively consistent with the converse computation of the imaginary part of the dynamical susceptibility from ARPES data in the framework of the spin exciton scenario condmat_Campuzzano06 ; borisenko . These computations indeed indicate the existence of two magnetic resonant modes, located in area I and area II respectively. The detailed momentum shape of the magnetic spectra (Figs. 6.d,e) further suggests that the resonant spin excitation spectra exhibit a hourglass lineshape mainly confined to area I. Overall, these results are in good agreement with previous studies carried out in YBCO system PRL_Pailhes04 ; stock ; hayden04 ; hinkov06 , although the intrinsic energy width of the magnetic modes in Bi2212 obscures some of the features.
V Anisotropy of the magnetic response
Another interesting experimental feature is the in-plane anisotropy of the magnetic response. Figure 4.b shows scans performed at 40 meV around the AF wave vector along 3 different directions: (100), (130), and (110). The data are labelled as a function of the angle between the direction of the scans and the (100) direction (see Fig. 6.f). Furthermore, the data are plotted as a function of the reduced distance to the AF wave vector (in units of Å-1), so that the q-widths of the signals are directly comparable. In all directions, we fit the magnetic peak to a single Gaussian. From where Å-1 (Full Width at Half Maximum) to where Å-1, the magnetic signal exhibits a Gaussian profile, with a reduction of its q-width at . On the contrary at , the q-width of the signal more than doubles, Å-1, indicating a net anisotropy of the magnetic response along the (110) direction. Along that direction and at the resonance energy 42 meV, one obtains 0.45 Å-1 for the intrinsic q-width of the magnetic signal after deconvolution from the resolution function in agreement with previous reports Nature_Fong99 ; he .
Concerning the origin of the observed anisotropy of the magnetic response along the diagonals, one needs to keep in mind that the structure of Bi2212 is not simply tetragonal. Indeed, Bi2212 is actually an orthorhombic system with an incommensurate distortion likely of composite type etrillard , because the lattice parameters of the CuO2 planes and those of the BiO2 planes do not match. The orthorhombic axes are along the diagonals of the square lattice: the sample growth direction, i.e. , was kept perpendicular to the scattering plane. The direction (110) in the tetragonal notation we have adopted in this article correspond to . The incommensurate modulation is given by . Because of this modulation, the Bi2212 samples are not twinned, although the in-plane lattice parameters are not very different. It is therefore conceivable that the observed magnetic anisotropy along is related to this 1D structural anisotropy. It is interesting to remark here that in the YBCO system, the magnetic response also exhibits a 1D-like anisotropy of the magnetic intensity, which is maximal along a particular in-plane direction , the (100) direction perpendicular to the CuO chains Nature_Hinkov04 . As the CuO chains in YBCO, the BiO2 planes in the Bi2212 system play the role of charge reservoir. We therefore cannot exclude that the diagonal anisotropy is a feedback of the structural distortion on the magnetic properties. However, there are differences in the magnetic anisotropy of both systems. In the YBCO system, the anisotropy near optimal doping is mostly related to the intensity Nature_Hinkov04 . Here, the q-extension of the magnetic signal appears to be different along the two directions. Further INS experiments in which the two in-plane directions and are studied under the same resolution conditions, following prior work in YBCO Nature_Hinkov04 , will be needed to shed light on the origin of the anisotropy of the magnetic response in Bi2212.
We report in Fig. 6.f the momentum dependence of the threshold of the continuum at 40 meV. The area I centered at the AF wave vector exhibits a diamond shape, whereas the area II splits into 8 segments (4 along the diagonals and 2 along and ). The red points in the figure indicate the total momentum expansion of the magnetic responses (roughly twice the full width of the signal at half maximum), as deduced from Fig. 4.b. The data have been symmetrized to account for the fourfold symmetry of the CuO2 plane although, as we have remarked above, it is not known whether the magnetic signal respects the square lattice symmetry. Anyway, one notices in Fig. 6.f that the magnetic signal matches the area I along (100) but extends into area II along the diagonals. However, the intensity of the magnetic signal in area II along the (110) direction is of the same order as the error bars in the measurement performed along the (100) direction. We therefore cannot rule out the existence of a weak response in area II also along the (100) direction, but this extra magnetic response (if any) vanishes along the (130) direction where area II is absent.
Finally, whatever the origin of the anisotropy, its observation allows us to solve an old puzzling issue. In the initial work of Fong et al. in optimally doped Bi2212 Nature_Fong99 , it was found that the energy-integrated spectral weight at of the magnetic resonance peak was similar in optimally doped Bi2212 and YBCO (), whereas the local spin susceptibility (integrated in momentum space) was actually four times larger in Bi2212 than YBCO. This discrepancy came from the estimation of local spin susceptibility based on the assumption that the momentum distribution of the magnetic response was isotropic in Bi2212, as it is the case at in YBCO. Since the measurement of the momentum width of the magnetic signal along the (110) direction of Bi2212 was found to be twice as large as in YBCO, the local susceptibility was estimated to be four times larger. Considering Fig. 6.f, the momentum shape at the resonance energy found in optimally doped YBCO typically corresponds to only area I, and extra scattering in area II occurs at larger energy PRL_Pailhes04 . In optimally doped Bi2212, this extra magnetic scattering in area II is found around the same energy as the resonance peak, yielding a much broader peak in q-space. Therefore, the present study shows that the assumption of an isotropic magnetic response was not correct, leading to an overestimation of the local spin susceptibility. This implies that the q-integrated spectral weight is likely quite similar in both systems.
VI Origin of the collective mode: RPA description
Based on the energy and momentum distribution of the resonant spin excitations in the SC state, we have shown above that our INS data exhibit fingerprints of the -wave gapped Stoner continuum. This puts constraints on the origin of the collective mode. However, as far as the electron-hole spin flip continuum is taken into account, both itinerant and localized spin models can, in principle, describe the data. Since the charge excitation spectrum and the SC gap are well-known in the Bi2212 family from a considerable amount of ARPES data, this system is the right candidate to test these scenarios quantitatively. Here, we apply the spin-exciton model Eschrig_review ; PRL_Chubukov99 ; norman ; PRB_Onufrieva02 ; PRB_Schnyder04 ; PRL_Eremin05 using the measured band structure parameters and SC gap. Furthermore, within that framework, one can relate the energy width of the resonance peak to the spatial distribution of the SC gap as reported by Scanning Tunnelling Microscopy (STM) PRL_McElroy05 ; Nature_Davis06 . We then investigate the magnetic excitation dispersion along the two directions studied by INS in order to put this comparison on a quantitative footing.
In the spin-exciton scenario, the spin susceptibility takes an RPA-like form Eschrig_review :
| (3) |
stands for the standard non-interacting spin susceptibility of a superconductor Eschrig_review ; PRL_Chubukov99 ; norman ; PRB_Onufrieva02 ; PRB_Schnyder04 ; PRL_Eremin05 . The interaction that enhances the magnetic response can be interpreted as: (i) the on-site Coulomb repulsion on copper in weak coupling models (, being of the order of the band width), (ii) the AF superexchange coupling in strongly correlated models (, such as in the t-t’-J model, with 120 meV) norman ; PRB_Onufrieva02 , (iii) an effective spin-fermion coupling in phenomenological models PRL_Chubukov99 ; PRL_Eremin05 .
As before, we limit our calculations to the odd excitations. In this channel involves two-particle excitations between bonding (b) and anti-bonding (a) states: . To calculate , we use a SC gap with symmetry and a normal-state tight binding dispersion previously defined in section IV. In order to facilitate the numerical calculations, we used a small damping parameter of 2 meV, which is smaller than the energy width of the INS resolution. Finally, we use the following phenomenological form for the interaction PRL_Eremin05 . This allows us to capture the different physical origins of the interaction.
For any given wave vector , a sharp magnetic excitation shows up at an energy when the conditions and are fulfilled. For a given magnitude of the SC gap amplitude , the measured energy position of the odd magnetic resonance peak at = constrains the sum of the interaction parameters , whereas the shape of the dispersion is controlled by their ratio .
Let us start by studying the odd magnetic resonance peak at the planar AF wave vector . In Fig. 7, we compare the measured resonant peak energy scan at and the spin excitation spectrum computed with Eq. 3 and convoluted with the energy resolution of the spectrometer. For a slightly overdoped sample with Tc=87K, is set to 35 meV, yielding a threshold of the Stoner continuum of =62 meV at . To obtain a resonance energy at the proper energy, =42 meV, well below , one needs to adjust the interaction =1070 meV, a value significantly exceeding the hopping parameter =397 meV. A systematic investigation yields a ratio , independent of in the range 200-400 meV, in agreement with Ref. PRL_Eremin05, .
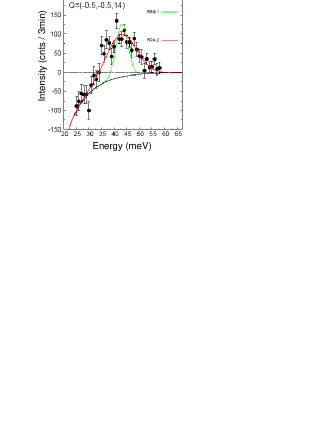
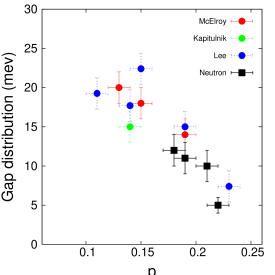
At , the computed spin excitation spectrum is dominated by the spin exciton, whose contribution to the imaginary part of the dynamical spin susceptibility reads: for . The measured magnetic resonance peak should be given by the convolution product of this -function by the Gaussian resolution function of the instrument: it should take the form, where meV is the energy resolution (as shown by the green line (RPA 1) in Fig. 7). Clearly, the energy width of the resonant mode is significantly broader than the expected spectrum, showing that there is an additional contribution to the broadening. This discrepancy is not specific to our sample. Table 1 shows the corresponding energy position and energy width of all Bi2212 samples investigated so far by neutron scattering. For all doping levels, the measured resonant mode is broader than the calculated resolution-limited RPA peak. For a long time now, it has been argued Sidis_review that this broadening might be related to the electronic inhomogeneity of the Bi2212 system, which also manifests itself in the SC gap distribution observed in the real space by STM PRB_Howald ; PRL_McElroy05 ; Nature_Davis06 . Interestingly, when going into the overdoped regime, the broadening of the INS magnetic resonance peak Lucia and the SC gap distribution Nature_Davis06 are reduced simultaneously (see Table 1 for the resonance peak).
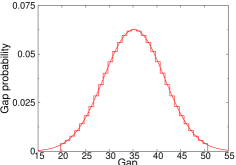
Based on this observation, we have tested the effect of a spatial distribution of SC gap on the spin excitation spectrum within the spin exciton scenario. Spatial variations of the SC gap at the surface of Bi2212 were reported by several groups PRB_Howald ; PRL_McElroy05 ; Nature_Davis06 . The spatially averaged value of the superconducting gap, , measured by STM is consistent with other spectroscopic techniques such as ARPES. The FWHM of the gap distribution, , decreases with increasing doping level (Fig. 9), from around 15 meV at optimum doping to nearly 7 meV for an overdoped sample with a gap average of =23 meV Nature_Davis06 . In our calculation, we use the gap distribution found by STM at optimal doping, and we further assume that the interaction is independent of the local SC gap. Since the local gap amplitude varies, the resonance peak position is different in different patches of the sample. We compute the susceptibility in each patch characterized by a different SC gap value, labelled now . is computed for seventeen different SC gaps with from 20 to 50 meV. The gap distribution is implemented using the histogram shown in Fig. 8, which approximates a Gaussian distribution of the SC gap with a width . The full susceptibility, , is given by the sum over all local susceptibilities :
| (4) |
The total spin susceptibility is further convoluted by the Gaussian resolution function in order to fit the data.
Using this procedure, we can simulate the broadening of the magnetic resonance peak by adjusting the width of the Gaussian gap distribution, (Eq. 4). Figure 7 (fit: RPA 2) shows that the enhancement of the magnetic response in the SC state at the AF wave vector can be well accounted for by an intrinsic SC gap distribution with =14 meV. For an overdoped sample with =70 KLucia , the same analysis gives =5 meV. It is striking that the gap distribution deduced from the fit of the magnetic resonance peak matches the one reported by STM for both doping levels (Fig. 9). In the framework of spin exciton scenario, one can thus give a clear explanation of the energy width of the magnetic resonance excitation. Note that such energy broadening is absent in the YBCO family compounds. This shows that the electronic inhomogeneity is not generic to the cuprates. Similar conclusions about a better homogeneity in YBCO were reached by measuring the quasi-particle lifetimes corson or the 89Y nuclear magnetic resonance linewidths bobroff .
Next, we address the consequences of the SC gap distribution for the q-dependence of magnetic excitations, still within the spin-exciton model. We performed the calculation in the range covered by our experiments, i.e. along both the (110) and (130) directions and between 30 and 60 meV. Using the same set of parameters, we additionally adjust the ratio to obtain the best agreement between the experimental q-dependence (Figs. 6.d,e) and the computed maps of Figs. 10. This corresponds to the case when . We compute the maps of Fig.10 with for both Q directions. As for the energy width at the AF wave vector, the model does not describe the results in the absence of a SC gap distribution (Fig. 10.a and d). One obtains a rather sharp mode dispersion downward as observed in YBCO science_Bourges00 . In contrast (Fig. 10.b and e), the addition of a SC gap distribution (corresponding to the STM data) allows us to describe the main features of the measured magnetic excitation spectrum (Fig. 10.c and f). For the (130) direction, the experimental and computed mappings are quite similar. For the (110) direction, both mappings are consistent, even if below 42 meV the computed spectrum fails to describe the q-broadening of the signal. We found that it is not possible to obtain a signal around 38-40 meV in area II, whatever the q-dependence of the interaction used.
To summarize, using the band structure and the SC gap known from ARPES measurements PRB_Kordyuk03 ; Mesot_PRL99 , the calculation of the magnetic excitations in an itinerant spin approach can reproduce most of the characteristic features of the INS spectrum measured the spin excitation spectrum in the SC state of Bi2212. Further, the observed energy width of the resonant spin excitations in Bi2212 is naturally explained within this model as a result of the gap distribution reported by STM PRB_Howald ; PRL_McElroy05 ; Nature_Davis06 . The measured q-dependence of the magnetic excitations can be also captured by a broadening of dispersive excitations due to the SC gap distribution.
Finally, we comment on a few points about the nature of the interaction, that should provide an indication on the Hamiltonian needed to obtain a spin exciton.
First, one finds a ratio whatever the used band structure. We consider the energy range for which is typically 200-400 meV. Two opposite limits can then be discussed: (i) a weak coupling approach, where the band structure is not far from the LDA one, i.e. meV, then the interaction is an effective on-site Coulomb repulsion, (ii) a strong coupling approach, where one chooses an effective band width, i.e. meV, reduced from the LDA value due to the strong electronic correlations and with an interaction given by the AF superexchange interaction (in principle measured in the AF insulating state). In the first limit, using =395 meV, the effective interaction meV can be directly compared to the band width, . One finds 0.35, which clearly belongs to the weak coupling approach DMFT with an effective on-site Coulomb interaction on copper. In the other limit, is around 200 meV and then =540 meV. This value can then be reduced to as expected in the model PRB_Onufrieva02 , yielding meV. In the insulating state, is usually related to the on-site Coulomb interaction as , yielding =1185 meV. Surprisingly, the ratio between the interaction and the band width is found to be quite small as 0.74, i.e. in an intermediate regime not far from the weak coupling side.
Next, we found that is rather weakly dependent on the wave vector, since . It is worth to note that in case of a momentum independent interaction, i.e. , Eq. 3 is unstable towards a spin-density wave state using the band structure observed by ARPES in Bi2212. In the other limit, still taking the same electronic parameters but only a q-dependent interaction, i.e. , one observes a resonance peak which first disperses upward and then downward when approaching the electronic continuum delimiting the area I and II in Fig. 6 (i.e. the silent bands). Such an ”M”-shaped dispersion is not observed in Bi2212, although the SC gap distribution renders the experimental situation too complex to rule this out entirely. Further, it is shown in Ref. norman, that the exact magnetic mode dispersion is extremely sensitive to the detailed tight-binding parametrization of the band structure. Therefore, depending on details of the band structure, one can easily move from a weakly to a strongly q-dependent interaction.
Lastly, an important issue with the spin exciton model is related to the apparent observed ”X”-shaped or hour-glass dispersion. Within the RPA approach it is difficult to reproduce downward- and upward-dispersing branches merging around . This is because in the simple RPA susceptibility of Eq. 3, there is only a single pole for a given wave vector below the electronic continuum, especially in area I. The high-energy part can be understood by a pole condition of the RPA susceptibility below the electronic continuum, but only in area II PRL_Pailhes04 ; PRL_Eremin05 , without direct continuity with the mode at and . This limitation of the spin-exciton model may indicate strong-coupling effects not capture by the RPA formalism. The capability of alternative approximation schemes hubbard-jain ; eremin to reproduce this feature remains to be elucidated.
VII Concluding remarks
We have shown that the spin excitation spectrum in the odd channel of Bi2212 is consistent with the hour glass or ”X”-shaped dispersion previously reported in YBCO for a similar doping level PRL_Pailhes04 ; PRL_Reznik04 . Most aspects of the momentum and energy dependence can be ascribed to the existence of a collective mode, a spin-exciton. The study further reveals that the imaginary part of the dynamical magnetic susceptibility is strongly enhanced below the threshold of the electron-hole spin flip continuum that can be derived from ARPES measurements performed on the same system. This observation suggests that the collective mode decays into elementary electron-hole spin flip excitations when it enters the continuum. Likewise, the influence of the gapped Stoner continuum is confirmed by a recent study of the doping dependence of the characteristic energies and spectral weights of the resonance peaks in both odd and even channels Lucia . In agreement with a similar study carried out over a wide doping range in the (Y,Ca)BCO system PRL_Pailhes06 , the spectral weight of both AF resonance peaks is proportional to their reduced binding energy with respect to the continuum. In our Bi2212 sample (=87 K), the estimate of the threshold of the continuum at the AF wave vector from INS data, meVLucia , agrees remarkably well with the value deduced from ARPES measurements.
As mentioned in the introduction, localized-spin models based on the formation of stripe arrays of spins and charges have been also developed to account for the spin dynamics in high- cuprates. The predictions of these models can also be compared to our INS data obtained below in nearly optimally doped Bi2212 sample. However, in most of these models the effect of the superconductivity has not been addressed theoretically Voj04 ; Uhr04 ; Sei05 . One stripe model that explicitly considers the presence of superconductivity predicts only minor effects, in contrast to our observations And . Most of this theoretical work is based on spin-only models, that is, they consider the magnetic response of localized Cu spins, but typically ignore the charge degree of freedom. However, it has been argued revue_jmt that when the spin-gap is large and close to the saddle-point energy, much of the magnetic spectral weight redistributed below is accumulated at the saddle point, yielding the strong commensurate resonance peak. In principle, this argument should apply to the Bi2212 system where the spin-gap is around 32 meV (Fig 1). However, our data provide evidence that the key factor to understand the spin dynamics in the SC state is the momentum and energy shape of the -wave electron-hole Stoner continuum. In this picture, the spin-gap is ascribed to the energy where the collective mode merges into the continuum. Even in a stripe scenario, a gapped continuum delimiting the spin excitations must also be present. Our study tells us that this continuum has to be similar to the one obtained starting from uniform 2D Fermi liquid theories. One more general grounds, dual (itinerant/localized) spin models incorporating the gapped Stoner continuum PRB_Sega03 ; condmat_Prelovsek06 ; PRB_Onufrieva94 ; JETP_Eremin06 may also be consistent with our data.
Two features of the magnetic dynamics of Bi2212 are at variance with the YBCO system. First, the resonance peak in Bi2212 consistently exhibits an intrinsic energy width Nature_Fong99 ; he ; Lucia . Within the spin-exciton model, we were able to relate this width to the SC gap distribution observed by STM PRB_Howald ; PRL_McElroy05 ; Nature_Davis06 (Fig. 9). Second, we observed in Bi2212 an anisotropy along the diagonal(s) (110) direction, whereas in YBCO the spin excitation spectrum exhibits an energy dependent 1D-like anisotropy Nature_Hinkov04 with maximum spectral weight along . Whatever the origin of these anisotropies, this difference between YBCO and Bi2212 system suggests that the specific form of the in-plane anisotropy of the spin excitations may depend on structural details of individual compounds.
In summary, we have determined the detailed momentum dependence of the resonant spin excitations in the SC state of a nearly optimally doped Bi2212 sample (=87 K. The salient features of this spectrum are well described in an itinerant-electron approach. Interestingly, the intrinsic energy width and its doping dependence are naturally explained by considering the SC gap distribution as measured by STM. The global momentum shape of the measured magnetic excitations is also correctly described within the spin-exciton model in the presence of the same SC gap distribution. The spin excitation spectrum in Bi2212 is delimited by the gapped Stoner continuum in the -wave superconducting state, which can be directly inferred from ARPES data on the same system. Together with prior observations in the YBCO system PRL_Pailhes04 , this underscores the influence of the Stoner continuum as an important ingredient in the description of the spin dynamics in superconducting cuprates with large .
Acknowledgements.
We wish to thank A. Pautrat and C. Simon from CRISMAT laboratory (University of Caen, France) for susceptibility measurements. We also acknowledge stimulating discussions with S. Borisenko, A.V. Chubukov, S. Davis, I. Eremin, M. Eremin, F. Onufrieva, S. Pailhès, P. Prelovc̆ek and J.M. Tranquada. This research project has been supported in part by the Deutsche Forschungsgemeinschaft, Grant No. KE923/1 2 in the consortium FOR538, and in part by the European Commission under the 6th Framework Programme through the Key Action: Strengthening the European Research Area, Research Infrastructures. Contract n∘: R113-CT-2003-505925.References
- (1) [∗] To whom correspondence should be addressed; E-mail: bourges@llb.saclay.cea.fr
- (2) For a review, see Y. Sidis, S. Pailhès, B. Keimer, P. Bourges, C. Ulrich, and L. Regnault, Phys. Stat. Sol. (b) 241, 1204 (2004).
- (3) J. Rossat-Mignod, L.P. Regnault, C. Vettier, P. Bourges, P. Burlet, J. Bossy, J.Y. Henry, and G. Lapertot, Physica C 185-189, 86 (1991).
- (4) H.A. Mook, M. Yehiraj, G. Aeppli, T.E. Mason, and T. Armstrong, Phys. Rev. Lett. 70, 3490 (1993).
- (5) H.F. Fong, B. Keimer, P.W. Anderson, D. Reznik, F. Doğan, and I.A. Aksay, Phys. Rev. Lett. 75, 316 (1995).
- (6) P. Bourges, L.P. Regnault, Y. Sidis and C. Vettier, Phys. Rev. B 53, 876 (1996).
- (7) H.F. Fong, B. Keimer, D. Reznik, D.M. Milius, and I.A. Aksay, Phys. Rev. B 54, 6708 (1996).
- (8) P. Bourges, Y. Sidis, H.F. Fong, B. Keimer, L.P. Regnault, J. Bossy, A.S. Ivanov, D.L. Milius, and I.A. Aksay, in High Temperature Superconductivity , Eds. S.E. Barnes et al, (CP483 American Institute of Physics, Amsterdam, 1999), 207-212 (cond-mat/9902067).
- (9) H.F. Fong, P. Bourges, Y. Sidis, L.P. Regnault, J. Bossy, A.S. Ivanov, D. L. Milius, I. A. Aksay, and B. Keimer, Phys. Rev. B 61, 14773 (2000).
- (10) P. Dai, H.A. Mook,R. D. Hunt, F. Doğan, Phys. Rev B., 63, 054525 (2001).
- (11) H.F. Fong, P. Bourges, Y. Sidis, L.P. Regnault, A. Ivanov, G.D. Gu, N. Koshizuka, and B. Keimer, Nature 398, 588 (1999).
- (12) H.F. He, Y. Sidis, P. Bourges, G.D. Gu, A. Ivanov, N. Koshizuka, B. Liang, C.T. Lin, L. P. Regnault, E. Schoenherr, and B. Keimer, Phys. Rev. Lett. 86, 1610 (2001).
- (13) H.F. He, P. Bourges, Y. Sidis, C. Ulrich, L.P. Regnault, S. Pailhès, N.S. Berzigiarova, N.N. Kolesnikov, and B. Keimer, Science 295, 1045 (2002).
- (14) P. Bourges, Y.Sidis, H.F. Fong, L.P. Regnault, J. Bossy, A.S. Ivanov, and B. Keimer, Science, 288 1234 (2000).
- (15) S. Pailhès, Y. Sidis, P. Bourges, V. Hinkov, A. Ivanov, C. Ulrich, L. P. Regnault, and B. Keimer, Phys. Rev. Lett. 93, 167001 (2004).
- (16) D. Reznik, P. Bourges, L. Pintschovius, Y. Endoh, Y. Sidis, T. Masui and S. Tajima, Phys. Rev. Lett. 93, 207003 (2004).
- (17) H. Woo, P. Dai, S. M. Hayden, H. A. Mook, T. Dahm, D. J. Scalapino, T. G. Perring and F. Doğan, Nature Physics 2, 600 (2006).
- (18) P. Bourges, H.F. Fong, L.P. Regnault, J. Bossy, C. Vettier, D.L. Milius, I.A. Aksay and B. Keimer, Phys. Rev. B 56 R11439 (1997).
- (19) C. Stock, W. J. L. Buyers, R. Liang, D. Peets, Z. Tun, D. Bonn, W. N. Hardy and R. J. Birgeneau, Phys. Rev. B 69 014502 (2004).
- (20) S.M. Hayden, H. A. Mook, Pengcheng Dai, T.G. Perring and F. Doğan Nature 429, 531 (2004).
- (21) V. Hinkov, S. Pailhès, P. Bourges, Y. Sidis, A. Ivanov, A. Kulakov, C. T. Lin, D. P. Chen, C. Bernhard, B. Keimer, Nature 430, 650 (2004).
- (22) V. Hinkov, P. Bourges, S. Pailhès, Y. Sidis, A. Ivanov, C.T. Lin, D.P. Chen and B. Keimer, preprint cond-mat/0601048.
- (23) see e.g. D. Scalapino Phys. Rep. 250 329 (1995).
- (24) J.M. Tranquada, H. Woo, T. G. Perring, H. Goka, G. D. Gu, G. Xu, M. Fujita and K. Yamada, Nature 429, 524 (2004).
- (25) J.M. Tranquada, Proc. SPIE 5932, 59320C (2005), (cond-mat/0508272); in ”Treatise of High Temperature Superconductivity” by J. Robert Schrieffer, (cond-mat/0512115).
- (26) M. Vojta and T. Ulbricht, Phys. Rev. Lett. 93, 127002 (2004).
- (27) G. S. Uhrig and K. P. Schmidt and M. Grüninger, Phys. Rev. Lett. 93, 267003 (2004).
- (28) G. Seibold and J. Lorenzana, Phys. Rev. Lett. 94,107006 (2005).
- (29) M. Vojta and T. Vojta and R. K. Kaul, Phys. Rev. Lett., 97, 097001, (2006).
- (30) For a review, see M. Eschrig, Adv. Phys. 55, 47 (2006) and references therein.
- (31) Ar. Abanov and A. V. Chubukov, Phys. Rev. Lett. 83, 1652 (1999).
- (32) M.R.Norman, Phys. Rev. B 63, 092509 (2001).
- (33) F. Onufrieva and P. Pfeuty, Phys. Rev. B 65, 054515 (2002).
- (34) A. P. Schnyder, A. Bill, C. Mudry, R. Gilardi, H. M. Ronnow, and J. Mesot Phys. Rev. B 70, 214511 (2004).
- (35) I. Eremin, D. K. Morr, A. V. Chubukov, K. H. Bennemann, and M. R. Norman Phys. Rev. Lett. 94, 147001 (2005).
- (36) I. Sega, P. Prelovc̆ek, and J. Bonc̆a Phys. Rev. B 68, 054524 (2003).
- (37) P. Prelovc̆ek and I. Sega, preprint, condmat/0607324.
- (38) F. Onufrieva and J. Rossat-Mignot, Phys. Rev. B 75, 7572 (1995).
- (39) M. V. Eremin, A. A. Aleev and I. M. Eremin JETP Lett. 84, 167 (2006).
- (40) S. V. Borisenko, A. A. Kordyuk, V. Zabolotnyy, J. Geck, D. Inosov, A. Koitzsch, J. Fink, M. Knupfer, B. Büchner, V. Hinkov, C. T. Lin, B. Keimer, T. Wolf, S. G. Chiuzbăian, L. Patthey, and R. Follath Phys. Rev. Lett., 117004 (2006); cond-mat/0608295.
- (41) A. Damascelli and Z. Hussain and Z. X. Shen, Rev. Mod. Phys.,75, 473 (2003).
- (42) A. Kordyuk, S. V. Borisenko, M. Knupfer, and J. Fink, Phys. Rev. B 67, 064504 (2003); A. A. Kordyuk, S. V. Borisenko, A. Koitzsch, J. Fink, M. Knupfer, and H. Berger, Phys. Rev. B 71, 214513 (2005).
- (43) C. Howald, P. Fournier, and A. Kapitulnik, Phys. Rev. B, 64, 100504 (2001).
- (44) K. McElroy, D.-H. Lee, J. E. Hoffman, K. M. Lang, J. Lee, E. W. Hudson, H. Eisaki, S. Uchida, and J. C. Davis Phys. Rev. Lett. 94, 197005 (2005).
- (45) J. Lee, K. Fujita, K. McElroy, J. A. Slezak, M. Wang, Y. Aiura, H. Bando, M. Ishikado, T. Masui, J.-X. Zhu, A. V. Balatsky, H. Eisaki, S. Uchida, and J. C. Davis, Nature 442, 546 (2006).
- (46) U. Chatterjee, D. K. Morr, M. R. Norman, M. Randeria, A. Kanigel, M. Shi, E. Rossi, A. Kaminski, H. M. Fretwell, S. Rosenkranz, K. Kadowaki, J. C. Campuzano, preprint, cond-mat/0606346.
- (47) D. Inosov, S. Borisenko, I. Eremin, A. Kordyuk, V. Zabolotnyy, J. Geck, A. Koitzsch, J. Fink, M. Knupfer, B. B chner, H. Berger, R. Follath, preprint, cond-mat/0612040.
- (48) S. Pailhès, Y. Sidis, P. Bourges, C. Ulrich, V. Hinkov, L.P. Regnault, A. Ivanov, C. Bernhard, B. Liang, C.T. Lin, and B. Keimer, Phys. Rev. Lett. 91, 237002 (2003).
- (49) L. Capogna, B. Fauqué, Y. Sidis, C. Ulrich, P. Bourges, S. Pailhès, A. Ivanov, J.L. Tallon, B. Liang, C.T. Lin, A.I. Rykov and B. Keimer, preprint, cond-mat/0610869.
- (50) S. Shamoto, M. Sato, J.M. Tranquada, B. Sternlieb, and G. Shirane, Phys. Rev. B 48, 13817 (1993).
- (51) D. Reznik, L. Pintschovius, Y. Endoh, P. Bourges, Y. Sidis, T. Masui, S. Tajima, J. Phys. Chem. Solids, 67, 509 (2006).
- (52) J. Mesot, M. Norman, H. Ding, M. Randeria, J. Campuzano, A. Paramekanti, H. Fretwell, A. Kaminski, T. Takeuchi, T. Yokoya, T. Sato, T. Takahashi, T. Mochiku, and K. Kadowaki, Phys. Rev. Lett. 83, 840 (1999).
- (53) J.L. Tallon, Phys. Rev. B 68, 180501 (2003).
- (54) J. Chang, S. Pailhès, M. Shi, M. Månsson, T. Claesson, O. Tjernberg, J. Voigt, V. Perez-Dieste, L. Patthey, N. Momono, M. Oda, M. Ido, A. Schnyder, C. Mudry, J. Mesot, preprint, cond-mat/0610880.
- (55) J. M. Perez-Mato, J. Etrillard, J. M. Kiat, B. Liang, and C. T. Lin Phys. Rev. B 67, 024504 (2003).
- (56) S. Pailhès, C. Ulrich, B. Fauqué, V. Hinkov, Y. Sidis, A. Ivanov, C.T. Lin, B. Keimer, and P. Bourges, Phys. Rev. Lett. 96, 257001 (2006).
- (57) J.Corson, J. Orenstein, Seongshik Oh, J. O’Donnell, and J. N. Eckstein, Phys. Rev. Lett. 85, 2569 (2000).
- (58) J. Bobroff, H. Alloul, S. Ouazi, P. Mendels, A. Mahajan, N. Blanchard, G. Collin, V. Guillen, and J.-F. Marucco, Phys. Rev. Lett. 89, 157002 (2002)
- (59) J. Hubbard and K.P. Jain, J. Phys. C (Proc. Phys. Soc.), 1, 1650 (1968).
- (60) I. Eremin, O. Kamaev, and M. V. Eremin, Phys. Rev. B 69, 094517 (2004).
- (61) G. Kotliar and D. Vollhardt Physics Today 57, 53 (2004).
- (62) B.M. Andersen and P. Hedegaard, Phys. Rev. Lett. 95, 037002 (2005).